Last updated: May 1, 2024
Article
SECN Vocal Anuran Community Monitoring Program Summary
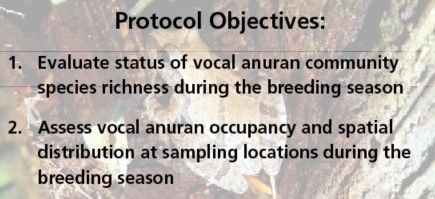
Overview
Amphibians rely on the availability of fresh, clean water to survive and successfully reproduce. Anuran communities respond fairly quickly to environmental stressors or changes. Changes in anuran species composition, richness, and distribution on the landscape may reflect alterations to underlying ecological conditions of park resources.
National parks comprise valuable protected landscapes where long–term monitoring can detect and track anuran population trends that can inform assessments of ecosystem integrity and sustainability. Our monitoring data contribute to understanding how park resources and natural communities respond to changing environmental conditions, informing park management decision making.
The southern region of the United States hosts the highest amphibian diversity in North America. The South is home to at least 45 species of anurans (i.e., frogs, toads, and treefrogs). Thirty–two species of anurans have been documented (NPSpecies) within the 15 park units that have been monitored by the National Park Service’s Southeast Coast Inventory and Monitoring Network (SECN) since 2012.
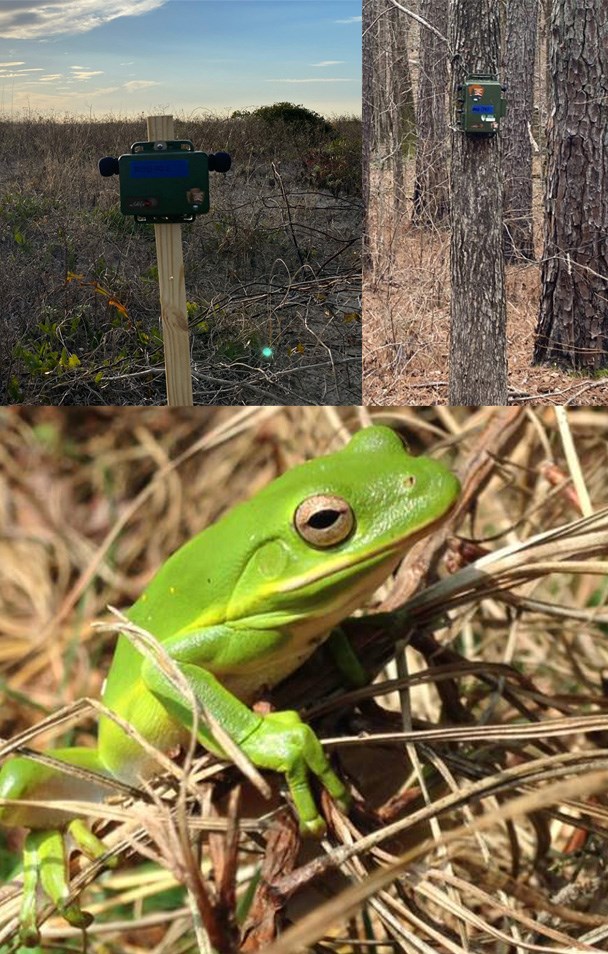
NPS photos / SECN staff and NPgallery.
Methods
Sampling Design
The network utilizes a randomly-selected, spatially-balanced set of sample locations (up to 30 per park), based on considerations including park size, hypothesized variability in wildlife populations, and logistics. Sample locations are permanent and revisited on a three-year rotation, five parks per year.
Data Collection
Automated recording devices (ARDs) are deployed from March to June. They record every fourth night, in 60-second intervals every 20 minutes from 20:00 to 04:40. The ARDs are collected from the field after recording is complete and audio files are downloaded to a computer for classification and analyses.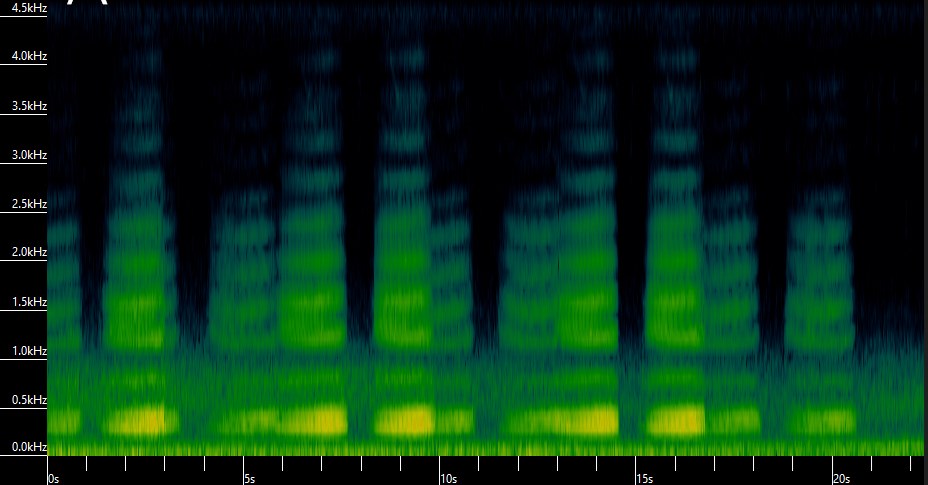
Manual Classification of Recordings and Data Analysis
Classification of recordings is completed using the computer program Kaleidoscope Pro. A subset of potential signals are extracted and manually classified. Species richness and related characteristics, occupancy, and spatial distribution of the park’s vocalizing anuran community are analyzed. A percentage of potential signals extracted out are manually classified. Only detections of anurans identified to the species level are included in the analysis. Metrics for native vs. non-indigenous species, if applicable, are calculated separately.
Species Richness and Composition
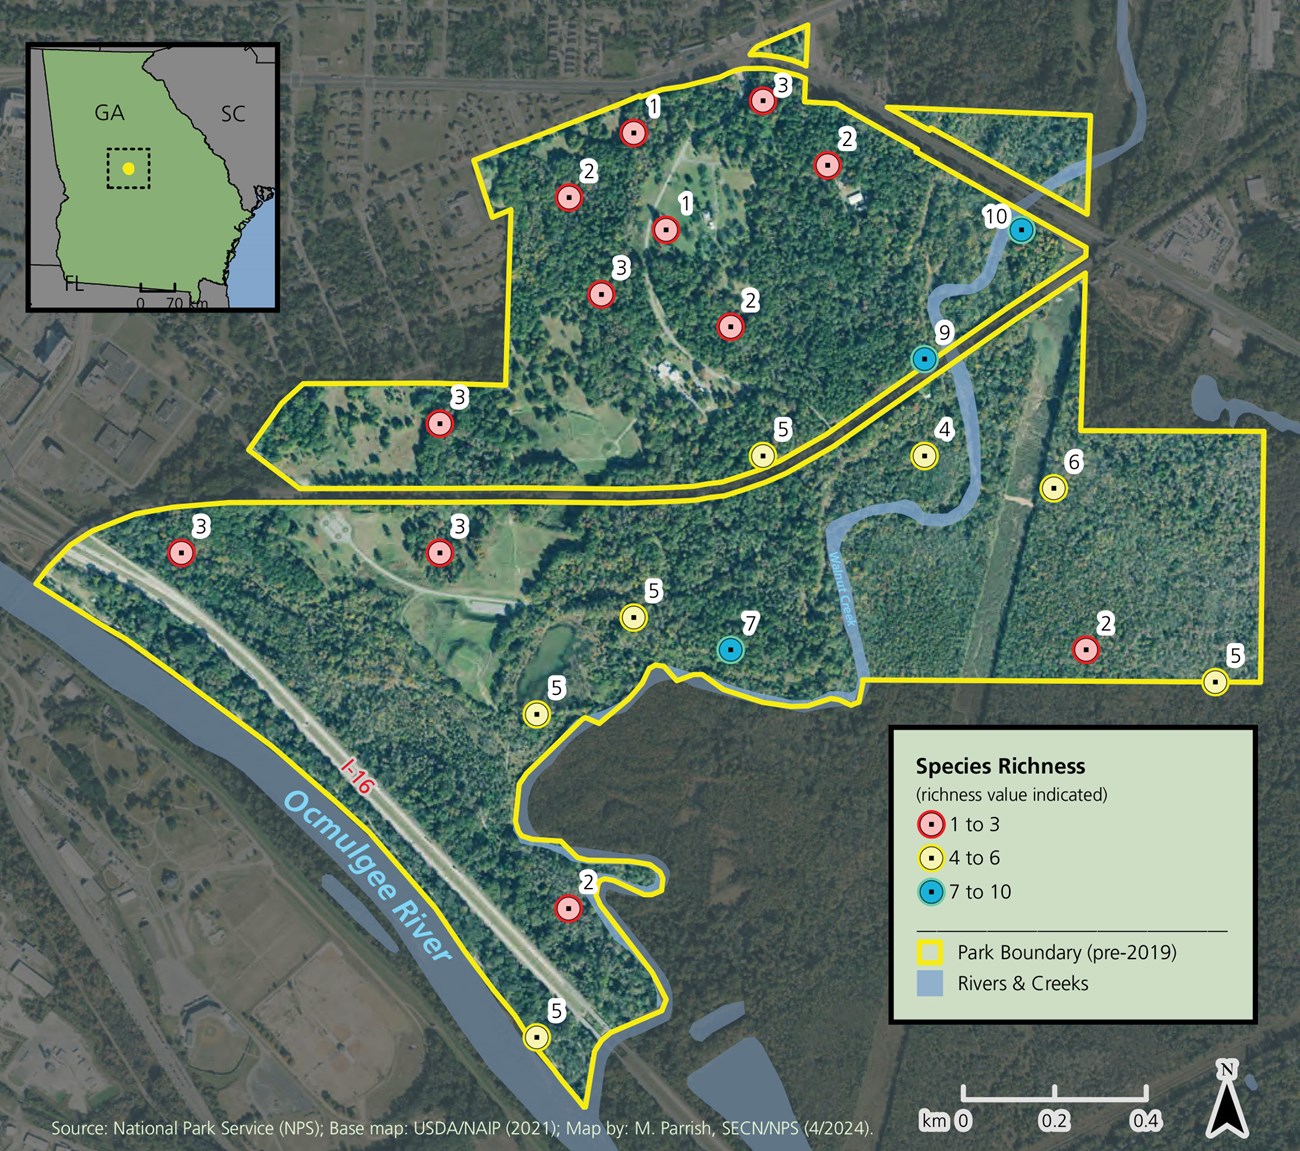
Species richness, a count of unique species, is calculated for each park as a whole as well as at the sample location scale. Species richness is calculated separately for native versus non–indigenous species.
Occupancy
Naïve occupancy or frequency of occurrence is calculated as the percent of sampling locations where a species was detected in one or more recordings.
Spatial Distribution
Species incidence records are mapped to visually assess spatial distributions of detected anurans across the park. Understanding anuran distribution informs park management of species and their requisite habitats. Trend analysis can assess changes in species distribution and community makeup, highlighting influences on park diversity (e.g., land use change and habitat condition, climate issues, and hydrological processes).
About the Southeast Coast Network
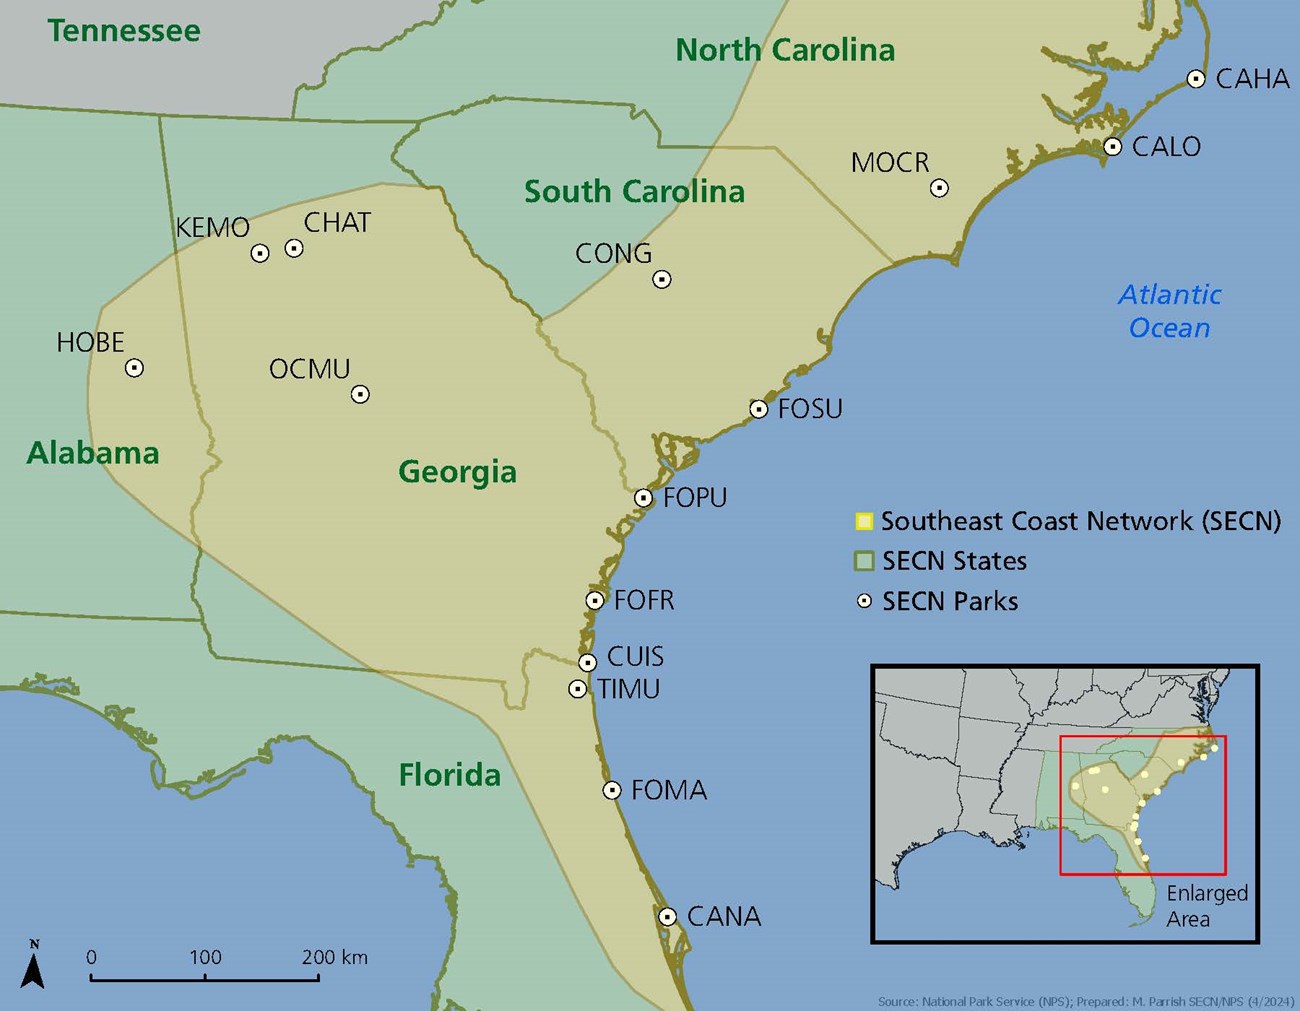
The Southeast Coast Network (SECN) includes eighteen administrative areas containing twenty park units, fifteen of which contain significant and diverse natural resources. In total, SECN parks encompass more than 184,000 acres of federally–managed land across North Carolina, South Carolina, Georgia, Alabama, and Florida. The parks serve a wide diversity of cultural and natural resource missions and include: five national monuments, four national seashores, three national battlefield parks, two national historic parks, a national memorial, a national recreation area, an ecological and historic preserve, and a single national park. The parks range in size from slightly more than 20 acres to nearly 60,000 acres, and when considered with non–federal lands jointly managed with NPS, the network encompasses more than 253,000 acres.For More Information
SECN Home Page(https://www.nps.gov/im/secn/index.htm)
NPS Inventory and Monitoring Program
(https://www.nps.gov/im/index.htm)
