Last updated: May 1, 2024
Article
Vegetation Monitoring at Ocmulgee Mounds NHP

SECN photos / Mark Hynds
Why We Care About the Vegetation?
It didn’t look like much. Tucked away behind a maintenance building, partially bordered by a tall fence capped with barbed wire, this patch of seemingly overgrown vegetation at Ocmulgee Mounds National Historical Park appeared more suited for a visit from a landscaping crew than a pair of scientists. But the vegetation team from the Southeast Coast Inventory and Monitoring Network recognized opportunity, and a plot full of cool data.
Even though OCMU is known for Its wealth of cultural resources and documents the site of a pre European native American settlement complex, its natural resources are significant in a rapidly expanding urban area. Located in Macon, Georgia, Ocmulgee Mounds NHP is one of 15 parks where the network monitors vegetation communities, a key indicator of overall ecosystem health. because changes in vegetation condition reflect the effects of stressors such as extreme weather, disease, invasive species, fire, and land use change. Plants also provide the structured habitat and food resources on which other species depend.
Locating the Plot
A pilot vegetation monitoring program began in 2011 at the park and subsequent monitoring efforts were conducted in 2014 and 2017. But this was the first visit under the guidance of the network’s updated protocol, published in 2019. Plot locations for the park were generated using a random stratified sampling approach based on habitat types specific to Ocmulgee Mounds NHP. Those types include Coastal Plain alluvial forests and Coastal Plain upland forests. The team, SECN Botanist Forbes Boyle and SECN Biological Technician, Elizabeth Rico, were tasked with assessing whether those system-generated plots were suitable for monitoring. They looked at how safely the plot could be accessed, if it spanned multiple broad habitat types, if it was on private land, or contained non-vegetated surfaces like roads, trails, or manicured lawns. Vegetation maps also helped determine total acreage of each targeted habitat type in the park to come up with an adequate sample size for monitoring.
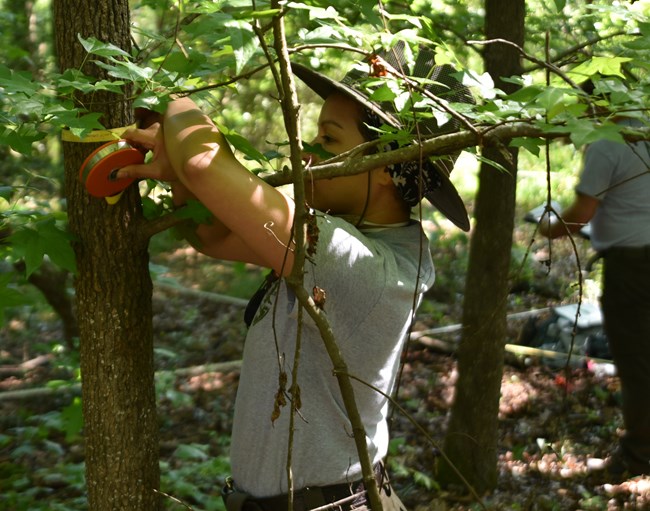
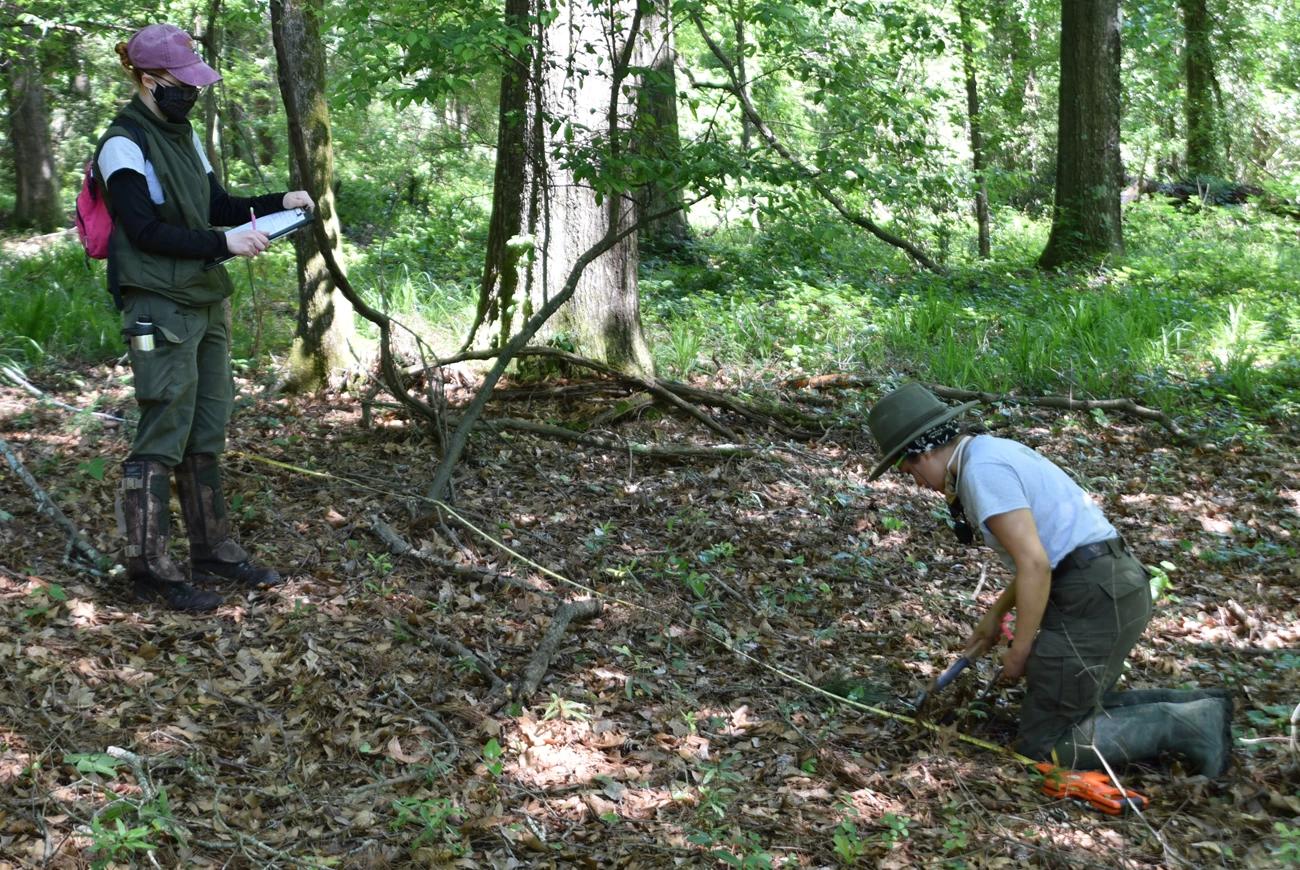
Along with map reading and orienteering skills, getting to every plot requires a GPS unit. Some plots require a treacherous hike or even a boat ride to reach. For this plot, things were simple. The team parked the truck in the adjacent parking lot and unloaded the gear. Forbes and Elizabeth tracked to the center of the plot using a GPS unit, then set up shop on a mild and sunny spring morning back in May. These vegetation monitoring plots are square shaped with 20-meter sides that surround four 10 × 10-meter modules, like the court for the childhood game foursquare. After locating the center point of the plot, the team established the boundaries with a combination of fiberglass measuring tape, chaining pins and rebar.

SECN photo / Mark Hynds
Collecting Data
On every sampling visit, the team completes several major tasks. Those include recording site characteristics, taking plot photo points, measuring tree diameter and health, drawing a tree map, determining density of seedlings and saplings, estimating canopy cover and height, measuring species presence at multiple spatial scales and cover, estimating fire fuel load, and linking the plot to its most comparable U.S. National Vegetation Classification (NVC) association type. Site disturbance information, like the presence of recent or past fire, deer grazing or hog damage, and heavy windthrow is collected. Because these plots were newly established, additional environmental data were collected on landform and soil elements.
The goal of the monitoring is to answer the following questions: How many different species are in the park’s dominant habitat types and what is the relationship between native, non-native, and invasive ones? What are the most common plants found and were there any rare species detected? What is the relative ratio of woody species within the canopy, seedling, and sapling strata? Finally, are there any detectable stressors to park vegetation that could impact the overall health of these communities?
Photos are important pieces of data and were taken of the plot, one from the center of the western side looking east, and one from the center of the eastern side looking west. A 360° camera set up on a tripod was also used, taking photos from the center of the plot. The initial view was set to due north and then the scene was recorded. These types of photos will allow resource managers to “virtually” visit the entire plot from their comfort of their offices or share with visitors who can’t make these types of visits.
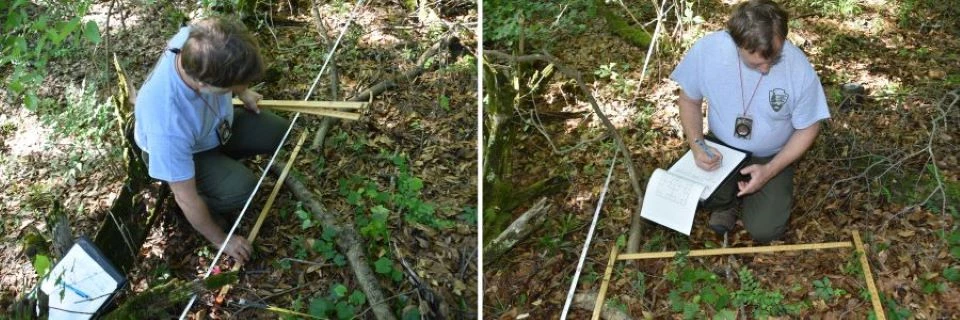
Forbes started recording species presence but instead of covering the entire plot, or even one of the four modules, he created a nested subplot or quadrat, laying out meter sticks in two of the module corners. A pre-planned pattern is used so the sampled corners are not adjacent to a corner in another module. On his knees with clipboard in hand, Forbes carefully checked each plant. Species names must follow a specific nomenclature standard, which for the Southeast Coast Network is Alan Weakley’s 2020 edition of the Flora of the Southeastern United States. Forbes identified and recorded everything in that first corner. Knowing what is there helps determine the presence of invasive species, which are important to park managers and can negatively impact the park’s native vegetation community.
Elizabeth conducted canopy closure estimates using a spherical densiometer, a device which measures canopy closure by translating the proportion of the sky obscured by vegetation into a number. It is a measure of the density of leafy photosynthetic forest cover. Plants utilize sunlight to synthesize nutrients from carbon dioxide and water. Generally, a high amount of canopy closure indicates a low light environment on the forest floor. On the flip side, a low amount of canopy can show a change due to a natural or human caused disturbance such as wind or pest damage.

SECN photos / Mark Hynds

SECN photo / Mark Hynds
Learning about the Trees
Using a clinometer, Elizabeth also calculated stand height or average stand height by measuring the heights of three co-dominant trees inside or just outside the plot. Stand height is used to determine the volume of live trees for the plot. The stand height or volume of live trees can then be compared to the volume of dead trees, and coarse woody debris on the forest floor.
The pair tag-teamed to get tree measurements and collect woody stem data. Woody stems include trees, shrubs, and vines. Live trees and even dead trees still standing get counted. The only caveat to measuring the dead ones is they can’t lean more than 45 degrees away from vertical (standing straight). If it was determined to be “really dead,” decay class and snag height information is collected. A tree map was also created showing all woody stems, both live and dead. The map will help future teams know which trees were measured previously.
Other tree-related data the team collected included the crown, vigor, degree of dieback and condition. Data codes are assigned describing the tree’s crown position in the canopy and the amount of sunlight received, from full sunlight to completely below the canopy. A tree’s vigor code measures the overall tree health and vitality, from healthy to functionally dead. Dieback codes represent a percentage of the amount of crown silhouette involved in dieback, from 1–100%. Finally, only trees showing damage, or a tree condition will get a code, including those connected to pests and pathogens.

SECN photo / Mark Hynds
Risks for Fire
Fuel loads, while not part of the living vegetation community, represent past growth that is currently dead. This helps determine the level of fire risk. Sampling is done along three 25-meter transects. One stretches out due north from the center of the plot. The other two head southeast and southwest at bearings 135° and 225°. The measuring tape is used to designate the transects. Flags are placed at the 5, 7, 10 and 25-meter position on the tape. The percent of slope for each transect is measured from the plot center using a clinometer.
Elizabeth measured coarse woody debris and fine woody debris along the transects from the top of the duff layer up to 2 meters. The duff layer lies between the litter layer the soil. Litter consists of twigs, dead grasses, recently fallen leaves and pine or other needles. Coarse woody debris are downed trees and large branches greater than 8 centimeters in diameter that cross the plane of a transect. Diameter and decay class codes are recorded for each piece of coarse woody debris. Decay classes range from freshly fallen or hard when kicked, to a piece that doesn’t hold its shape and breaks apart when stepped on. Fine woody debris are pieces of downed woody material that are less than 8 centimeters in diameter; they are broken into the following fuel classes based on size: 1-hour fuels (0–0.64 centimeters), 10-hour fuels (0.64–2.54 centimeters), and 100-hour fuels (2.54–8.1 centimeters). Elizabeth used a trowel and a plastic ruler to take duff and litter depth measurements. Sample measurements are taken in 3-foot circles positioned at the 15 meter and 25-meter points on the tape.
The Big Picture at OCMU
Eight plots were established and sampled in Ocmulgee Mounds NHP, four plots in alluvial forests and four in upland forests. A summary report will be published in the near future, summarizing the results of the data collection. This baseline report will focus on species diversity and abundance (trees, shrubs, vines, herbs/forbs/graminoids), woody stem metrics, disturbances and threats, geomorphology and soils, and fuel load estimates. Monitoring plants and their associated communities helps stakeholders know what is happening in the park’s ecosystem. Management can then make informed decisions involving the park’s natural resources.
