Last updated: August 21, 2024
Article
Assessment of Estuarine Water Quality at Cumberland Island National Seashore: 2022 Data Summary
By Eric N. Starkey, SECN Aquatic Ecologist
Summary and Key Findings
NPS photo / SECN staff
In July 2022 the Southeast Coast Network assessed water-quality at Cumberland Island National Seashore as part of the National Park Service Vital Signs Monitoring Program. Monitoring was conducted following methods developed by the Environmental Protection Agency (EPA) as part of the National Coastal Assessment Program (EPA 2014). Laboratory analysis measured chlorophyll a and total and dissolved concentrations of nitrogen and phosphorous. Field measurements included water temperature, pH, dissolved oxygen, and salinity. Water clarity, which requires a Secchi depth measurement, was calculated when possible. All measured parameters were rated as good, fair, or poor based on thresholds set by the EPA (2012).
-
Chlorophyll a concentrations were rated fair at all thirty sites (100%).
-
Dissolved inorganic nitrogen concentrations were good at all thirty sites (100%).
-
Dissolved inorganic phosphorus concentrations were good at three sites (10%) and fair at twenty-seven sites (90%).
-
Dissolved oxygen concentrations (bottom) were rated good at twenty-four sites (80%) and fair at six sites (20%).
-
A water-quality condition summary index was calculated for each site sampled at Cumberland Island National Seashore based on the categorical assessments of chlorophyll a, DIN and DIP concentrations, dissolved oxygen, and water clarity. This summary index indicated good water-quality conditions at three sites (10%) and fair water quality conditions at twenty-seven sites (90%).
-
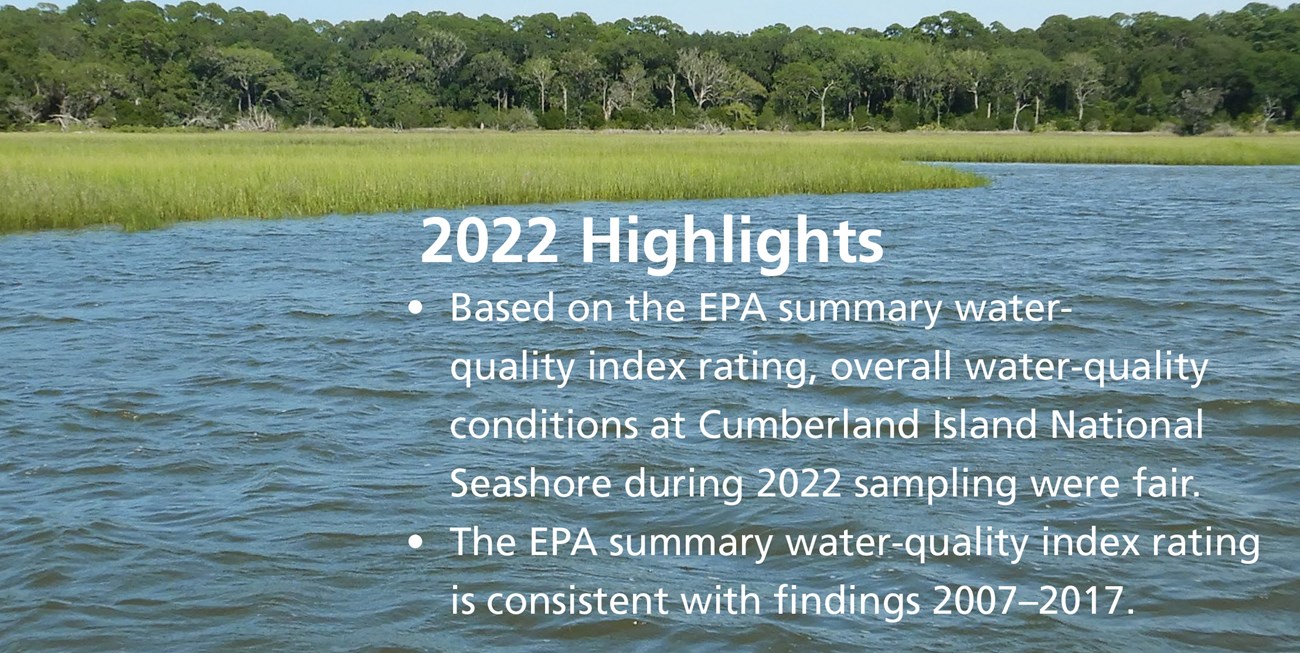
Based on the EPA summary water-quality index rating, overall water-quality conditions at Cumberland Island National Seashore during 2022 sampling were fair.
- The EPA summary water-quality index rating is consistent with findings 2007–2017.
Introduction
Overview
Due to the importance of water resources to park management from ecological, regulatory, and visitor experience perspectives, estuarine water and sediment quality in and around parks were selected to be monitored by the National Park Service (NPS) Inventory and Monitoring Division’s Southeast Coast Network (SECN; DeVivo et al. 2008). Since 2005, the network has employed a multiscale approach to assess estuarine resources in seven park units located in North Carolina, Georgia, and Florida. Data collected as part of this effort are intended help resource managers: (1) better understand ecological processes and impacts caused by development, (2) make informed management decisions, and (3) form/maintain strategic partnerships to monitor and improve water quality conditions in and around park units. In addition, given the diverse and dynamic nature of estuaries, this monitoring is intended to capture the spatial and temporal variability of these systems. Monitoring at permanent fixed stations using continuous data loggers and discrete samples allow for evaluation of temporal patterns in core water quality parameters (dissolved oxygen, pH, salinity, temperature, and turbidity), nutrients (nitrogen, phosphorus, and chlorophyll a).
While fixed-station monitoring provides fine resolution data to determine diel, monthly, and seasonal fluctuations in water quality, it lacks spatial extent. To fill this gap, spatial variability of water and sediment quality is determined with park-wide assessments every five years. These assessments include discrete sampling of nutrients, water quality parameters, and evaluation of sediment contaminates following methods developed by the Environmental Protection Agency-National Coastal Assessment Program. This monitoring approach leads to an understanding of the spatiotemporal status and variability of estuarine water quality and yields information useful to park management.
The Southeast Coast Network's monitoring approach is extensively documented in the Protocol for Monitoring Estuarine Water and Sediment Quality in Selected Southeast Coast Network Parks: Protocol Narrative (Starkey et al. 2023) and associated Standard Operating Procedures (SOPs). Version 1.0 of the protocol (Gregory et al. 2013) was implemented between 2007 and 2018. Version 2.0 of the protocol was implemented 2019 to present and was updated to be aligned with new technology and techniques documented in revised Standard Operating Procedures. Monitoring objectives remain consistent across both versions of the protocol.
Monitoring Objectives
The Southeast Coast Network identified an overall goal of monitoring the status and trends in water and sediment quality in estuaries surrounding SECN parks. To achieve this goal, data are collected and analyzed to meet four specific monitoring objectives. These objectives remain consistent across both versions of the protocol (Gregory et al. 2013; Starkey et al. 2023) and are listed below:
- Determine diel and seasonal water-quality patterns for five core parameters (dissolved oxygen, salinity, temperature, pH, and turbidity) at selected coastal areas near SECN parks using fixed-station continuous data loggers.
- Determine monthly and seasonal patterns in nutrients (nitrogen and phosphorus) and chlorophyll a at selected coastal areas near SECN parks by collecting discrete water samples.
- Determine status and spatial variability of water and nutrient conditions in estuarine waters every five years near SECN parks.
- Determine status and spatial variability of benthic sediment quality (organic contaminants, carbon, and metal levels) every 10 years in estuarine waters near SECN parks.
This report summarizes water-quality monitoring data collected during a parkwide assessment to address objective 3 at Cumberland Island National Seashore. Data were gathered from July 6 to July 8, 2022. The purpose of this document is to report the most recently collected data from the seashore as part of an ongoing long-term water-quality monitoring program. This report was designed to provide water-quality monitoring data to managers as a concise summary in the context of applicable federal standards developed by the EPA. Previous synoptic assessments of water-quality conditions at Cumberland Island National Seashore were conducted in July 2007, August 2012, and August 2017 as part of I&M monitoring efforts (Gregory et al. 2010; Wright et al. 2013; Starkey et al. 2024).
Study Area
Cumberland Island National Seashore
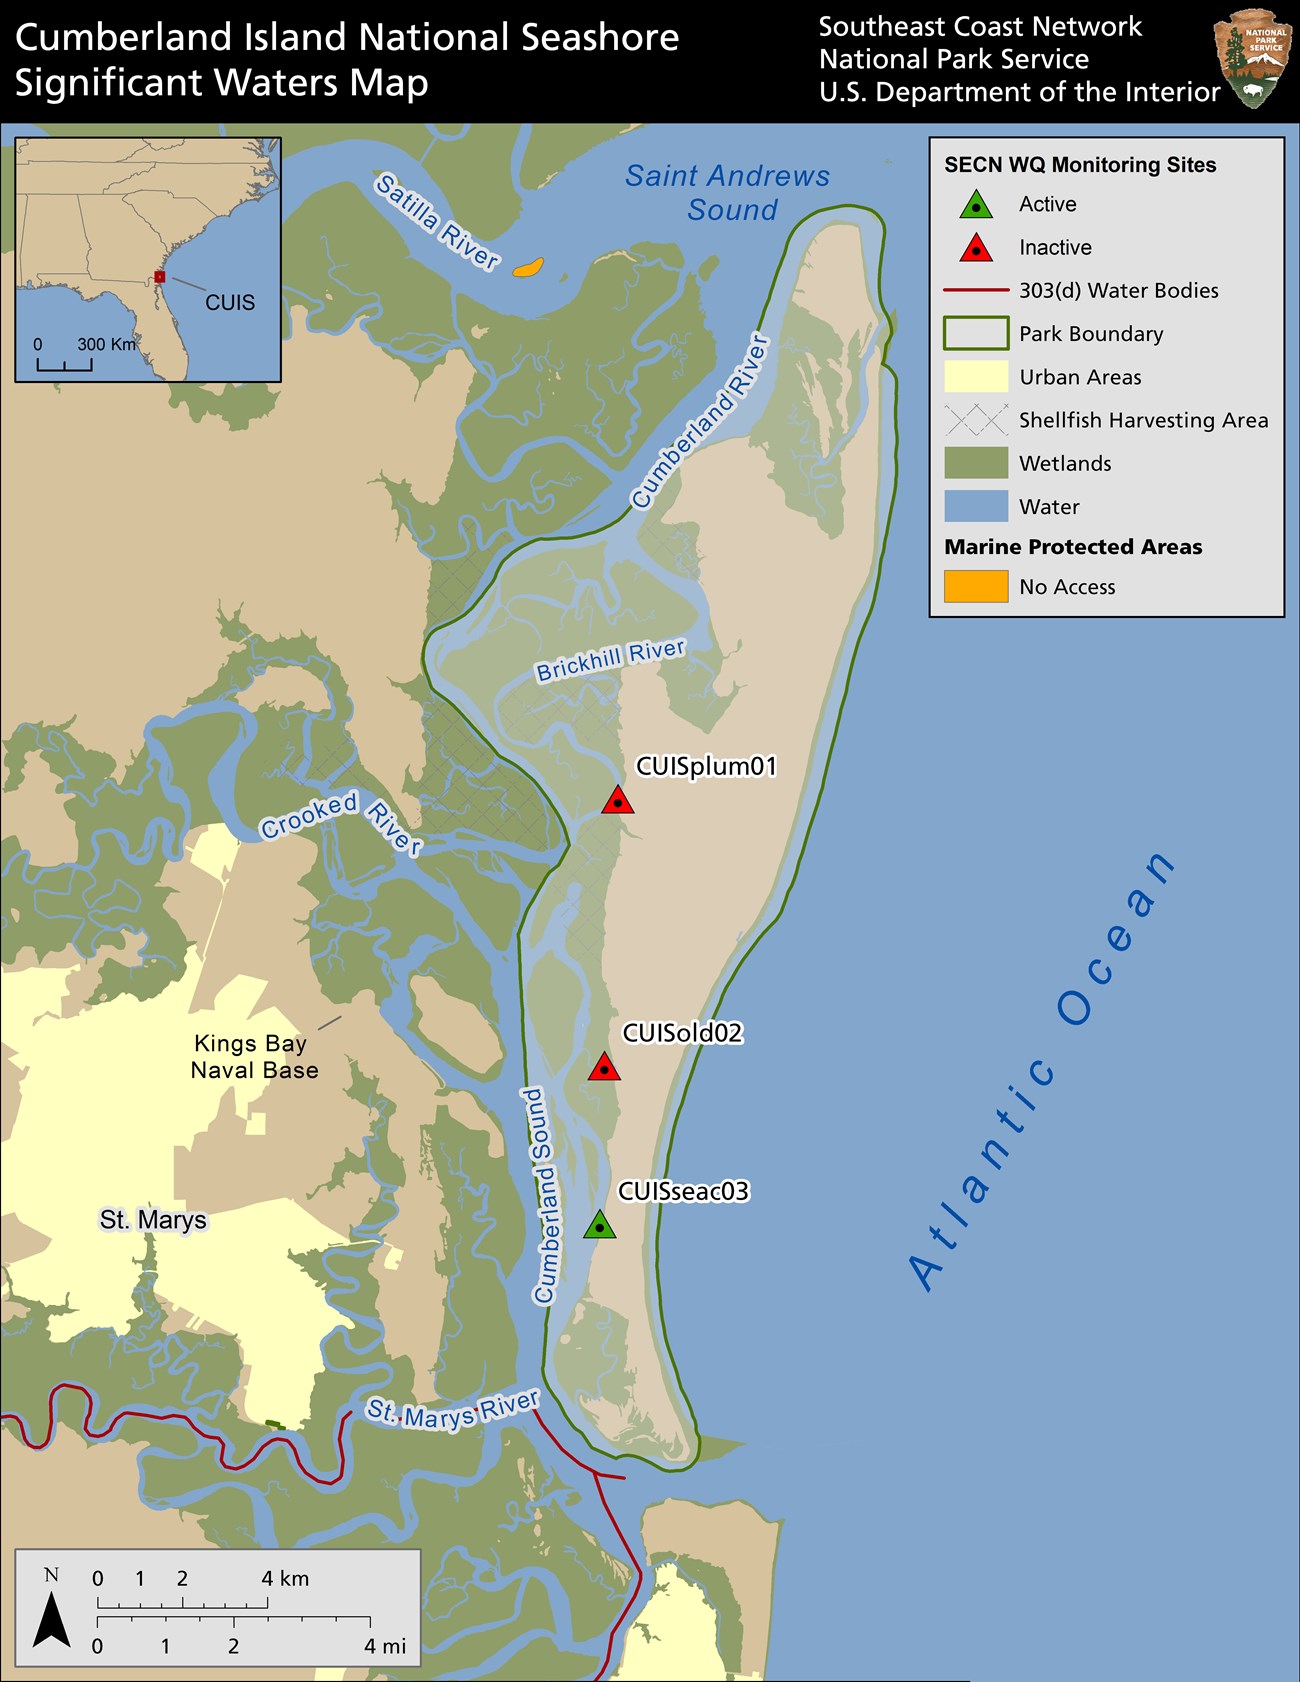
Cumberland Island National Seashore is located off the coast of Georgia between St. Andrews Sound and the mouth of the St. Marys River. At 17.5 miles (28.2 kilometers) long, the seashore is one of the largest and most diverse barrier islands on the Atlantic Coast (Figure 1). Almost half of its 36,415 acres (14,737 hectares) are Spartina-dominated salt marsh habitat. These areas include mud flats and six tidal creeks which provide the habitat for a diverse marine-based fauna. The island is known for nesting loggerhead sea turtles, abundant shore birds, undeveloped dune fields, maritime forest ecosystems, and historic structures. Cumberland Island provides habitat for 18 federally listed threatened or endangered species (Alber et al. 2005) although most are terrestrial or bird species, several species of sea turtles are commonly observed along the beaches and West Indian Manatees are occasionally seen in estuarine areas.
Cumberland Island National Seashore was established in 1972 to preserve the scenic, scientific, and historical values of the island as well as to provide public outdoor recreational uses to its visitors. Specified areas of Cumberland Island are also part of the South Atlantic-Carolinian Biosphere Reserve and are permanently protected in a primitive state. The northern half of the island has also been designated a wilderness area. This unspoiled environment, once prevalent on all the barrier islands, provides a unique opportunity to experience the flora and fauna of a natural coastal ecosystem.
Water-quality conditions in Cumberland Sound and the Cumberland River are influenced by freshwater inflows mainly from the St. Marys River to the south, the Crooked River near the middle portion of the island and the Satilla River on its northern boundary. St. Marys, Georgia, like other coastal communities, faces increased residential development pressure. The cities of Jekyll Island, Georgia and Brunswick, Georgia located just north of Cumberland Island (as well as Fernandina Beach, Florida located just to the south) have potential to affect water-quality conditions due to the large amount of wood pulp processing, manufacturing, and shipping activities that occur. Jekyll Island, Georgia, just across St. Andrews Sound from Cumberland Island’s northern boundary, is a relatively small resort community but has a permitted wastewater discharge on its southern end.
Other activities such as dredging along the estuarine waters just south and east of the island to maintain the submarine access channel to Kings Bay Submarine Base—have the potential to cause episodic deterioration of the water-quality as well as the scenic attributes of the south end of Cumberland Island. Transportation corridors such as rail, interstate highways, and the intracoastal waterway are also potential sources of pollution, particularly catastrophic spills. The Georgia coast has been experiencing an era of fast growth in new residential communities, many of which have sought to incorporate marinas. Recreational pressure could increase on the island, and the threat to resources and critical habitats may also intensify. Erosion on the western side of the island has been a recent concern of resource management at CUIS and investigated by local researchers (Jackson 2006; 2010; 2015), USGS (Calhoun and Riley 2016), and the Southeast Coast Network (Bateman-McDonald 2020). The only aquatic areas in the vicinity of the park to be 303(d) listed are the Amelia River just south of Cumberland Island, the St. Mary’s River, and parts of Cumberland Sound along the island’s southern tip for elevated mercury levels in fish (Figure 1).
Methods
The water-quality assessment was conducted in estuarine waters in the vicinity of the Cumberland Island National Seashore, following the methods developed by the Environmental Protection Agency (EPA) National Coastal Assessment Program (EPA 2010). Descriptions of the water-quality parameters and the assessment criteria are from the EPA National Coastal Assessment IV Report (EPA 2012). Methods used for these assessments were adapted and integrated into protocols tailored specifically to parks in the Southeast Coast Network (Starkey et al. 2023). Site selection and sampling methodology are briefly outlined in the following sections.
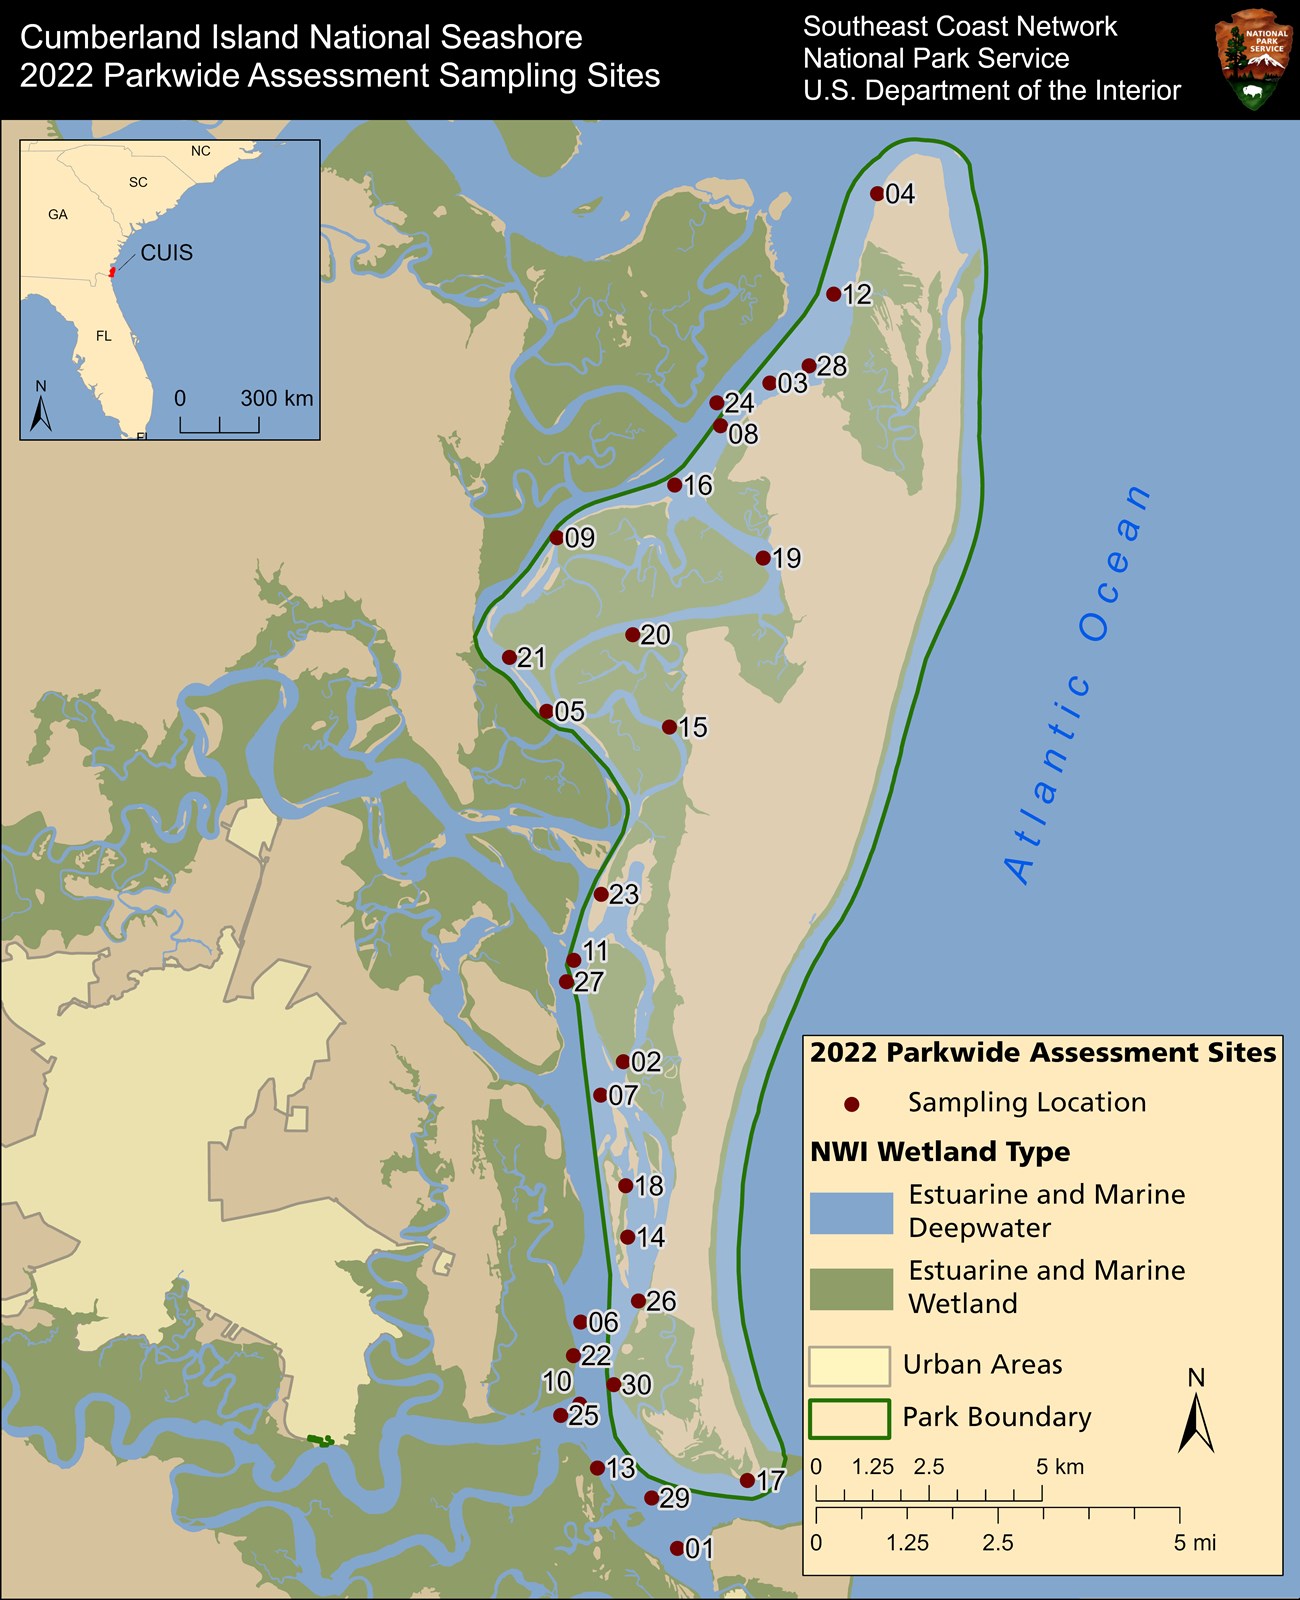
In 2022, thirty sites in estuarine waters near the seashore were randomly selected for monitoring following methods developed by the EPA (Table 1, Figure 2, Stevens 1997; Stevens and Olsen 1999; Stevens and Olsen 2004). This method of randomly selecting spatially-balanced sites provides managers with a statistically valid estimate of the overall conditions of the assessed resource within or around the park.
Table 1. Site name (which includes site number 01, 02, ...etc), waterbody name and location, depth, coordinates, and chemical and physical attributes of sampling sites at Cumberland Island National Seashore, July 6–8, 2022. The table references site names used to present data in this report (Figure 2). All coordinates are in NAD83 Datum, in UTM zone 17. Salinity, pH, and water temperature measured at a depth of 0.5 meters (1.6 feet) unless water depth was too shallow in which case it was measured at 0.1 meters (0.3 feet). [SAV—sub-aquatic vegetation; m—meters; °C—degrees Celsius; PSU—practical salinity units].
| Site Name | Water Body | UTMX | UTMY | SAV | Debris | Site Depth (m) |
Water Temp (C) |
pH | Salinity (PSU) |
|---|---|---|---|---|---|---|---|---|---|
| CUIS01_2022 | Cumberland Sound | 455206 | 3396427 | No | No | 7.0 | 30.31 | 7.89 | 34.79 |
| CUIS02_2022 | Cumberland Sound | 454006 | 3407198 | No | No | 3.5 | 29.93 | 7.56 | 33.43 |
| CUIS03_2022 | Cumberland River | 457251 | 3422216 | No | No | 7.6 | 30.89 | 7.98 | 34.49 |
| CUIS04_2022 | St. Andrews Sound | 459634 | 3426409 | No | No | 5.8 | 30.25 | 8.00 | 34.69 |
| CUIS05_2022 | Cumberland River | 452314 | 3414953 | No | No | 3.1 | 30.33 | 7.54 | 33.38 |
| CUIS06_2022 | Cumberland Sound | 453064 | 3401435 | No | No | 2.0 | 30.47 | 7.87 | 34.31 |
| CUIS07_2022 | Cumberland Sound | 453505 | 3406457 | No | No | 2.5 | 30.38 | 7.66 | 33.05 |
| CUIS08_2022 | Cumberland River | 456159 | 3421272 | No | No | 9.1 | 30.30 | 7.71 | 33.58 |
| CUIS09_2022 | Cumberland River | 452539 | 3418795 | No | No | 2.5 | 30.29 | 7.63 | 33.25 |
| CUIS10_2022 | Cumberland Sound | 453041 | 3399619 | No | No | 4.4 | 30.49 | 7.81 | 33.75 |
| CUIS11_2022 | Cumberland Sound | 452912 | 3409442 | No | No | 2.6 | 30.26 | 7.64 | 32.94 |
| CUIS12_2022 | Cumberland River | 458661 | 3424182 | No | No | 7.7 | 30.44 | 7.99 | 34.42 |
| CUIS13_2022 | Cumberland Sound | 453434 | 3398205 | No | No | 1.4 | 30.49 | 7.84 | 34.08 |
| CUIS14_2022 | Cumberland Sound | 454103 | 3403315 | No | No | 1.0 | 30.27 | 7.76 | 33.62 |
| CUIS15_2022 | Brickhill River | 455029 | 3414603 | No | No | 5.2 | 31.82 | 7.62 | 33.19 |
| CUIS16_2022 | Cumberland River | 455142 | 3419958 | No | No | 5.8 | 30.35 | 7.70 | 33.39 |
| CUIS17_2022 | Cumberland Sound | 456751 | 3397929 | No | No | 5.5 | 29.99 | 7.93 | 34.93 |
| CUIS18_2022 | Cumberland Sound | 454059 | 3404453 | No | No | 2.6 | 30.30 | 7.75 | 33.59 |
| CUIS19_2022 | Brickhill River | 457103 | 3418343 | No | No | 3.8 | 30.50 | 7.82 | 33.97 |
| CUIS20_2022 | Mumford Creek | 454216 | 3416648 | No | No | 3.8 | 31.23 | 7.65 | 33.32 |
| CUIS21_2022 | Cumberland River | 451487 | 3416144 | No | No | 4.8 | 30.53 | 7.61 | 33.36 |
| CUIS22_2022 | Cumberland Sound | 452902 | 3400695 | No | No | 0.8 | 30.65 | 7.85 | 33.98 |
| CUIS23_2022 | Cumberland River | 453518 | 3410904 | No | No | 0.6 | 30.33 | 7.59 | 32.77 |
| CUIS24_2022 | Cumberland River | 456078 | 3421778 | No | No | 6.5 | 30.82 | 7.99 | 34.46 |
| CUIS25_2022 | Cumberland Sound | 452621 | 3399371 | No | No | 3.4 | 30.50 | 7.78 | 32.81 |
| CUIS26_2022 | Cumberland Sound | 454343 | 3401904 | No | No | 8.4 | 30.53 | 7.84 | 34.18 |
| CUIS27_2022 | Cumberland Sound | 452749 | 3408967 | No | No | 3.3 | 30.46 | 7.66 | 32.89 |
| CUIS28_2022 | Cumberland River | 458120 | 3422597 | No | No | 2.0 | 30.73 | 7.96 | 34.47 |
| CUIS29_2022 | Cumberland Sound | 454633 | 3397544 | No | No | 5.7 | 30.37 | 7.86 | 34.14 |
| CUIS30_2022 | Cumberland Sound | 453796 | 3400052 | No | No | 2.7 | 30.72 | 7.83 | 33.49 |
Water-Quality Data Collection
The water-quality assessment conducted during this sampling period incorporated hydrographic profiles at 0.5–1.0 meter (1.6–3.3 feet) intervals at each site, to measure temperature, pH, dissolved oxygen, and salinity. Chlorophyll a and total dissolved nutrient samples were collected from 0.5 meters (1.6 feet) below the surface. Chlorophyll a samples were processed using known volumes of water samples that were filtered onto glass-fiber filters then refrigerated and submitted for laboratory analysis.
Water clarity was estimated at each site using a Secchi disk to determine light extinction depths, which were converted to light attenuation coefficients (k) using the equation: K = c / Secchi depth (in meters) where “c” is a constant that corresponds to the water body’s naturally occurring clarity conditions ( i.e., c = 1.0 for naturally turbid conditions, c = 1.4 for normal turbidity conditions, or c = 1.7 for waters supporting submerged aquatic vegetation (SAV) restoration [Smith et al. 2006; EPA 2016]). Cumberland Island National Seashore uses a coefficient of 1.0 because the area is “naturally turbidity” (EPA 2016). This method of estimating water-clarity condition is generally used when information on light transmission in the water column is missing. The Southeast Coast Network is reporting derived values to maintain data consistency across network parks. Water clarity was not assessed at sites with excessive current or depths too shallow to ascertain an accurate Secchi measurement. When sites were too shallow to access by boat, or when they were located in heavily trafficked channels where safety was a concern, alternate sites were used.
Water-Quality Assessment Criteria
The categorical assessments (e.g., good, fair, poor) use measurements of chlorophyll a, nutrient concentrations, bottom dissolved oxygen, and water clarity (Table 2) and are intended to characterize acutely degraded water-quality conditions at a site. The assessments do not consistently identify sites that experience occasional or infrequent hypoxia, nutrient enrichment, or decreased water clarity. Therefore, a rating of poor for the water-quality index means the site likely exhibited consistently poor conditions before or after the assessment period. If a site is designated fair or good, the site did not experience poor conditions on the date of sampling; however, the site could be characterized by poor conditions for short time periods.
Site assessments were also made using an index that combines the ratings for each parameter into a site-specific water-quality index rating. This index allows for general comparisons between sites in a park (Table 3) and can be used to summarize overall conditions in the waters around a park. This rating also allows general comparisons between parks and at the same park over time based on the percentage of sites that fall within the good, fair, or poor categories.
Table 2. Water-quality monitoring condition criteria for water-quality parameters collected by the Southeast Coast Network based on thresholds set by EPA (2012) [μg/L—micrograms per liter; mg/L—milligrams per liter].
| Rating | Water Clarity (k)1 | Chlorophyll a (µg/L) | Dissolved Inorganic Nitrogen (DIN) (mg/L) | Dissolved Inorganic Phosphorus (DIP) (mg/L) | Dissolved Oxygen (mg/L) |
|---|---|---|---|---|---|
| Good | < 2.3 | < 5 | < 0.1 | < 0.01 | >5 |
| Fair | 2.30–2.99 | 5–20 | 0.1–0.5 | 0.01–0.05 | 2–5 |
| Poor | > 2.99 | > 20 | > 0.5 | > 0.05 | <2 |
Table 3. Condition criteria used for water-quality assessment summaries at individual sampling sites and parks.
| Rating | Site Water-Quality Index Rating1 | Park Water-Quality Index Rating |
| Good | A maximum of one indicator is rated fair, and no indicators are rated poor. | Less than 10% of sites are in poor condition, and more than 50% of sites are in good condition. |
| Fair | One indicator is rated poor, or two or more indicators are rated fair. | 10% to 20% of sites are in poor condition, or 50% or less of sites are in good condition. |
| Poor | Two or more of the five indicators are rated poor. | More than 20% of sites are in poor condition. |
| Missing | Two components of the indicator are missing and the available indicators do not suggest a fair or poor rating. | NA |
Results
Parameter-Based Water Condition Assessments
Figures 3–7 illustrate the spatial distribution of sampling sites and the corresponding ratings for water clarity, chlorophyll a, dissolved inorganic nitrogen (DIN), dissolved inorganic phosphorus (DIP), and bottom-reading dissolved oxygen (DO) based on each parameter’s corresponding condition category. Inset graphs on Figures 3–7 show the proportion of sites in the assessed area that were placed in each rating category. The map and graph in Figure 8 summarize Cumberland Island National Seashore’s water-quality conditions during the assessment. Site-specific water-quality data for each parameter are also presented in Table 4. For comparison with past assessments, maps and condition rating summary graphs for sample years 2007–2022 can be found in the supplementary materials.
- Water clarity was rated good at all thirty sites (100%).
- Chlorophyll a concentrations were rated fair at all thirty sites (100%).
- Dissolved inorganic nitrogen concentration was good at all thirty sites (100%).
- Dissolved inorganic phosphorus concentration was good at three sites (10%) and fair at twenty-seven sites (90%).
- Dissolved oxygen concentration (bottom) was rated good at twenty-four sites (80%) and fair at six sites (20%).
- A water-quality condition summary index was calculated for each site sampled at Cumberland Island National Seashore based on the categorical assessments of chlorophyll a, DIN and DIP concentrations, dissolved oxygen, and water clarity. This summary index indicated good water-quality conditions at three sites (10%) and fair water quality conditions at twenty-seven sites (90%).
- These findings are consistent with assessments 2007–2022, with the proportion of condition ratings in the good and fair categories remaining relatively consistent (see supplemental materials). The one exception is dissolved oxygen, which has shown improvement in the proportion of sites rated as good. In 2007 and 2012, 20% and 33% of sites respectively were rated as good, whereas in 2017 and 2022, 70% and 77% of sites were rated as good. Graphs of each parameters condition rating throughout the period of record are provided in the supplemental materials.
- The distribution of good, fair, and poor ratings for each parameter across the period of record can be seen using the maps provided in the supplemental materials.
- Based on the summary water-quality index rating, overall water-quality conditions at Cumberland Island National Seashore during 2022 sampling were fair. Previous assessments indicated overall park water-quality ratings of fair in 2007, 2012, and 2017. This suggests relatively stable overall water-quality throughout the period of record.
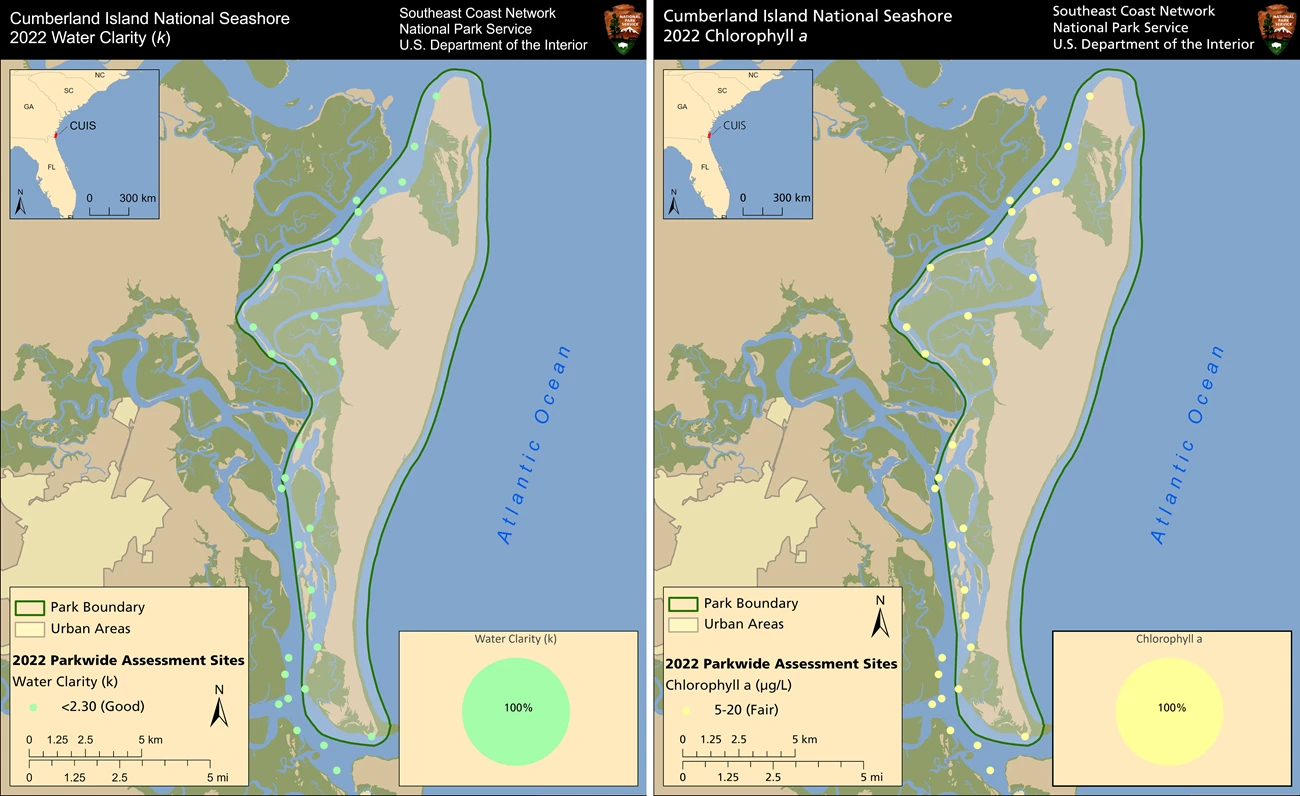
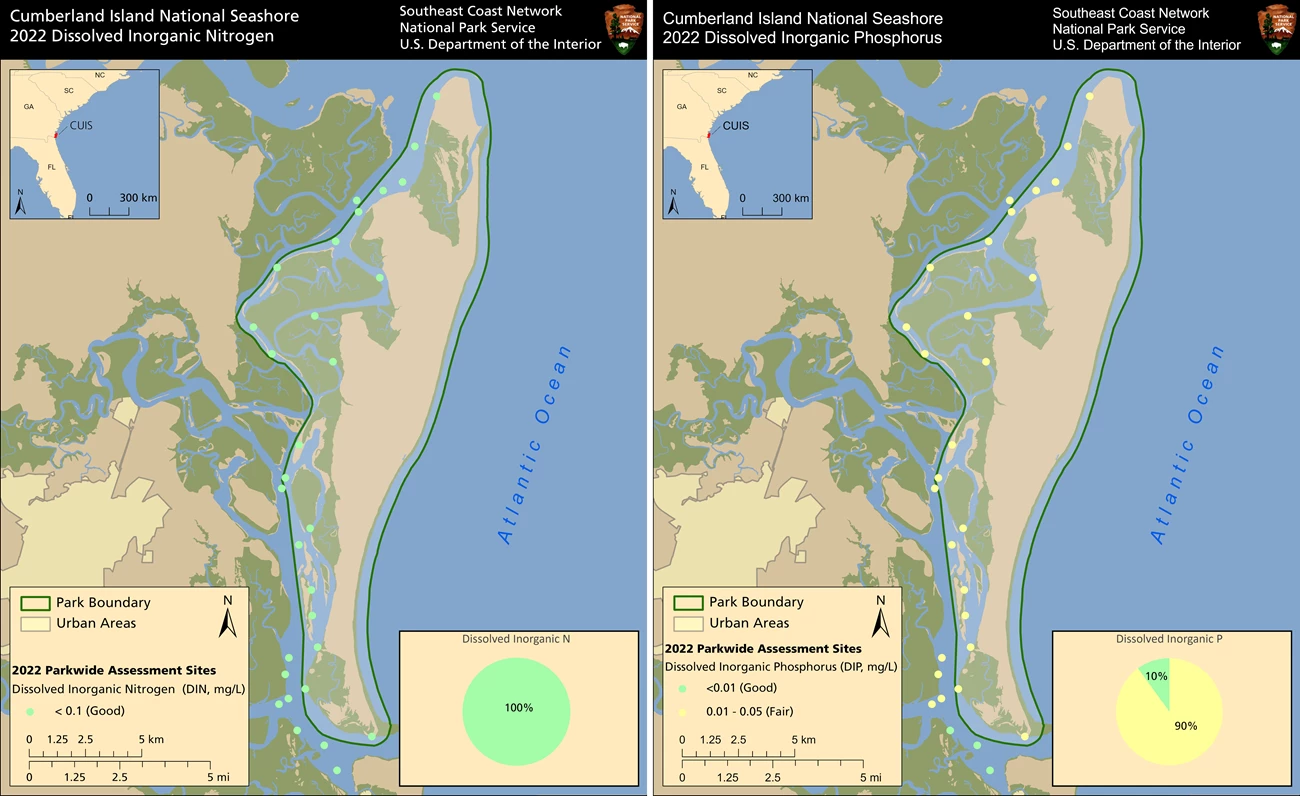

Table 4. Water-quality parameter values and assessment conditions for sampling sites in the vicinity of Cumberland Island National Seashore July 6–8, 2022. Water clarity was assessed using light attenuation values (k) using a constant (1.0) for estuarine waters that are “naturally turbidity” (Smith et al. 2006) and assessment categories that correspond to EPA (2012). Condition of other assessed parameters based on EPA (2012) [Green D —good; yellow E —fair; red F —poor; *result was less than or equal to the Method Detection Limit [MDL reported]; kd— light attenuation coefficient; μg/L—micrograms per liter; N—Nitrogen; mg/L—milligrams per liter; P— Phosphorous; "–" — data not collected]. Dissolved oxygen concentrations are taken near the bottom (deepest reading).
| Site | Water Clarity (kd) | Chlorophyll a (μg/L) | Dissolved Oxygen (DO,mg/L) | Dissolved Inorganic Nitrogen (DIN,mg/L) |
Dissolved Inorganic Phosphorus (DIP,mg/L) |
Total Dissolved Nitrogen (mg/L) |
Total Dissolved Phosphorus (mg/L) |
Site WQ Index Rating |
|---|---|---|---|---|---|---|---|---|
| CUIS01_2022 | 0.9D | 8.06E | 5.6D | 0.0221D | 0.0085D | 0.25 | 0.027 | GoodD |
| CUIS02_2022 | 1.4D | 8.48E | 4.1E | 0.0290D | 0.0251E | 0.34 | 0.050 | FairE |
| CUIS03_2022 | 0.8D | 6.64E | 6.1D | 0.0145D | 0.0272E | 0.24 | 0.047 | FairE |
| CUIS04_2022 | 0.7D | 5.48E | 6.0D | 0.0132D | 0.0295E | 0.26 | 0.056 | FairE |
| CUIS05_2022 | 1.7D | 7.41E | 4.7E | 0.0257D | 0.0224E | 0.41 | 0.047 | FairE |
| CUIS06_2022 | 0.9D | 8.77E | 5.7D | 0.0175D | 0.0109E | 0.30 | 0.030 | FairE |
| CUIS07_2022 | 1.1D | 6.97E | 5.1D | 0.0257D | 0.0193E | 0.33 | 0.043 | FairE |
| CUIS08_2022 | 0.7D | 7.73E | 4.8E | 0.0593D | 0.0351E | 0.39 | 0.068 | FairE |
| CUIS09_2022 | 1.0D | 8.48E | 5.1D | 0.0453D | 0.0315E | 0.34 | 0.051 | FairE |
| CUIS10_2022 | 0.8D | 8.45E | 5.4D | 0.0206D | 0.0120E | 0.30 | 0.032 | FairE |
| CUIS11_2022 | 1.3D | 6.45E | 5.0E | 0.0270D | 0.0201E | 0.34 | 0.043 | FairE |
| CUIS12_2022 | 0.6D | 6.53E | 5.8D | 0.0137D | 0.0270E | 0.26 | 0.049 | FairE |
| CUIS13_2022 | 0.9D | 8.23E | 5.8D | 0.0154D | 0.0097D | 0.27 | 0.027 | GoodD |
| CUIS14_2022 | 1.0D | 7.74E | 5.7D | 0.0182D | 0.0158E | 0.30 | 0.037 | FairE |
| CUIS15_2022 | 1.1D | 10.95E | 4.9E | 0.0361D | 0.0279E | 0.34 | 0.051 | FairE |
| CUIS16_2022 | 0.7D | 8.74E | 5.1D | 0.0479D | 0.0339E | 0.38 | 0.062 | FairE |
| CUIS17_2022 | 1.3D | 10.24E | 5.6D | 0.0152D | 0.0115E | 0.25 | 0.032 | FairE |
| CUIS18_2022 | 0.9D | 8.03E | 5.3D | 0.0230D | 0.0191E | 0.33 | 0.044 | FairE |
| CUIS19_2022 | 0.9D | 11.11E | 5.5D | 0.0431D | 0.0335E | 0.29 | 0.053 | FairE |
| CUIS20_2022 | 1.1D | 11.22E | 5.2D | 0.0471D | 0.0335E | 0.33 | 0.055 | FairE |
| CUIS21_2022 | 1.7D | 10.00E | 5.0E | 0.0182D | 0.0202E | 0.33 | 0.042 | FairE |
| CUIS22_2022 | 1.3D | 10.32E | 5.8D | 0.0181D | 0.0106E | 0.26 | 0.029 | FairE |
| CUIS23_2022 | 1.4D | 10.59E | 4.6E | 0.0426D | 0.0282E | 0.35 | 0.054 | FairE |
| CUIS24_2022 | 0.8D | 6.61E | 5.8D | 0.0131D | 0.0262E | 0.22 | 0.045 | FairE |
| CUIS25_2022 | 0.8D | 8.89E | 5.5D | 0.0313D | 0.0116E | 0.32 | 0.029 | FairE |
| CUIS26_2022 | 0.8D | 9.54E | 5.6D | 0.0182D | 0.0143E | 0.29 | 0.038 | FairE |
| CUIS27_2022 | 1.0D | 7.17E | 5.1D | 0.0277D | 0.0159E | 0.33 | 0.036 | FairE |
| CUIS28_2022 | 1.1D | 9.08E | 6.3D | 0.0166D | 0.0299E | 0.23 | 0.054 | FairE |
| CUIS29_2022 | 0.8D | 7.36E | 5.3D | 0.0170D | 0.0097D | 0.25 | 0.025 | GoodD |
| CUIS30_2022 | 1.1D | 9.46E | 5.7D | 0.0159D | 0.0107E | 0.27 | 0.028 | FairE |
DeVivo, J. C., C. J. Wright, M. Byrne, E. M. DiDonato, and T. Curtis. 2008. Vital signs monitoring in the Southeast Coast Inventory and Monitoring Network. NPS/SECN/NRR—2008/061, National Park Service, Fort Collins, Colorado. Available at: https:// irma.nps.gov/DataStore/DownloadFile/153409 (last accessed June 2024).
Gregory, M. B, J. C. DeVivo, P. H. Flournoy, and K. A. Smith. 2010. Assessment of estuarine water quality at Cumberland Island National Seashore, 2007. Natural Resource Data Series NPS/SECN/NRDS—2010/121. National Park Service, Fort Collins, Colorado. Available at: DataStore - Assessment of estuarine water quality at Cumberland Island National Seashore, 2007 (nps.gov) (last accessed June 2024).
Gregory, M. B., J. C. DeVivo, E. M. DiDonato, C. J. Wright, and E. Thompson. 2013. Protocol for monitoring estuarine water and sediment quality in selected Southeast Coast Network parks. NPS/SECN/NRR—2013/644, National Park Service, Fort Collins, Colorado. Available at: DataStore - Protocol for monitoring estuarine water and sediment quality in selected Southeast Coast Network parks (nps.gov) (last accessed June 2024).
Jackson, C.W., Jr., 2006. Historical back-barrier shoreline change along Cumberland Island, GA 1857–2002: Prepared for Geoscientist in the Park Program for Cumberland Island National Seashore, 85 p
Jackson, C.W., Jr., 2010. Spatio temporal analysis of barrier island shoreline change—The Georgia coast, USA: Ph.D. Dissertation, University of Georgia, 282 p.
Jackson, C.W., Jr., 2015. Mapping shoreline erosion and vulnerability along the Georgia coast—1800s to 2000s: Technical report submitted to Georgia Department of Natural Resources, Coastal Resources Division, 23 p
Smith, L. M., V. D. Engle, and J. K. Summers. 2006. Assessing water clarity as a component of water quality in Gulf of Mexico estuaries. Environmental Monitoring & Assessment 115:291–305.
Starkey, E. N., M. B. Gregory, W. K. Wright, J. C. DeVivo, E. M. DiDonato, C. J. Wright, and E. Thompson. 2023. Protocol for monitoring estuarine water and sediment quality in selected Southeast Coast Network parks: Protocol narrative—version 2.0. Natural Resource Report NPS/SECN/NRR—2023/2528. National Park Service, Fort Collins, Colorado. Available at: https://doi.org/10.36967/2299077 (last accessed June 2024).
Starkey, E. N., W. Wright, and S. Cooper. 2024. Assessment of estuarine water and sediment quality at Cumberland Island National Seashore: 2017 data summary—Version 1.1. Science Report NPS/SR—2024/143. National Park Service, Fort Collins, Colorado. Available at: https://irma.nps.gov/DataStore/Reference/Profile/2304403 (last accessed June 2024).
Stevens, D., and A. R. Olsen. 2004. Spatially balanced sampling of natural resources. Journal of the American Statistical Association 99:16.
Stevens, D. L., Jr. 1997. Variable density grid-based samplings designs for continuous spatial populations. Environmetrics 8:167–195.
Stevens, L., and A. R. Olsen. 1999. Spatially restricted surveys over time for aquatic resources. Journal of Agricultural, Biological, and Environmental Statistics:415.
United States Census Bureau (USCB). 2023. Census 2000 Gateway website. Available at: Decennial Census of Population and Housing by Decades (last accessed June 2024).
United States Environmental Protection Agency (EPA). 2014. National Coastal Condition Assessment: Field operation manual. EPA-841-R-09-003, Washington D.C.
United States Environmental Protection Agency (EPA). 2016. National Coastal Condition Assessment (NCCA) 2010 Technical Report. Washington, D.C.
United States Environmental Protection Agency (EPA). 2012. National Coastal Condition Report IV. EPA-842-R-10-003, Washington D.C. 20460.
United States Environmental Protection Agency (EPA). 2022. 303(d) listed water bodies (GIS Coverage) US EPA Office of Water. Available at: How's My Waterway - Community (epa.gov) (last accessed July 2024).
U.S. Fish and Wildlife Service (USFWS). 2024. National Wetlands Inventory website. Available at: http://www.fws.gov/wetlands/ (last accessed June 2024).
Wright, W., M. B. Gregory, and J. Asper. 2013. Assessment of estuarine water quality at Cumberland Island National Seashore, 2012. Natural Resource Data Series NPS/SECN/NRDS—2013/454. National Park Service, Fort Collins, Colorado. Available at: DataStore - Assessment of estuarine water quality at Cumberland Island National Seashore, 2012 (nps.gov) (last accessed June 2024).
Supplemental Materials
The Supplemental Materials to accompany this summary report include maps and graphs and are available on NPS IRMA
Data Package
The data package contains data and associated metadata used in the preparation of this report.
Other Reports in this Series:
- Assessment of Estuarine Water Quality at Cumberland Island National Seashore, 2007. Available at: DataStore - Assessment of estuarine water quality at Cumberland Island National Seashore, 2007 (nps.gov)
- Assessment of Estuarine Water Quality at Cumberland Island National Seashore, 2012. Available at: DataStore - Assessment of estuarine water quality at Cumberland Island National Seashore, 2012 (nps.gov)
- Assessment of Estuarine Water and Sediment Quality at Cumberland Island National Seashore 2017 Data Summary Version 1.1. Available at: DataStore - Assessment of estuarine water and sediment quality at Cumberland Island National Seashore: 2017 data summary—version 1.1 (nps.gov)
