Last updated: October 29, 2021
Article
Water Quality Monitoring, 2020 Annual Update

Water quality is an important and sensitive indicator of aquatic and terrestrial ecosystem health. Monitoring river and stream conditions helps scientists and park managers detect environmental patterns driven by human activity, climate change and watershed dynamics, then use that information to make better-informed decisions. The Southeast Alaska Inventory and Monitoring Network (SEAN) has prioritized continuous water quality monitoring in Glacier Bay National Park and Preserve, Sitka National Historical Park, and Klondike Gold Rush National Historical Park since 2010. Data collected thus far suggest good river health with episodic exceedances of Alaska Department of Environmental Conservation (ADEC) water quality standards.
This research program (1) tracks hourly conditions at a single fixed site in each park from early spring to late fall, (2) examines seasonal and interannual variability, and (3) evaluates observations against state standards indicating optimal or hazardous conditions for fishes. Continuously collected data include:
- Water temperature (°C) reflects air temperature patterns and snow or glacial melt.
- Dissolved oxygen concentration (mg/L) quantifies microscopic oxygen bubbles essential to aquatic organisms. Mainly regulated by temperature, oxygen fluctuations can also be caused by enhanced biological respiration or decomposition, and water aeration.
- pH is a unit-less measure of hydrogen ion concentration indicating relative acidity or alkalinity. It affects freshwater species and many biogeochemical processes. The chemistry of local rocks, soils, and rain impact observed pH levels.
- Specific conductance (mS/cm) describes the ability of water to conduct an electrical current. In Southeast Alaska, higher values represent groundwater influence and lower values rain and snow runoff.
- Turbidity (NTU) measures water clarity due to sediment load; increases in turbidity typically signal precipitation events or glacial runoff, thus this metric is tracked at Klondike Gold Rush National Historical Park only.
2020 Southeast Alaska Weather Conditions
With a robust winter snowpack and frequent precipitation, the start of 2020 definitively concluded the past several years’ drought. Rainfall totals throughout Southeast Alaska were well above average from June through August; this summer was the second wettest on record for downtown Juneau (Alaska Climate Center)! Early fall experienced a welcome drier interval; several more intense precipitation events occurred at year’s end. In contrast, temperatures remained close to normal in 2020, with greatest variability from the long-term record in May and November.
Methods
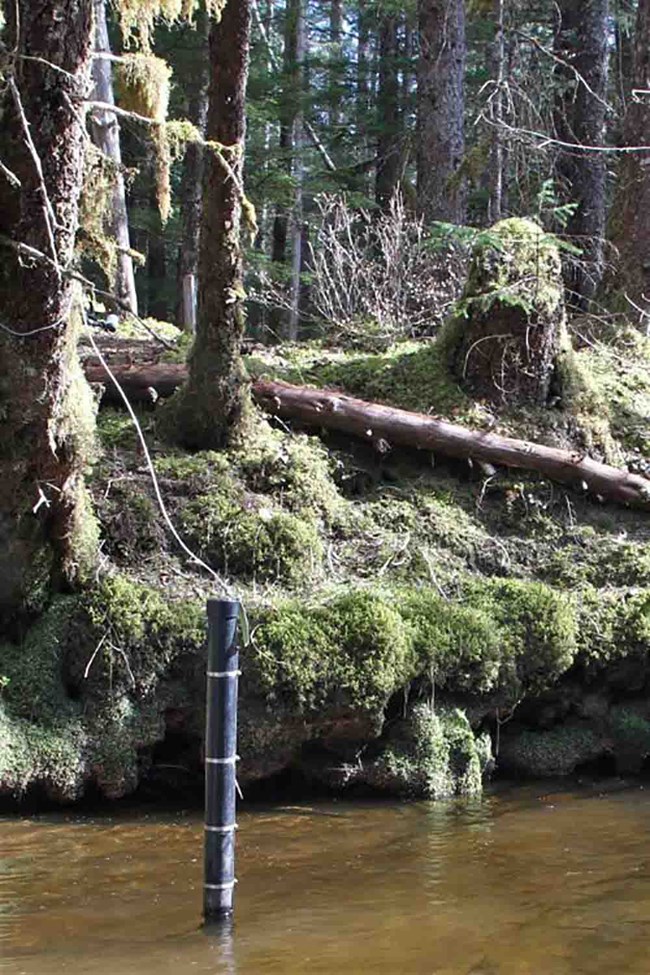
During the ice-free season, water quality sondes sampled each river hourly at fixed locations. Once a month, park staff visited the site to check sensor calibrations, download data, and resolve any problems; this monitoring project would not be possible without their dedication and assistance. In Glacier Bay, sensors were not submerged for a brief interval in early July with minimal data loss. Both Sitka and Klondike experienced pH sensor problems causing one-month record gaps; a Sitka data logging issue also resulted in missing readings in August. SEAN’s certified annual water quality data are publicly available, as is the peer-reviewed protocol guiding this monitoring program.

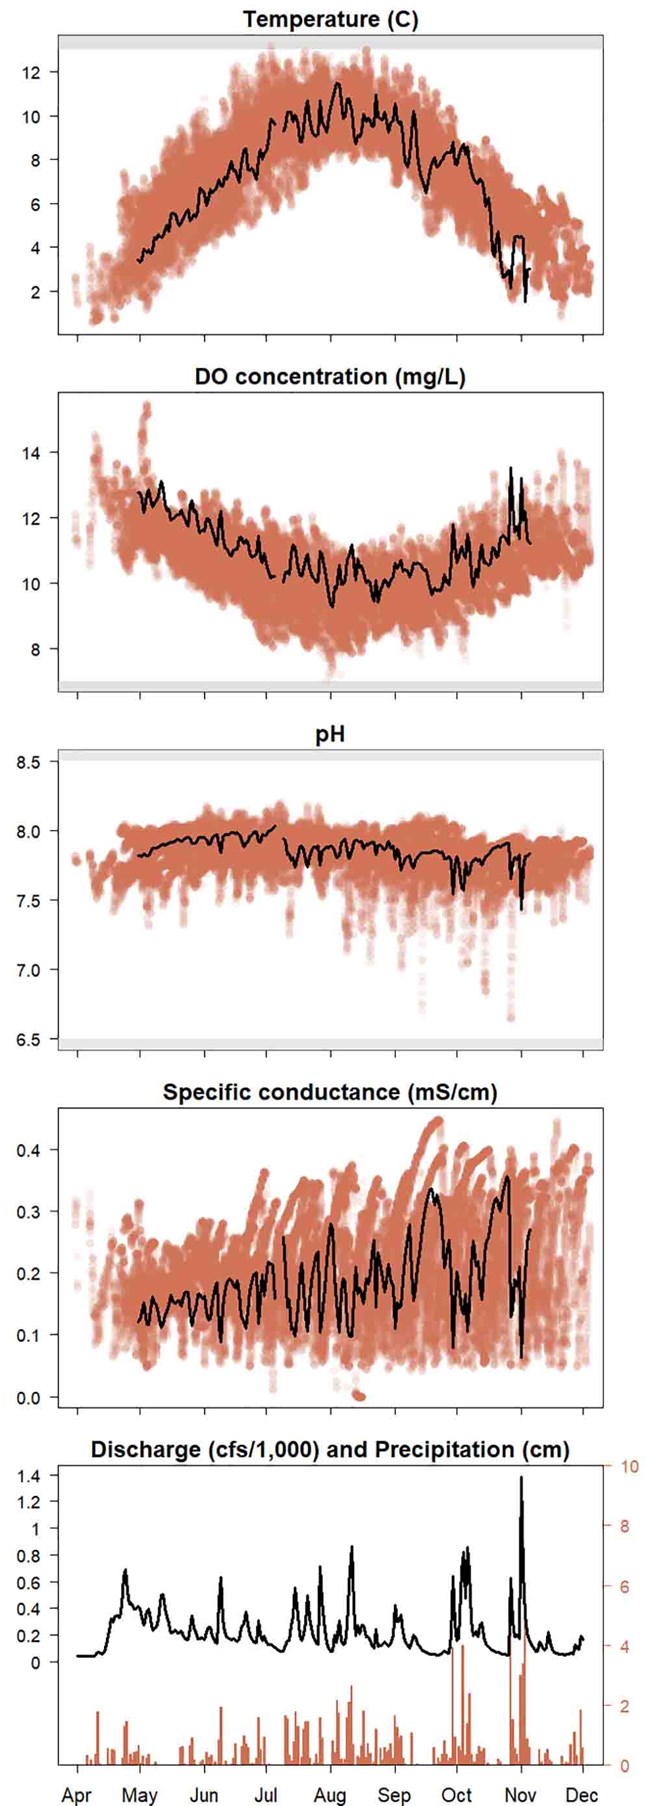
Shaded regions denote ADEC thresholds for unsuitable fish habitat for temperature (above 13°C), dissolved oxygen (below 7 mg/L), and pH (below 6.5 or above 8.5).
Glacier Bay National Park and Preserve
Glacier Bay National Park and Preserve has more than 300 streams flowing over 3,380 km through a diversity of glacially shaped landscapes. The SEAN monitors the Salmon River, whose watershed primarily drains Excursion Ridge to the east and features mature wetlands and forests. This system is strongly groundwater influenced, reflecting greater transport and storage capacity in wetlands and the local aquifer. The sonde is located at river km 9.0, just upstream from the park boundary (map). Since 2014, a U.S. Geological Survey (USGS) streamflow gage has operated about one km downstream from the monitoring site; no significant tributaries exist between the two stations.
The Salmon River is home to many productive anadromous fish populations, such as pink, chum, and coho salmon, steelhead, cutthroat trout, and Dolly Varden. Although their life histories vary, especially with respect to spawning location and amount of time spent in the stream, all are vulnerable to environmental shifts due to climate processes. Tracking temporal changes in water temperature and flow patterns offers insight to these risks and is an established focus for Glacier Bay National Park and Preserve.
2020 Observations
- Water temperatures, cooler than normal, followed the expected seasonal pattern. Mean temperature 1 May - 31 October was below the 2010-2019 mean by -0.35°C. Peak summer conditions exceeded the 13°C ADEC standard for five hours in early August (maximum temperature 13.16°C).
- Dissolved oxygen varied minimally in 2020, remaining at the upper edge of the long-term record and always suitable for fish habitat (above 7 mg/L).
- pH was stable throughout all months. Minor drops in pH occurred during two fall storms; values were consistently well within ADEC thresholds (above 6.5 and below 8.5).
- Specific conductance fluctuated far less than typical during spring and summer, reflecting frequent precipitation in these months that enhanced surface runoff inputs to the river and stabilized conductance values. Variability through the full historic range resumed in the fall, with episodic rainfall (low specific conductance) alternating with groundwater influence (high conductance).
- Discharge was well above normal during spring and summer, followed by isolated autumn storms. At the Salmon River gaging station, 2020 set record maximum discharge levels in February, April, May, June, and December, plus reached a near-record high for annual mean streamflow.
| Parameter | n | Median | Mean | SD | Min | Max |
|---|---|---|---|---|---|---|
| Temperature (ºC) | 4,425 | 7.81 | 7.47 | 2.34 | 0.54 | 13.16 |
| DO concentration (mg/L) | 4,425 | 10.81 | 10.97 | 0.93 | 9.00 | 14.77 |
| pH | 4,424 | 7.87 | 7.86 | 0.10 | 7.11 | 8.07 |
| Specific conductance (mS/cm) | 4,425 | 0.18 | 0.19 | 0.07 | 0.01 | 0.37 |
| Discharge (NTU) | 4,823 | 183.33 | 229.02 | 176.03 | 49.89 | 1,385.90 |

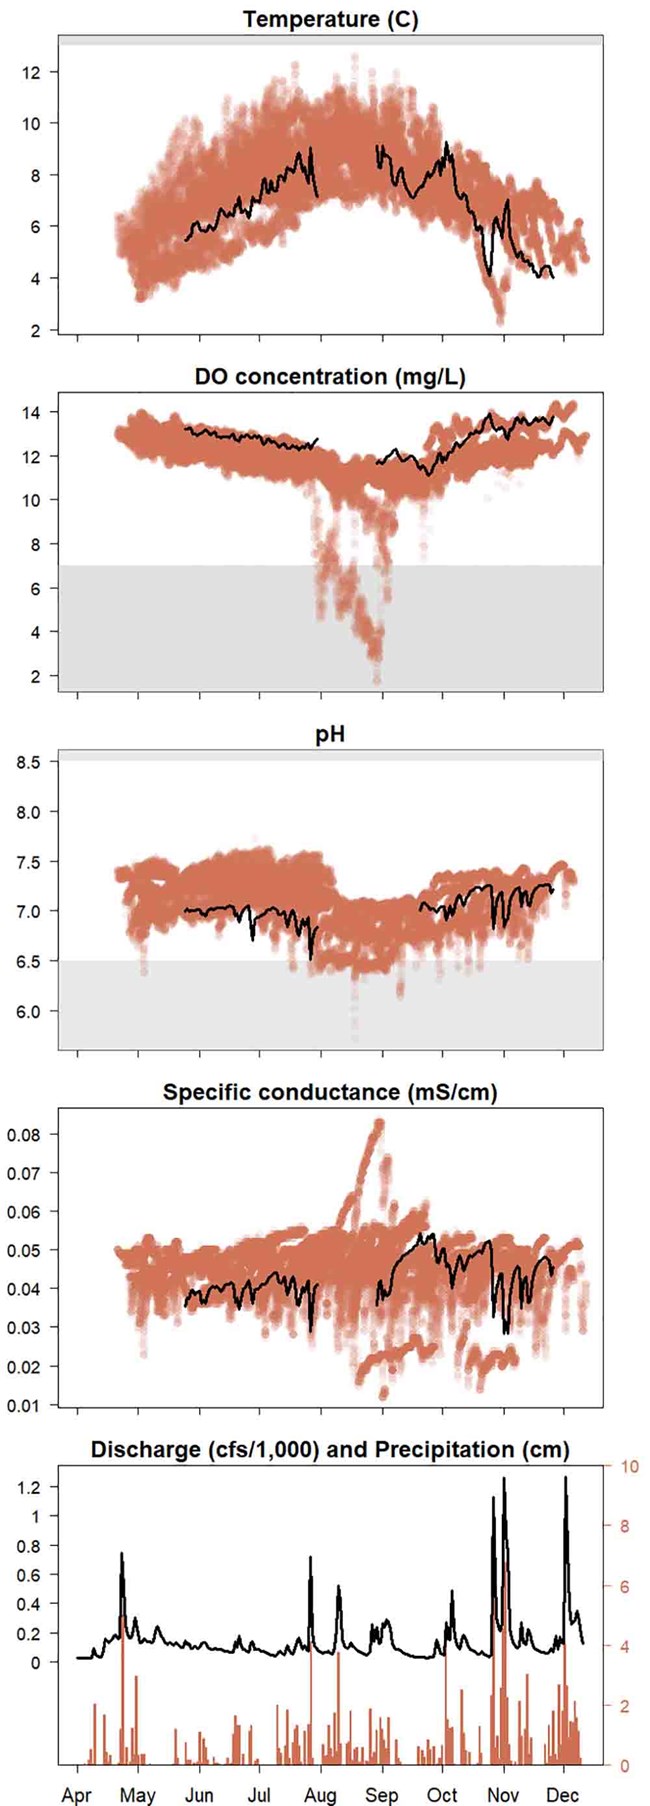
Shaded regions denote ADEC thresholds for unsuitable fish habitat for pH (below 6.5 or above 8.5); Taiya River observations have not approached temperature (above 13°C) or dissolved oxygen (below 7 mg/L) thresholds.
Klondike Gold Rush National Historical Park
The Taiya River, located west of Skagway, is one of two major freshwater systems in Klondike Gold Rush National Historical Park. It drains a large mountainous watershed that was, as of 2010, approximately 29% covered by glaciers presently undergoing retreat. Glacial outburst events have caused large floods in the past and help shape this highly dynamic physical setting. The SEAN’s monitoring station is located near the Taiya River Bridge (map) adjacent to the long-established USGS streamflow gage. The Taiya watershed supports chum, pink, and coho salmon populations, as well as Dolly Varden and eulachon. Fish habitat conditions and turbidity fluctuations are particularly important to park natural resource managers.
2020 Observations
- Water temperature in the glacially influenced Taiya River is less responsive to seasonal changes in air temperature than other sites. In 2020, temperatures were near or below normal throughout the sampling timeframe, including reaching the freezing point in October. Average temperature 1 May - 31 October was below the 2010-2019 mean by -0.06°C.
- Dissolved oxygen levels were above average and stable all months, with minimal fluctuation until a peak in the fall driven by a very cold period.
- pH varied little during 2020, though remained at the low edge of the historic record for the entire sampling season. Observed values were influenced by persistent rainfall with a natural pH (~5.3) less than that of the Taiya River. Readings were always within the ADEC standard (above 6.5 and below 8.5).
- Specific conductance was consistent with previous years in magnitude and seasonal pattern, exhibiting less variability than typical until the fall when streamflow became episodic and influenced by storms more so than meltwater.
- Turbidity remained moderately low over the documented months; it is likely that the late May start date for this site’s 2020 sampling season missed the initial spring sediment flush. No extreme turbidity values were recorded this year, though increases aligned with rainfall-driven discharge pulses.
- Spring discharge was elevated, albeit not record-setting, due to a combination of frequent precipitation and glacial melt. In the second half of the year, river levels were near-normal with the fall decline punctuated by multiple significant storms.
| Parameter | n | Median | Mean | SD | Min | Max |
|---|---|---|---|---|---|---|
| Temperature (ºC) | 3,759 | 5.56 | 5.26 | 1.69 | -0.12 | 9.19 |
| DO concentration (mg/L) | 3,757 | 12.95 | 13.05 | 0.50 | 12.02 | 14.99 |
| pH | 3,503 | 7.21 | 7.21 | 0.17 | 6.86 | 7.55 |
| Specific conductance (mS/cm) | 3,759 | 0.04 | 0.04 | 0.01 | 0.02 | 0.08 |
| Turbidity (NTU) | 3,759 | 39.30 | 45.98 | 35.38 | 4.10 | 345.20 |
| Discharge (cfs) | 3,727 | 2,569.06 | 2,335.43 | 1,255.24 | 255.54 | 5,875.62 |

Shaded regions denote ADEC thresholds for unsuitable fish habitat for temperature (above 13°C), dissolved oxygen (below 7 mg/L), and pH (below 6.5 or above 8.5).
Sitka National Historical Park
The Indian River provides the only significant freshwater and estuarine habitat within Sitka National Historical Park. The 1-km section that flows through the park is a low gradient channel supporting a diversity of anadromous and non-anadromous fish, including four species of salmon, steelhead, Dolly Varden, rainbow trout, three-spine stickleback, and coastrange sculpin. Quality of fish habitat, particularly during low flow and salmon spawning intervals, is a high resource management priority.
Draining a small, steep, and over 50% forested watershed, the Indian River is a mostly surface-water influenced system; discharge closely tracks precipitation events. Moderate development and human activity impact the lowest 2.5 km of the river. The National Park Service and City and Borough of Sitka collaboratively fund the USGS streamflow gage adjacent to the SEAN monitoring site (map), located just upstream of the park boundary.
2020 Observations
- Water temperatures were below normal and less variable than previous years through the entire sampling season and always lower than the 13°C ADEC standard. Values dropped sharply during an October cold spell, moderated and then dropped again into winter. Mean 2020 temperature 1 May - 31 October was below the 10-year average by -0.54°C.
- Dissolved oxygen was consistently higher than the long-term record for the Indian River, well above the ADEC threshold (7 mg/L) for optimal fish habitat all year. Cooler temperatures and abundant precipitation both contributed to observed oxygen conditions.
- pH was lower than typical during the summer and near-average in the fall. Readings exceeded the lower ADEC threshold (pH 6.5) for ten hours in late July (minimum pH 6.16) and for three hours in late October (minimum pH 6.4); unfortunately, a late-summer data gap precludes knowing if low pH levels recurred.
- Specific conductance was stable throughout the year, often near the low edge of the historic record due to 2020’s high rainfall and therefore surface runoff reaching the river.
- Discharge was well above normal during spring and summer, and several extreme storm events occurred in late fall. At the Indian River gaging station, 2020 set record maximum discharge levels in February, April, July, and November, plus reached the site’s highest annual mean streamflow.
| Parameter | n | Median | Mean | SD | Min | Max |
|---|---|---|---|---|---|---|
| Temperature (ºC) | 3,702 | 6.93 | 6.78 | 1.39 | 3.75 | 10.30 |
| DO concentration (mg/L) | 3,700 | 12.77 | 12.69 | 0.65 | 10.82 | 14.06 |
| pH | 3,176 | 7.03 | 7.04 | 0.14 | 6.16 | 7.30 |
| Specific conductance (mS/cm) | 3,702 | 0.04 | 0.04 | 0.01 | 0.02 | 0.06 |
| Discharge (cfs) | 3,716 | 86.10 | 131.67 | 167.97 | 27.30 | 1,260.00 |
