Last updated: September 8, 2024
Article
Preliminary Report on the Acoustic Monitoring of Bats at the Martin Van Buren National Historic Site
Hawthorne Valley Farmscape Ecology Program Monitoring from Feb 22, 2023 – June 15, 2024
by Conrad VispoIntroduction
In a 1840 tally of the fauna found around Kinderhook Academy, “Vespertilio noctivagans” is listed (Woodworth 1839). Surely a bat, possibly a Silver-haired Bat (Lasionycteris noctivagans), although that identification is hardly definitive. However, this is clear evidence - not that it was needed - of the presence of bats in Kinderhook in Martin Van Buren’s day. There are good reasons to suppose that the bats flying around Lindenwald in the mid- 1800s were at least as diverse and probably more abundant than what we see today. And yet it is unlikely that their behavior and habits have changed dramatically. If there are bats roosting in the cupola of Lindenwald today, they may be the same species (Big Brown Bat; Eptesicus fuscus) as roosted there in Martin Van Buren’s day; indeed, perhaps they are direct descendants. Likewise, the bats that flitted along Kinderhook Creek or above adjacent fields were likely much the same species one can find today. Thus, as we describe the modern Lindenwald bat community, one can easily imagine that many, but not all, of these same patterns applied historically.
There are several basic questions that we have been trying to address with our bat monitoring:
- Which species are present?
- What habitats are they using and for what?
- What is their phenology? (That is, when do bats first appear, which species arrive first, when do they depart, if at all?)

Hawthorne Valley Farmscape Ecology Program
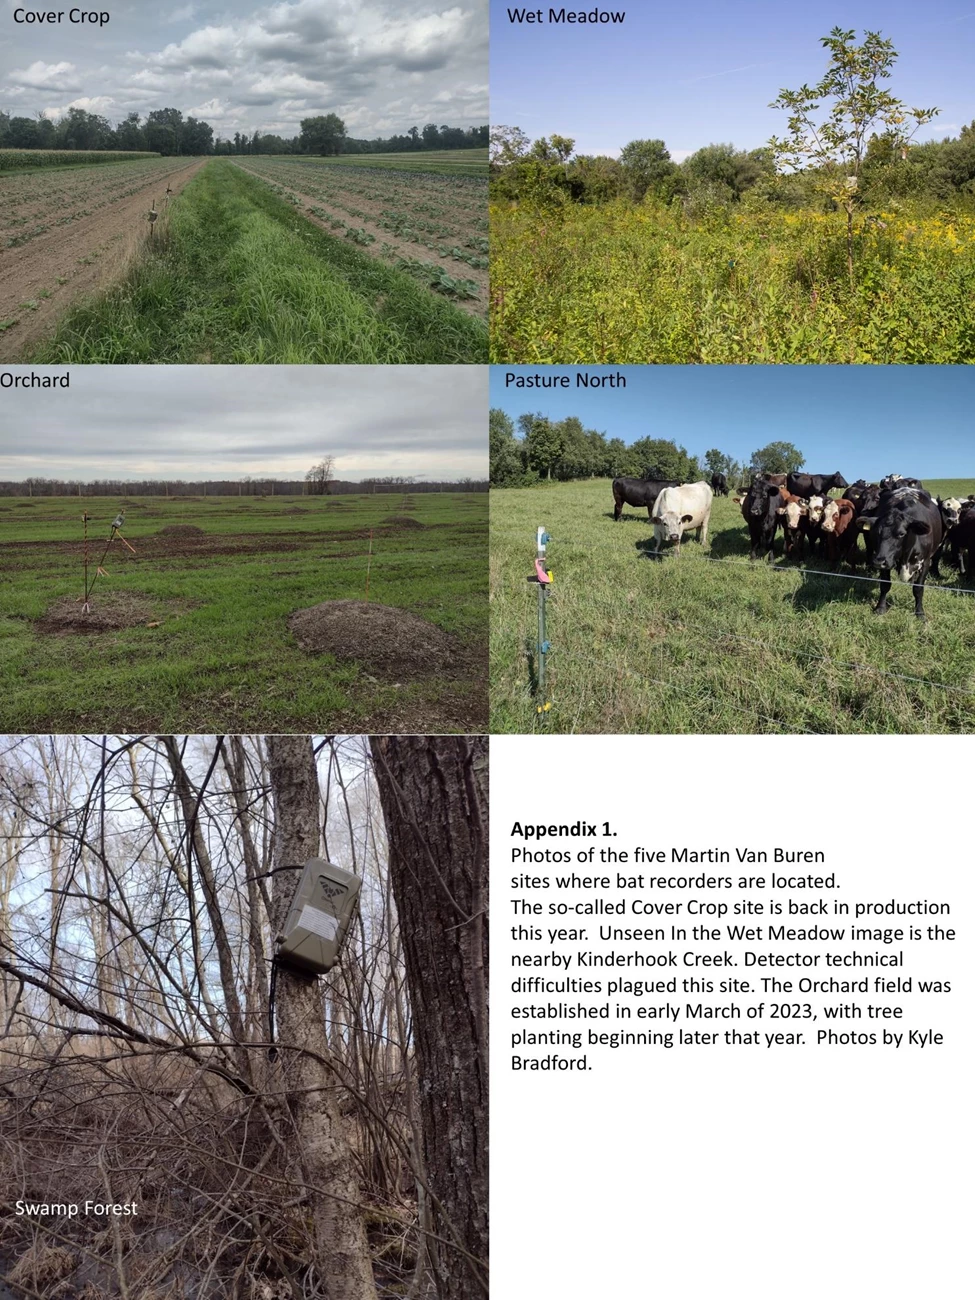
Beginning on the night of February 22, 2023, single Anabat Chorus detectors started collecting recordings in five different habitats at the Martin Van Buren Historic Site: Swamp Forest, Crop Field, Pasture, soon-to-be/newly established Orchard, and Wet Meadow (see Fig. 1 for map and Appendix 1 for habitat photographs). Other than a data loss mid-summer 2023 and a malfunctioning of one recorder (Wet Meadow) in summer of 2024, this data collection has continued until the present day. This report only includes data through mid-June 2024.
Bat detectors record the ultrasound calls that bats make. They are triggered by such calls and so produce a series of short audio files, each, ideally, containing various pulses. In reality, a variety of sounds other than bats can also trigger the devices.
The resulting purported calls were first classified using Sonobat, a software program designed to clean, organize and identify North American bat calls. Sonobat uses various levels of identification, from a fairly liberal algorithm (that may often produce false IDs but is good for pulling out potentially interesting calls for manual vetting) to a conservative one (that IDs many fewer calls but is more commonly correct). For this report, the most conservative ID (“SppAccp” in Sonobat parlance) was used. This resulted in 8188 identified calls out of a total of more than 100,000 individual files.
All autoID programs regularly produce errors, and so should not be accepted without question (Solick et al. 2024). The most rigorous but time-consuming approach is to personally inspect all calls to confirm the identifications. Given the number of calls and the time available, that was not done for this report. Instead, representative calls of each species were inspected to insure that the species list was correct. After that, calls were only inspected in select instances. It is likely that some of the autoIDs are incorrect, but given the number of calls and the use of the most conservative algorithm, it is believed that the general patterns described here are probably accurate for most species, especially Big Brown Bat, Hoary Bat (Lasiurus cinereus) and Tri-colored Bat (Perimyotis subflavus; Solick et al. 2024).
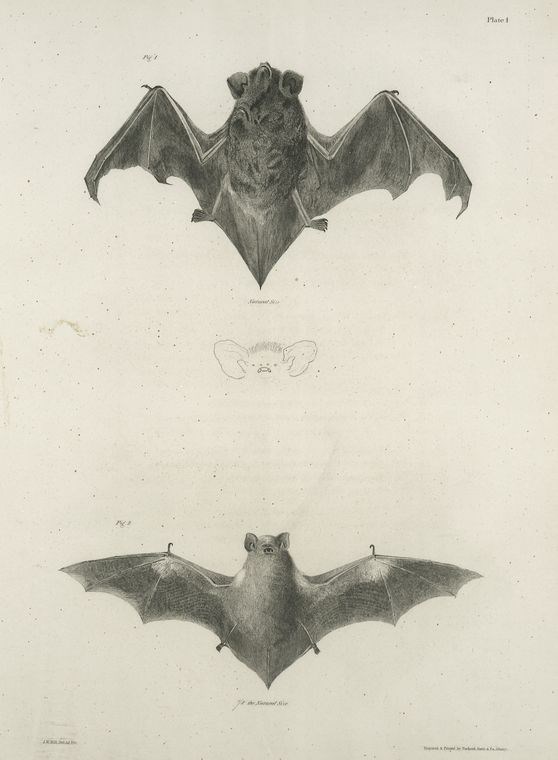
De Kay Natural History of New York (1842).
Furthermore, bats tailor their calls to their goals (e.g., socializing, feeding, travelling) and their surroundings (are they in open fields or cluttered forests? Are they alone or in a group?). It is even likely that the type of food being exploited affects call characteristics; age and gender might also influence calls. While this can confuse identification in some cases, it can also provide useful insights into bat behavior. For example, when approaching a prey item, bats tend to make calls with increasing rapidity resulting in a characteristic pattern known as a feeding buzz (Lausen et al. 2022). We used Sonobat to automatically tally feeding buzzes.
It is important to note that bat call numbers do not necessarily equate with bat abundance. A single bat, flying circles around a detector, can make more calls than a stream of solo bats making single calls. Thus, all the figures reported below are of activity, not of population abundance.
Another caveat is that while it is tempting to assume that a higher number of recorded calls at a particular site indicates relatively higher activity at that site, there can be appreciable variation in sensitivity amongst recording units. Some variation in call abundance may simply reflect that instrument variability. All recorders used in this study were of the same make and age, but this possibility cannot be precluded without periodic sensitivity analyses of the detectors.
Results & Discussion
Which species are present?
Table 1 lists the nine bat species that one can regularly find in our region. As noted above, acoustic monitoring is not 100% definitive, however, based on automatic identification and manual vetting, we believe that at least six species reported in the table are found at the Historic Site.
Table 1. A list of the bats present in New York State, together with their status, aspects of their ecology,
and presence at Martin Van Buren Historic Site (MVB) based on acoustic monitoring.
| Common Name | Scientific Name | NYSStatus | USFWS Status | Migratory? | Regional winter roost sites | Summer maternity sites | Present at MVB? |
| Big Brown Bat | Eptesicus fuscus | s5 | Not ranked | Only regionally, if at all | Caves, buildings | Often in buildings, also treecavities | Yes |
| Silver-haired Bat | Lasionycterisnoctivagans | s2s3 | Not ranked | Yes | Primarily migratory? | Beneath loose bark, tree cavities | Yes |
| Red Bat | Lasiurus borealis | s3s4 | Not ranked | Yes | Migratory | Tree foliage | Yes |
| Hoary Bat | Lasiurus cinereus | s3s4 | Not ranked | Yes | Migratory | Tree foliage | Yes |
| Eastern Small-footed Bat | Myotis leibii | s1s3 | Not ranked | Only regionally | Shallow caves | Natural & human-made crevices | ? |
| Little Brown Bat | Myotis lucifugus | s1s2 | In review | Only regionally | Caves | Various; often human structures | Yes |
| Northern Long-eared Bat | Myotis septentrionalis | s1 | Endangered | Only regionally | Caves | Beneath tree bark, in cavities | ? |
| Indiana Bat | Myotis sodalis | s1 | Endangered | Only regionally | Caves | Beneath tree bark | ? |
| Tri-colored Bat | Perimyotis subflavus | s1 | Proposed | Only regionally | Caves | Tree foliage, cavities? | Yes |
We cannot state with any certainty whether or not the two nationally endangered Myotis species were or were not present. Sonobat did not find any Northern Long-eared Bat (M. septentrionalis) calls, and the Indiana Bat (M. sodalis) was identified only twice. Even manually, we do not feel we can confidently determine the presence of these species, and, in our opinion, mist netting would be needed for definitive determination.
Tri-colored Bat (formerly Eastern Pipestrelle) is probably one of our rarest regional bats, although we have picked up their calls with some regularity along creeks and around waterbodies in the region, including at Martin Van Buren. It is scheduled for Endangered Species listing in Sept. 2024.
Hawthorne Valley Farmscape Ecology Program
What habitats are they using and for what?
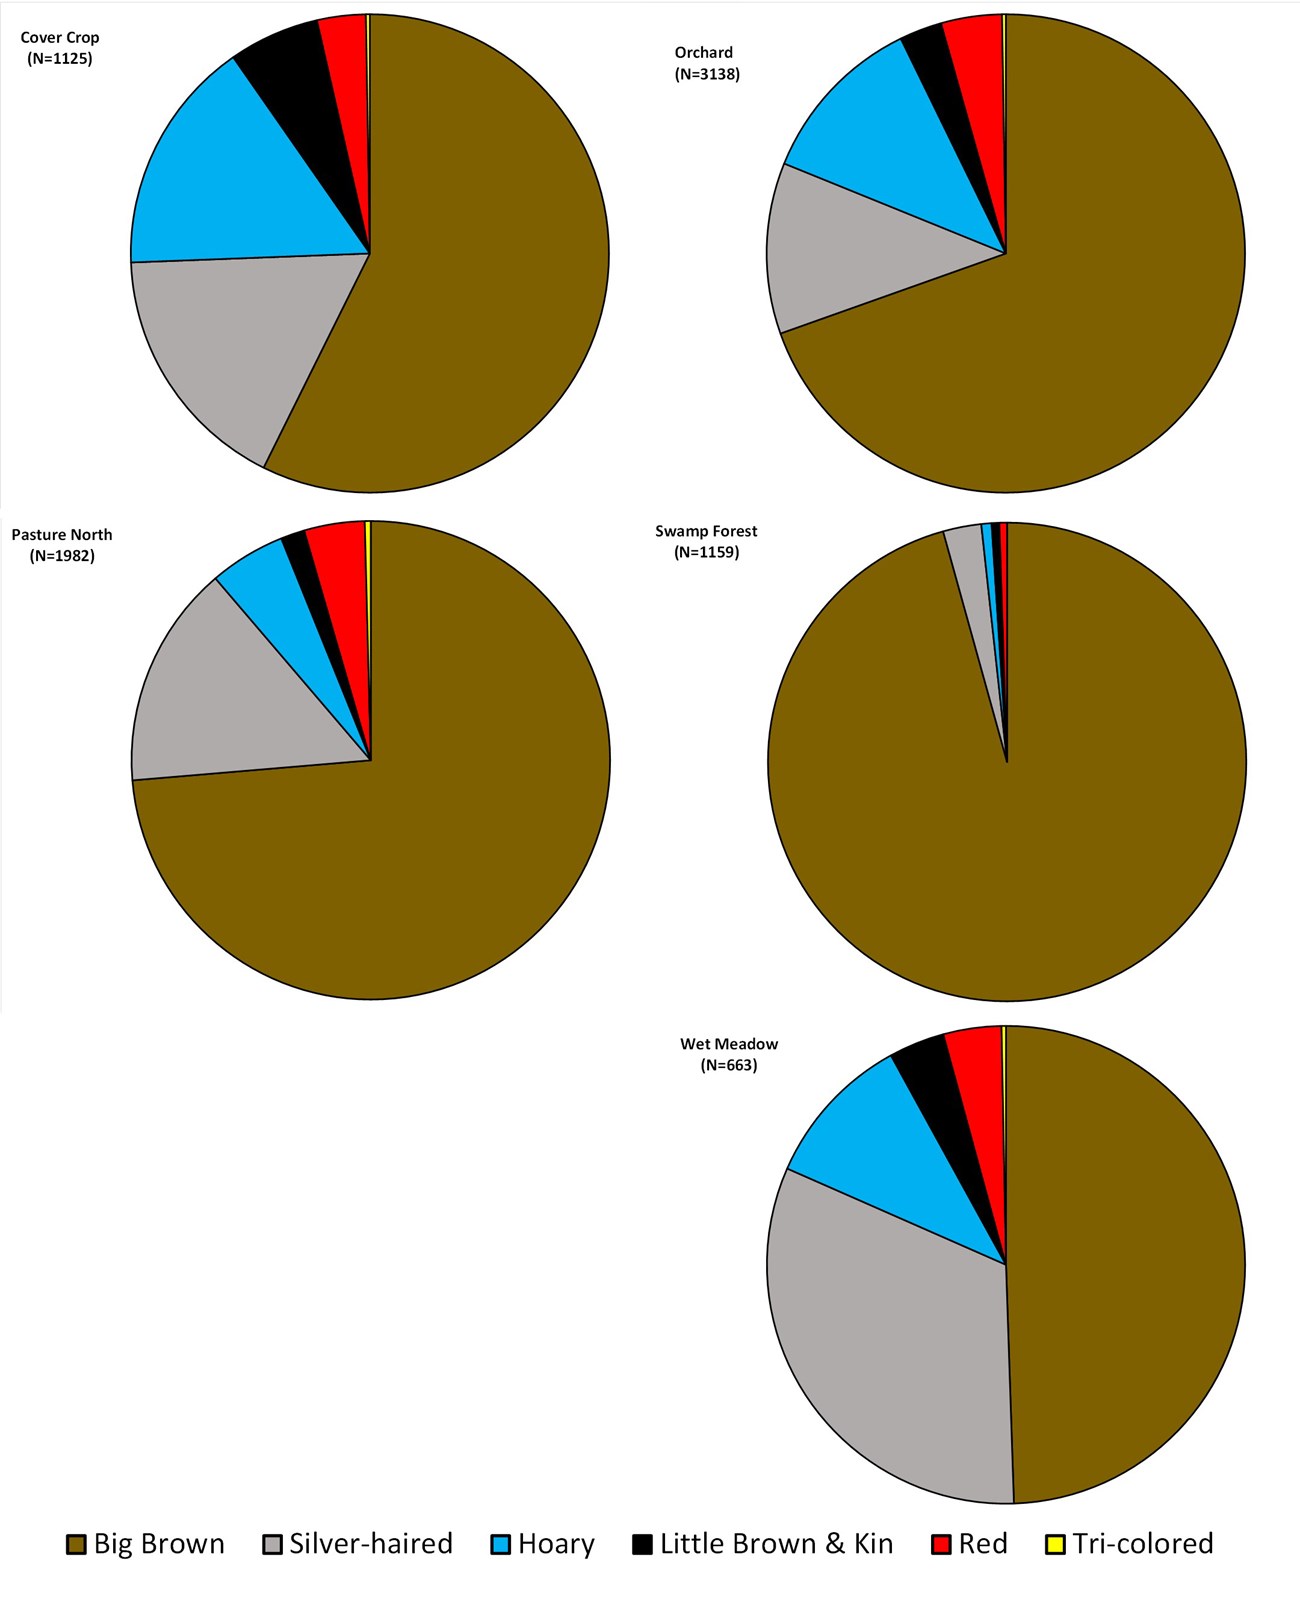
Fig. 2 shows the purported composition of bat activity in each of the five habitats.There are a few generalities that seemed to hold across all five habitats. Big Brown Bat was the most common bat at all sites, usually followed by Silver-haired. In third place, was Hoary Bat, followed by Red Bat (Lasiurus borealis) and Myotis species roughly tied (these two groups are confused by the autoID software with some regularity).
Of the species found, Tri-colored was clearly the least frequently recorded species. Bats were apparently most active in the Orchard and Pasture North, and least active in the Wet Meadow and Cover Crop, however, see our previous caveat regarding variation in recorder sensitivity.
The composition of the recorded calls was broadly similar in the Cover Crop, Orchard and Pasture North. Wet Meadow was somewhat similar, but Silver-haireds were markedly more active. The Swamp Forest was distinctive because Big Brown Bat was proportionally much more active than the other species, primarily at the expense of Silver-haired and Hoary Bats. Big Brown Bats are considered habitat generalists and are said to favor open habitats (Lausen et al. 2022; Thorne 2017).
It would be interesting if they were actually using a forested habitat that was not also favored by other bats. We will be curious to see if this pattern persists.

Hawthorne Valley Farmscape Ecology Program
For purported Big Brown, Hoary, Red and Silver-haired Bats, Pasture North stands out as an apparent site of high amounts of feeding activity. Orchard saw the next highest number of feeding buzzes, with Myotis and Tri-colored apparently feeding as commonly or more commonly therein. On the opposite end, Wet Meadow produced substantially fewer feeding buzzes.
Unfortunately, comparisons across habitats again need to be taken with a grain of salt – as mentioned in the Methods, there can be appreciable variation in sensitivity amongst microphones. However, the same patterns were generally indicated even if we considered feeding buzzes per recorded call (i.e., trying to standardize for variation in absolute call number that might be attributed to variation in recorder sensitivity); the only exception was that while Tri-colored Bat calls were apparently rarer in the Swamp Forest than in the Orchard, the rate of feeding buzzes was higher. If the patterns are generally true, then one can only suppose that the types of flying insects many of these bats are pursuing were especially common and/or accessible in the North Pasture.
Why would a bat fly in a habitat if it’s not feeding? Aside from feeding, bats may use certain spaces to socialize, roost or as travel corridors. Because travelling calls and social vocalizations are often characteristic, a deeper dive into the calls could help clarify habitat use further, but such a detailed analysis is beyond the scope of the present report. A quick scan of calls from the Wet Meadow did suggest that travelling calls were common there.
What is their phenology?
“Phenology” refers to seasonal events – when do particular flowers bloom?, when do frogs call?, or, as in our case, when do bats fly? Phenological change is taken as one indicator of the impacts of climate change. It is easy to imagine that much ecology reflects time-honed synchronies – specialist bees fly at the same time that their host plants flower; birds arrive from migration when sufficient food is available; trees leaf out after the last frost is likely to have happened.As a contribution to our larger work on phenology at Martin Van Buren National Historic Site, we will take a closer look at the phenology of bats. When do bats arrive, when do they depart, and how does community composition change across the year? As others have recognized, one aspect of bat response to climate change is alteration in the timing of their emergence from hibernation or their return from migration (Festa et al. 2023).
Hawthorne Valley Farmscape Ecology Program
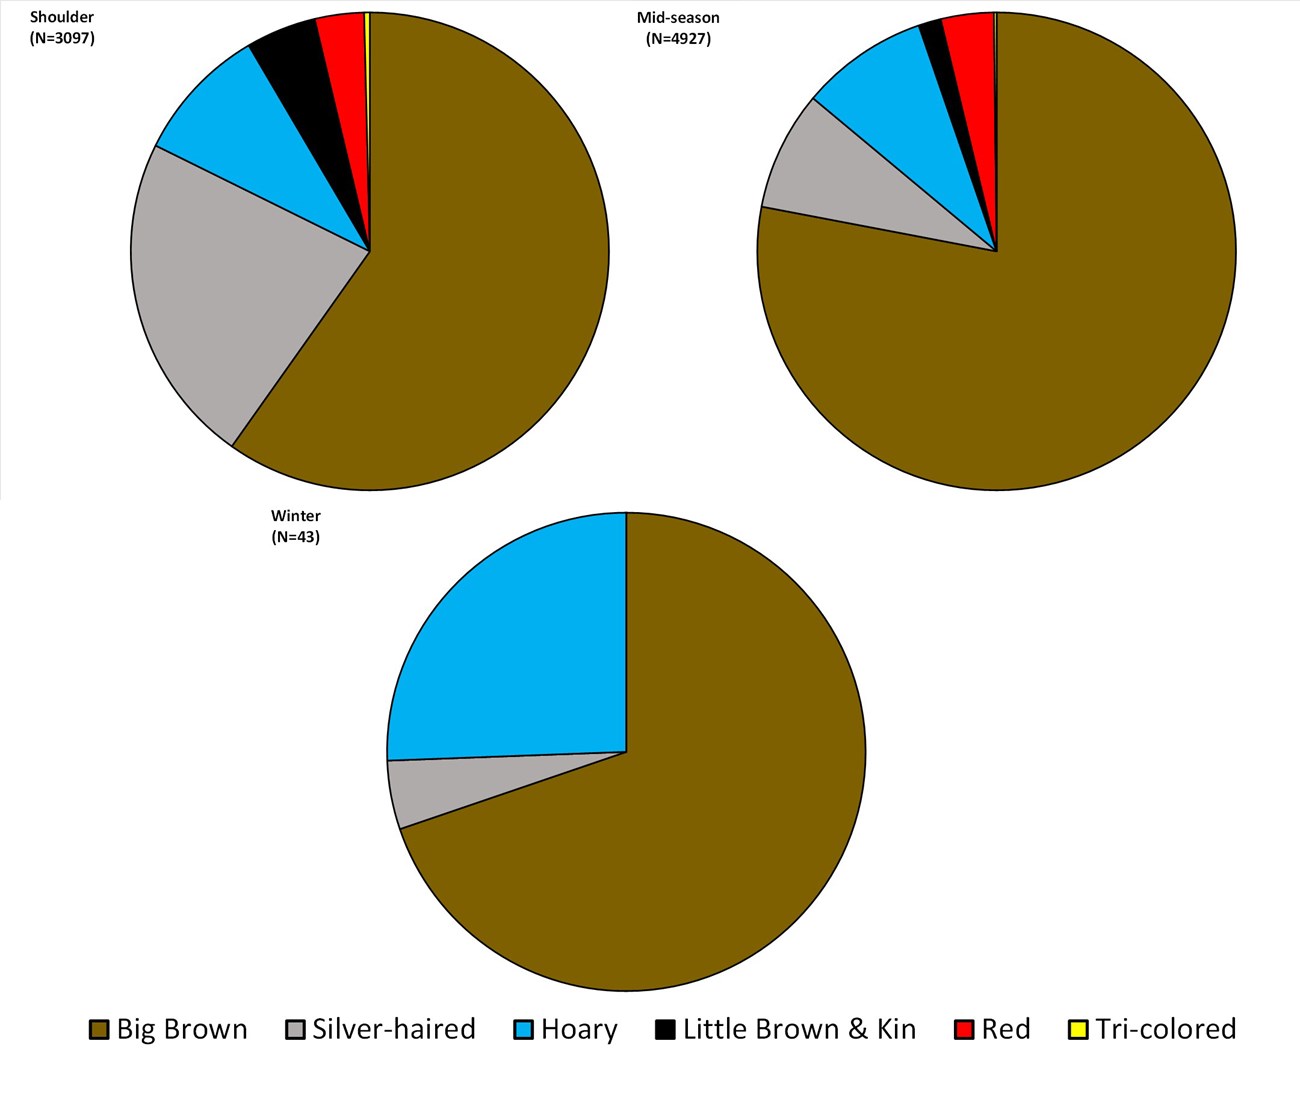
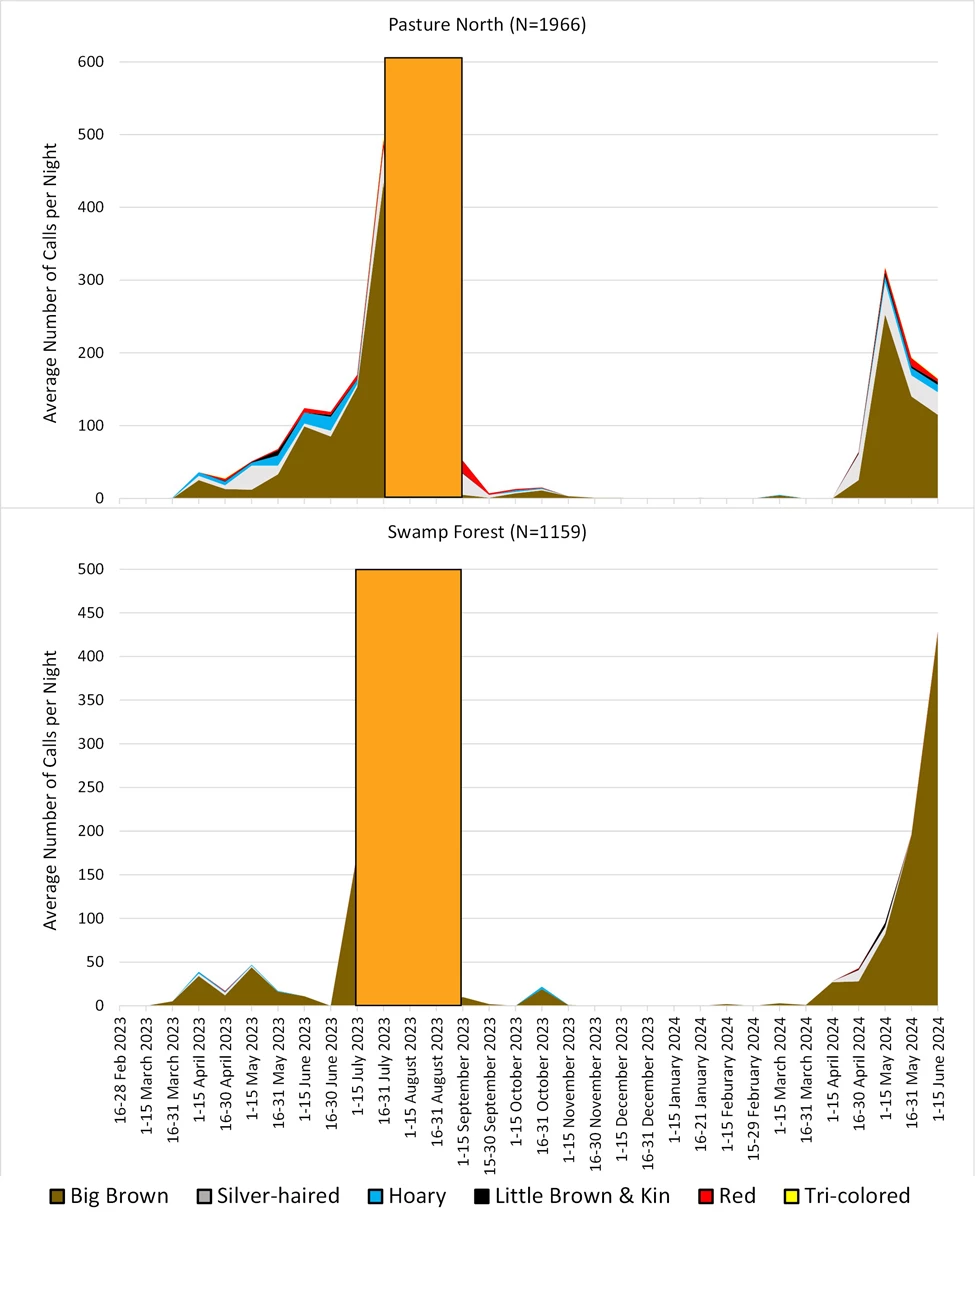
The presence of Big Brown Bat is not surprising, as it is known to winter year-around in buildings and to awaken during warm spells. There is also increasing evidence that at least some Silver-haired Bats are passing the winter in our area. The Hoary Bat has not yet been confirmed in New York during the winter (pers. comm. Mike Fishman), and manual inspection of these calls suggested most or all of them were actually Silver-haired calls.
There is however potential uncertainty, and Hoary Bat cannot be completely ruled out. Many of the Silver-haired calls recorded at this time of year appear to be traveling calls, perhaps suggesting seasonal movements. Interestingly, on one late February day, three such passes were noted within minutes of each other. These may have been from a single bat circling, but might also reflect the passing of a small bat flock.
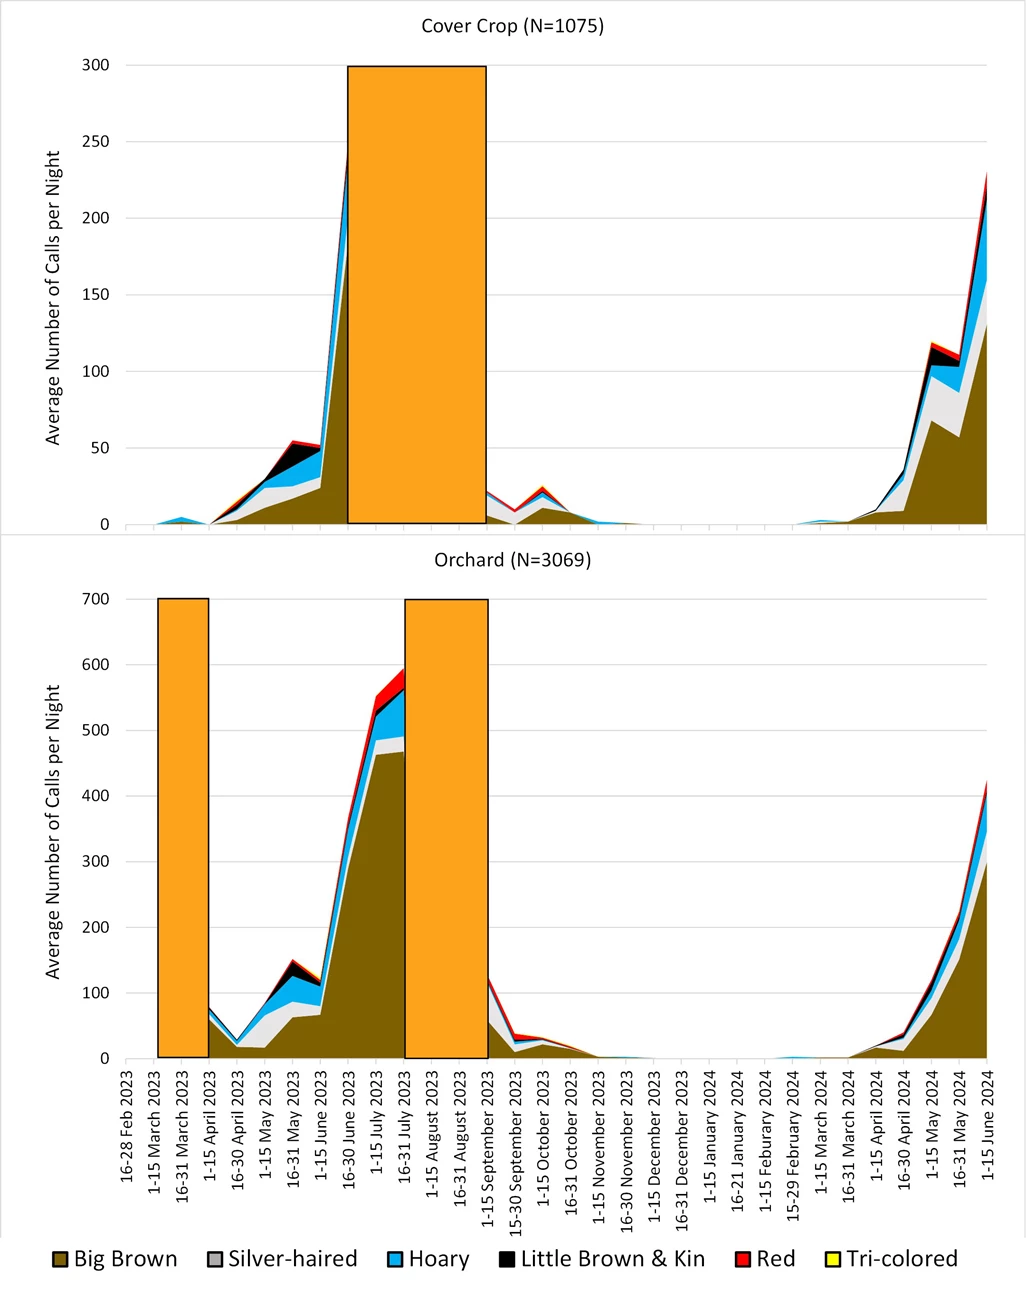
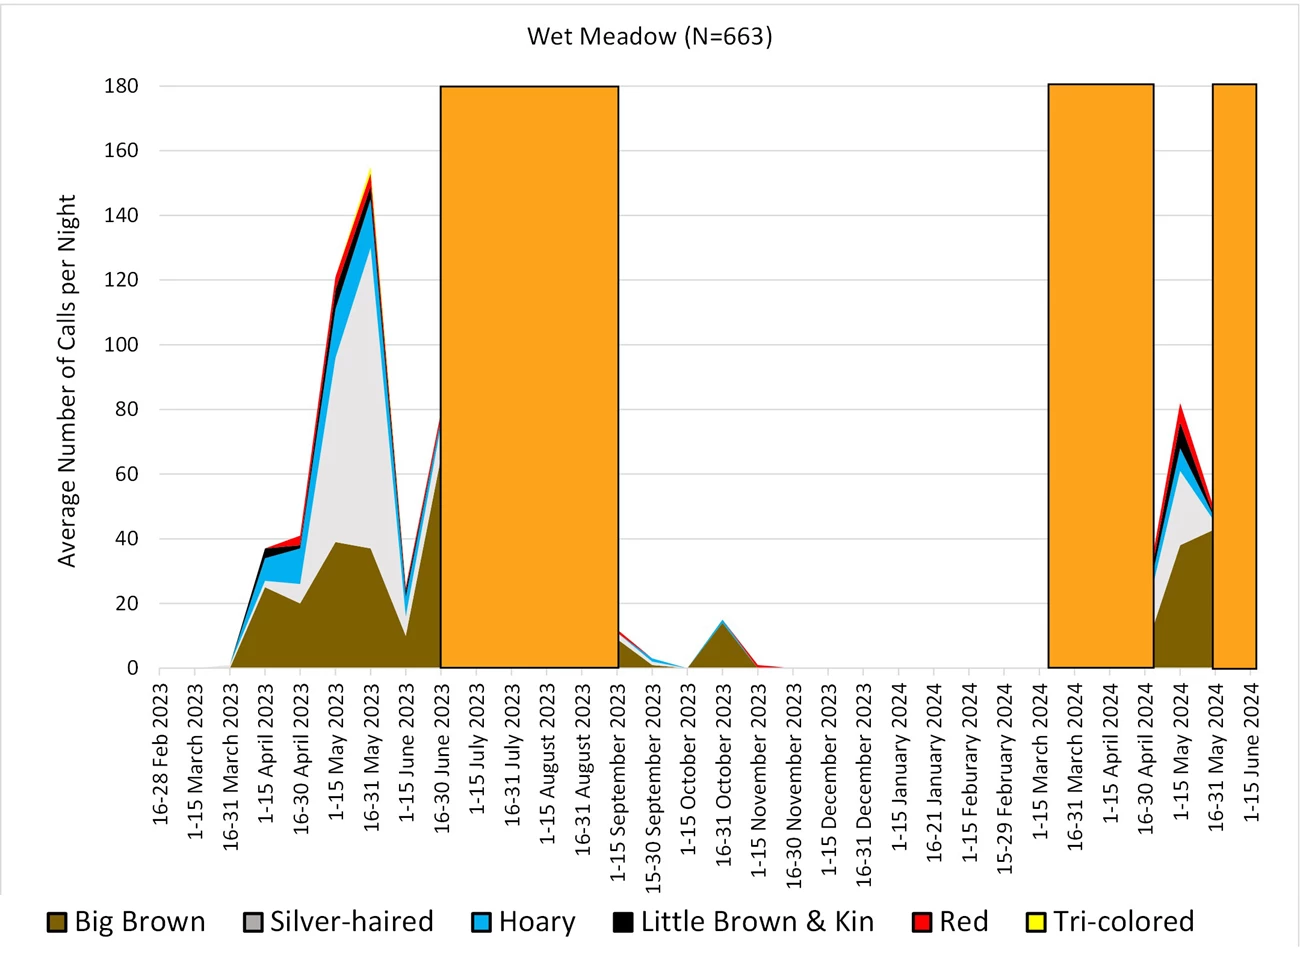
Again, a few general patterns are evident. While we have recorded occasional bat activity almost year-around, the real uptick in activity in both years began during the second half of March. Activity then seems to have dropped precipitously by the beginning of September; unfortunately, because of data loss, we have not yet been able to detail the late-summer pattern. Big Brown Bat calls predominated during all times of year. Assuming that these bats are actually roosting permanently in a structure nearby, this should not be surprising. As already suggested by Fig. 1, throughout the year, Swamp Forest recordings were dominated by Big Brown Bat calls.
The pattern at the Wet Meadow is intriguing – relatively speaking, it seemed to show a bigger April increase in calls than at the other sites. However, we had some issues with the functioning of this bat detector, and the apparent dip after April may be an artifact. Unfortunately, in 2024, recorder issues during April and May meant that few data were collected from this site. Less easy to explain is the apparent early-season abundance of Silver-haired Bat calls at the Wet Meadow. Taken together with the aforementioned suggestion that traveling calls may have been especially common here, one possibility is that Silver-haired and perhaps Hoary Bats are using the stream corridor as a migration route. This will remain just a hypothesis until future early-season records are collected. Equipment issues and data loss preclude knowing if there is any similar autumnal pattern.
Finally, one reason to study phenology is to understand how bats might be responding to climate change. One clear pattern in our annual graphs is the higher levels of apparent activity in May 2024 vs May 2023 for all sites except the Wet Meadow (where technical difficulties are probably confusing the picture). Based on data from our Hawthorne Valley weather station, May 2024 averaged 5 degrees warmer (and average min temperature was 9 degrees warmer) than May 2023. Again, more data are necessary, but this suggests that bats may be quick to respond to warmer conditions during a given year.
Hawthorne Valley Farmscape Ecology Program
Hawthorne Valley Farmscape Ecology Program
Hawthorne Valley Farmscape Ecology Program
Conclusions
Martin Van Buren Historic Site is home to at least six species of bats. For the most part, they seem to show the same relative activity levels across the sites where recordings were made, except that Big Brown Bat was almost the only bat recorded in the Swamp Forest. In order of decreasing activity levels, the species were Big Brown, Silver-haired, Hoary, Myotis, Red and Tri-colored Bats.Bat activity occurred primarily from the second half of March through October, although bats were recorded in every month of the year. July and August (for which we so far have limited data) were perhaps the most active months. We have preliminary indication that the initiation of regional activity is responsive to May temperatures.
We began this short report by noting that the bat fauna of today is probably not too unlike that of Martin Van Buren’s day. In broad strokes, the fauna may have been similar, and bats surely flitted down the Kinderhook and around the Lindenwald cupola, however we have little idea of the details. Work from elsewhere suggests that bats may respond relatively quickly to climate warming with, for example, southern species venturing farther north and migratory species overwintering in more northerly areas.
We may be seeing this now, as there are suggestions that the Silver-haired Bat and perhaps even the Hoary or Red Bat are passing winter farther north than previously thought (alternatively, discovery of these nuances may simply reflect greater monitoring).
Our historical information on NY bats is very spotty and confounded somewhat by evolving taxonomies, but it is summarized in Table 3. Given their habits, prior to mist nets and acoustic recorders, few people did more than collect the occasional bat they found. A few at-dusk shooting surveys were conducted but, because species vary somewhat in their flight times, such surveys may have misrepresented actual species abundance.
Comparing these notes to the observations we have summarized and trying to read our partial tea leaves, we might propose that Big Brown Bat has increased somewhat, Little Brown and perhaps Red Bat have decreased somewhat, and Silver-haired and Hoary may have undergone less change.

Hawthorne Valley Farmscape Ecology Program
Wilson's American Ornithology (1808-1814)
If this is true, they may be spending more time in residence than in Martin Van Buren’s day. Were they to forego migration, their mortality at wind turbines might be reduced; currently, these species suffer heavy mortality due to autumn collisions with wind turbines (Lloyd et al. 2023).
Some of the patterns we have noted in this report may just be annual flukes reflecting the oddities of a particular year. Continued monitoring may help us understand both temporal (both seasonal and across years) and spatial patterns in the ecology of bats at the Martin Van Buren Historic Site.
Thanks to Kyle Bradford for ably maintaining the bat detectors and downloading the files since their installation.
Literature Cited
Cooper, William. 1848 [read 1837]. Descriptions of five species of Vespertilio that inhabit the environs of the City of New York. Annals of the Lyceum of Natural History of New York. 4: 53-63.
De Kay, J. 1842. Natural History of New York. Part 1 Mammalia. White &
Visscher.
Emmons, E. 1840. Report on the Quadrupeds of Massachusetts. Folsom, Wells and Thurston.
Festa, F., L. Ancillotto, L. Santini, M. Pacifici, R. Rocha, N. Toshkova, F. Amorim, A. Benítez-López, A. Domer, D. Hamidovíc, S. Kramer-Schadt, F. Mathews, V. Radchuk, H. Rebelo, I. Ruczynski, E. Solem, A. Tsoar, D. Russo and O. Razgour. 2023. Bat responses to climate change: a systematic review. Biological Reviews 98: 19-33.
Lausen, C.L., D.W. Nagorsen, R. M. Brigham and J. Hobbs. 2022. Bats of British Columbia. 2nd Edition. The Royal British Columbia Museum.
Mearns, E.A. 1898. A study of the vertebrate fauna of the Hudson Highlands, with observations on the mollusca, crustacea, lepidoptera, and the flora of the region. Bulletin of the American Museum of Natural History 10: 303-352.
Merriam, C.H. 1882/1884. The Vertebrates of the Adirondack Region, Northeastern New York. Transactions of the Linnaean Society of New York. 1: 9-106, 2: 9-214.
Solick, D.I., B.H. Hopp, J. Chenger, and C.M. Newman. 2024. Automated echolocation classifiers vary in accuracy for northeastern U.S. bat species. PLoS ONE 19(6): e0300664, https://doi.org/10.1371/journal.pone.0300664.
Thompson, Zadock. 1853. History of Vermont, Natural, Civil and Statistical. Published by the author.
Thorne, Toby. 2017. Bats of Ontario. Matt Holder Environmental Research Fund / Hawk Owl Publishing.
Woodworth, W.V.S. 1839. Zoological and botanical report from the Kinderhook Academy. Annual Report of the Regents of the University of the State of New York. 52: 206-207.
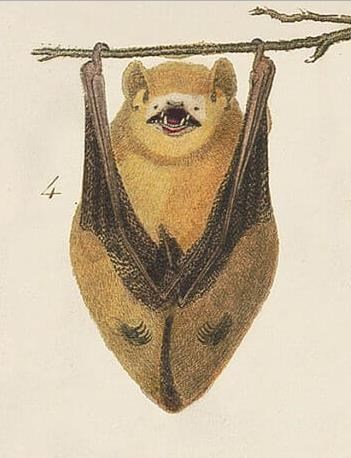
What is probably a Red Bat, from Wilson's American Ornithology (1808-1814).
Hawthorne Valley Farmscape Ecology Program
