Part of a series of articles titled The Midden - Great Basin National Park: Vol. 16, No. 2, Winter 2016.
Article
Precipitation Record at Great Basin National Park
This article was originally published in The Midden – Great Basin National Park: Vol. 16, No. 2, Winter 2016.

NPS Photo by G. Baker
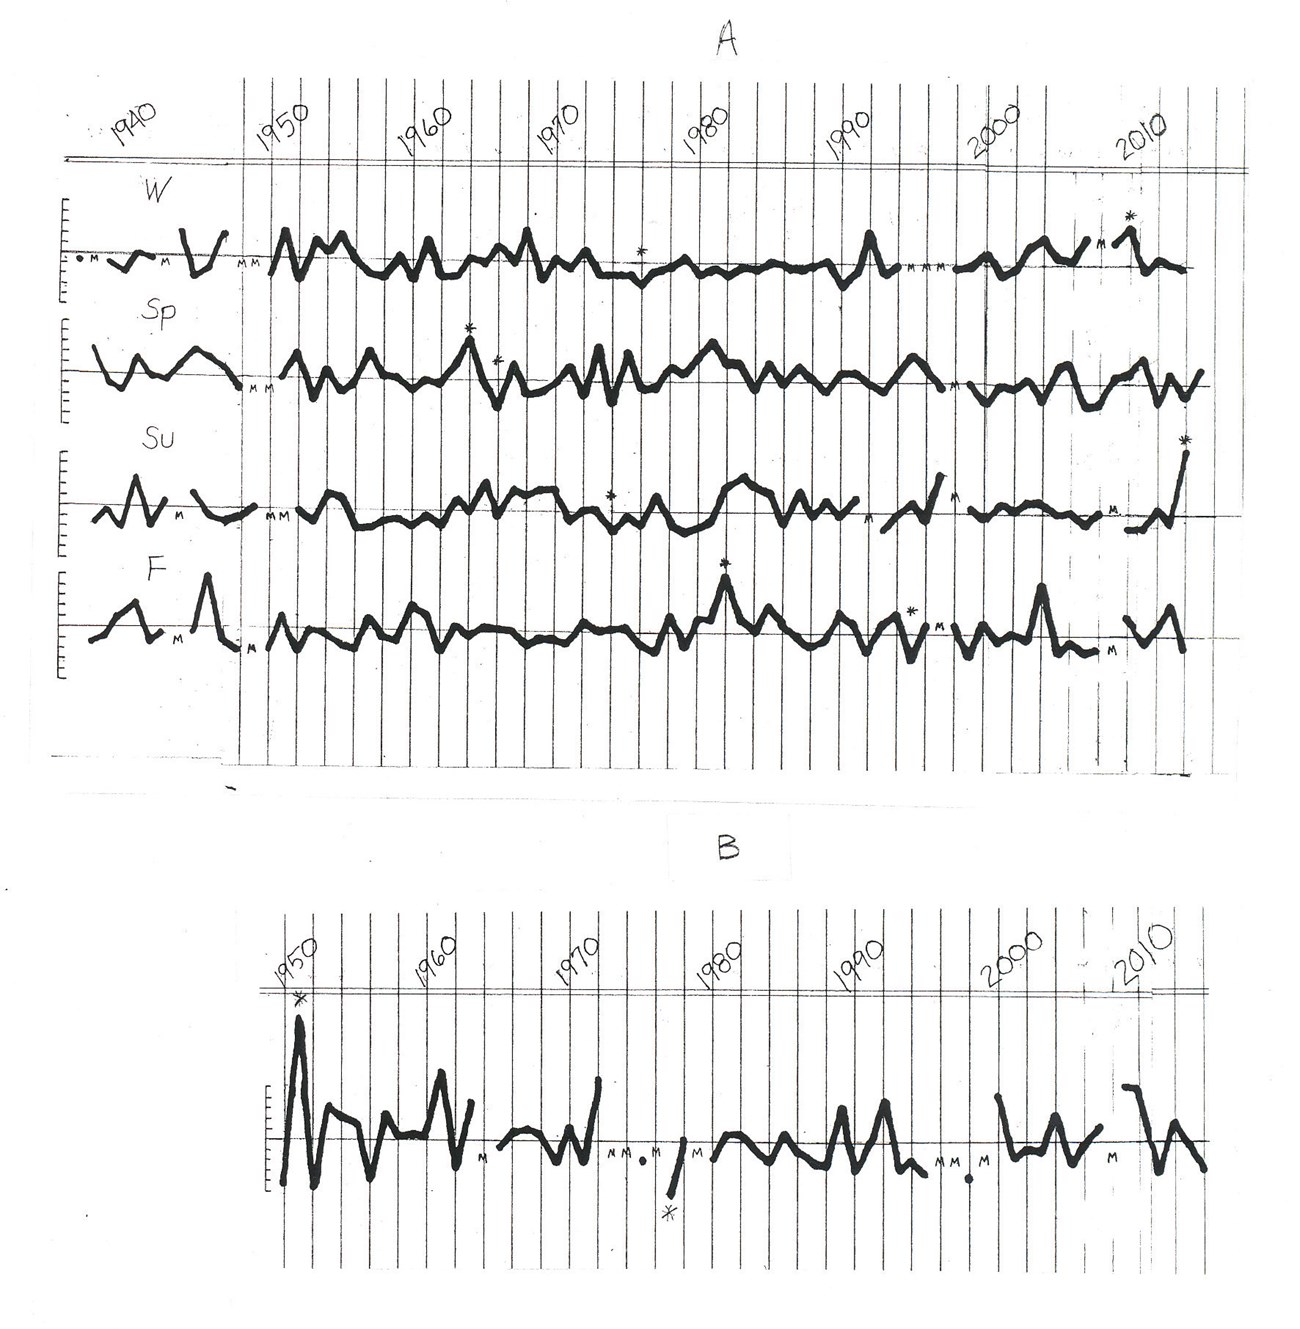
Continuous precipitation data for Great Basin National Park, recorded at the Lehman Caves Visitor Center (LCVC), extend back to 1937. In this quick look at those data, several conventions are followed. First, any month with more than five days without data are omitted from the set and recorded as “missing.” Second, seasonal values are considered “missing” if any of the included months are identified as “missing.” Third, the four seasons are represented by aggregated months following climatological standards: winter is December, January, and February; spring March, April, and May; summer June, July, and August; fall or autumn September, October, and November. Fourth, the years for winter seasons are identified by the years for the December months. Fifth, all values are expressed in inches.
Year
The annual mean for the LCVC is 13.33 inches, although, of course, totals increase with elevation in the park and decrease downward toward valley bottoms (e.g., Baker, 7.73). Exceeded by all locations in the eastern half of the country, the value at Lehman Caves is likely similar to comparable sites throughout the Intermountain West. Also, for comparison, places with similar annual precipitation totals include locales along the southern California coast (Los Angeles, 13.15), in interior valleys of central California (Tracy, east of San Francisco, 13.13), and at the western edge of the Great Plains (Billings, Montana, 13.66, or Limon, Colorado, east of Denver, 13.85).
Seasons
If the annual mean is unremarkable, the seasonal distribution of precipitation at the LCVC is, if not unique, at least distinctive for its evenness: winter, 3.16; spring, 3.85; summer, 3.06, fall, 3.32. This similarity in the seasons reflects the location of the LCVC and the park. In winter, the park is far enough north to receive precipitation when the westerly winds aloft are expanded into the middle latitudes and strongest in intensity (e.g., Boise: winter 3.74; spring 3.98; summer 1.26; fall 2.68). The park lies within the northern interior west, an area noted for a spring precipitation maximum, explained by the extension of waves in the still active Westerlies southward over the continent at a time when high pressure is building over the eastern Pacific Ocean (e.g., Boise; also, Ely winter 2.79; spring 3.94; summer 1.97, fall 2.68). The park is sufficiently east and south to experience the Southwestern Monsoon, when moisture streams northward, particularly aloft, from the subtropics (e.g., Tucson: winter 2.98; spring 1.38; summer 4.45; winter 3.11). Finally, the fall season may see either a continuation of the summer monsoon or an early onset of winter storms, or both. This evenness in precipitation through the year is particularly unusual for a place in the American West, where wet winters and dry summers are the norm.

For both A and B: Horizontal line is mean value. M identifies years with missing data. Asterisks indicate extreme values.
The mean snowfall is 73.8 inches, with every month except July and August averaging some snow. The year-to-year variability is high; the highest snowfall year was 1951- 1952 with 188.7 inches, the lowest was the following year, 1952-1953, with 24.2 inches (Figure 1).
Trends
Evenness in mean seasonal precipitation seems echoed in annual seasonal precipitation over the period of record. However, the winters of the 1970s and 1980s seem dry (eighteen years below the mean); but in thirteen of those years the spring precipitation was above average. Also, during the 1970s both summer and fall precipitation appears low. The drought of the most recent years (famously, in California) also appear in the record at Great Basin (note, by contrast, that the summer of 2014 is the wettest on record, with 8.96 inches).
Perspective
Studies of Holocene paleoclimate in the Great Basin identify a positive relationship between warm temperatures and low precipitation, a linkage most likely related to cool season conditions. Yet, the record at Great Basin National Park seems ambiguous, judging by the mean temperature for the winter season: During the six driest winters, the mean seasonal temperatures were above average in only three of the years (1952, 1969, 1976), and three were colder (1945, 1960, 1990). The snowfall record is a little more clear: the six highest snow years were all colder than average (1951, 1961, 1972, 2000, 2009, 2010), but the six lowest snow years included four years of colder than average temperatures (1950, 1952, 1990, 2011) and only two with temperatures above the seasonal mean (1956, 1977). Perhaps the particular years since 1937 cannot be taken as analogues for the periods of warm dry winters in the more-distant past. Recent climate warming might replicate those positive relationships, however, and create future climates unknown in the historical record.
Last updated: March 13, 2024
