Last updated: February 24, 2022
Article
Permafrost Resource Brief for the Arctic Network
“A skeleton is to a human body what permafrost is to Arctic land.”
-Santosh Panda, Permafrost Laboratory, University of Alaska Fairbanks
Permafrost is frozen ground that does not thaw in the summer due to a cold climate.
NPS/Ken Hill

Why permafrost is important
Permafrost underlies most of the Arctic Network and affects nearly everything in the arctic ecosystem, from soils and vegetation to water and wildlife. Permafrost prevents water from soaking deep into the ground, which makes soils wet and runoff fast. Ice can build up in the ground and then thaw, producing pits, ponds, lakes, and landslides.Permafrost stores about half of all soil organic carbon on Earth. When it warms and thaws, this carbon is released from the soil as carbon dioxide and methane (greenhouse gases). Permafrost thaw increases soil erosion and creates ground slumps and landslides. Thawing permafrost also changes the local hydrology by changing soil wetness, nutrient cycling, sediment loads and siltation of streams and lakes, and can form and drain lakes. It creates the second-greatest disturbance to boreal forests, after wildfires.
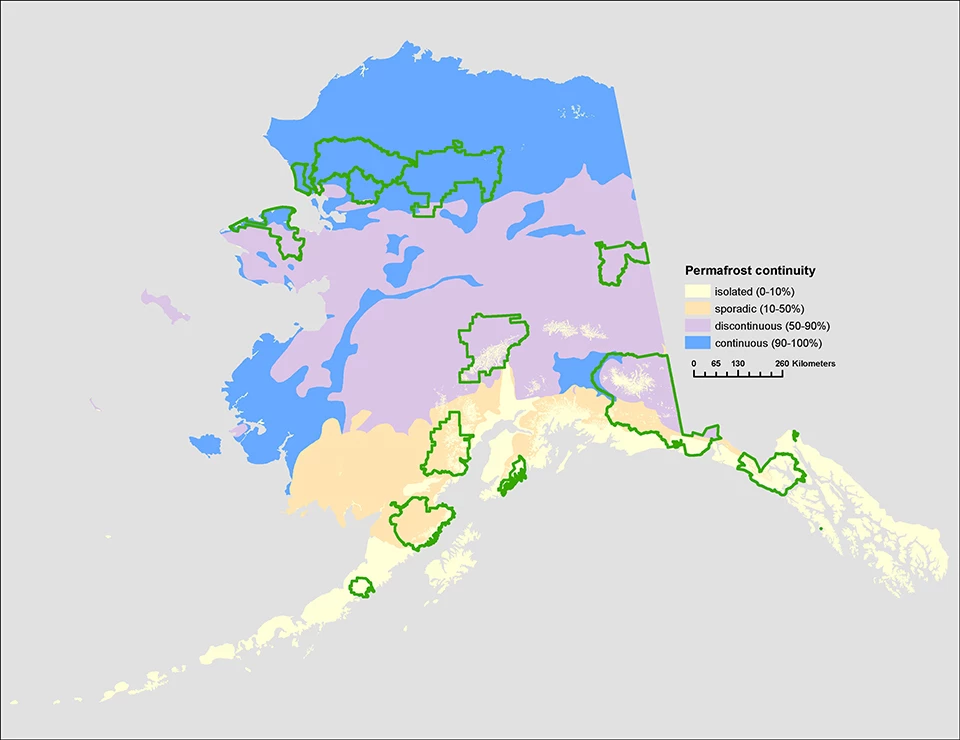
Data: Brown et al. 2002 National Snow and Ice Data Center (nsidc.org). Cartography: Michael Loso/NPS.
What we want to know about permafrost
• Trends through time in ground temperatures at representative sites in the Arctic Network. This will indicate whether the permafrost is stable or thawing.
• Trends through time in the abundance and area of landforms caused by thaw of permafrost, such as landslides and pits from melting ice wedges.
• Trends through time in the abundance and area of landforms caused by thaw of permafrost, such as landslides and pits from melting ice wedges.
• The growth rate of large slumps caused by thaw of permafrost and the rate of sediment loss from slumps.
Status of permafrost in the Arctic Network
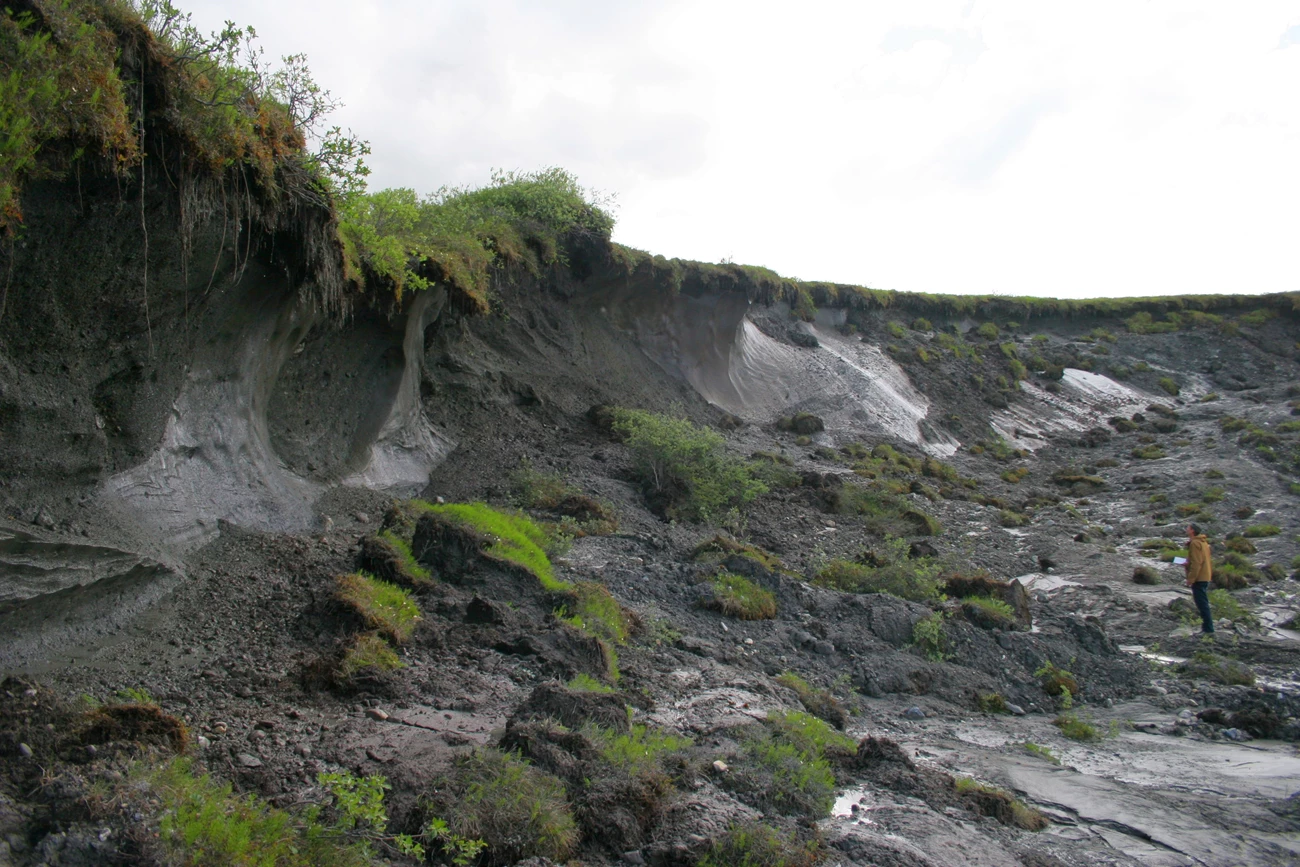
Mean annual air temperatures from 2014-2019 increased in a stepwise fashion relative to the preceding 30-year period by about 2°C (3°F) over most of the Arctic parks, and as much as 3°C (5.4°F) in the far western coastal areas. As of 2019, these warm temperatures had not set off a large number of new thaw-related landslides, probably because the most vulnerable areas already slid during the unusually warm weather in the mid-2000s decade. However, recent warm and wet conditions caused some thaw of ice masses near the ground surface that was accompanied by subsidence of the surface. This resulted in the formation of many new small pits and ponds in some lowland areas and opened up new passageways for water to run out of the shallow lakes that dot the tundra. These events led to a record number of drained lakes in 2018 and 2019.
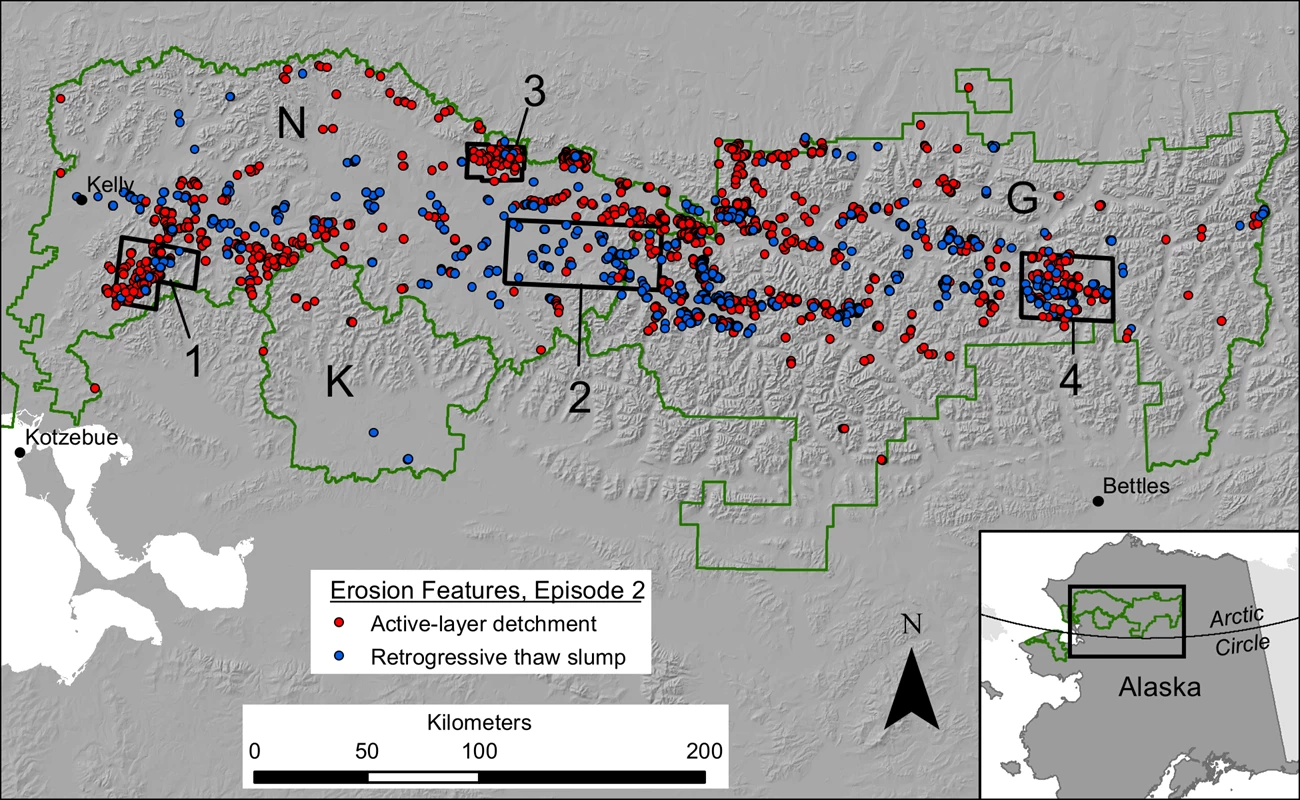
NPS/Dave Swanson
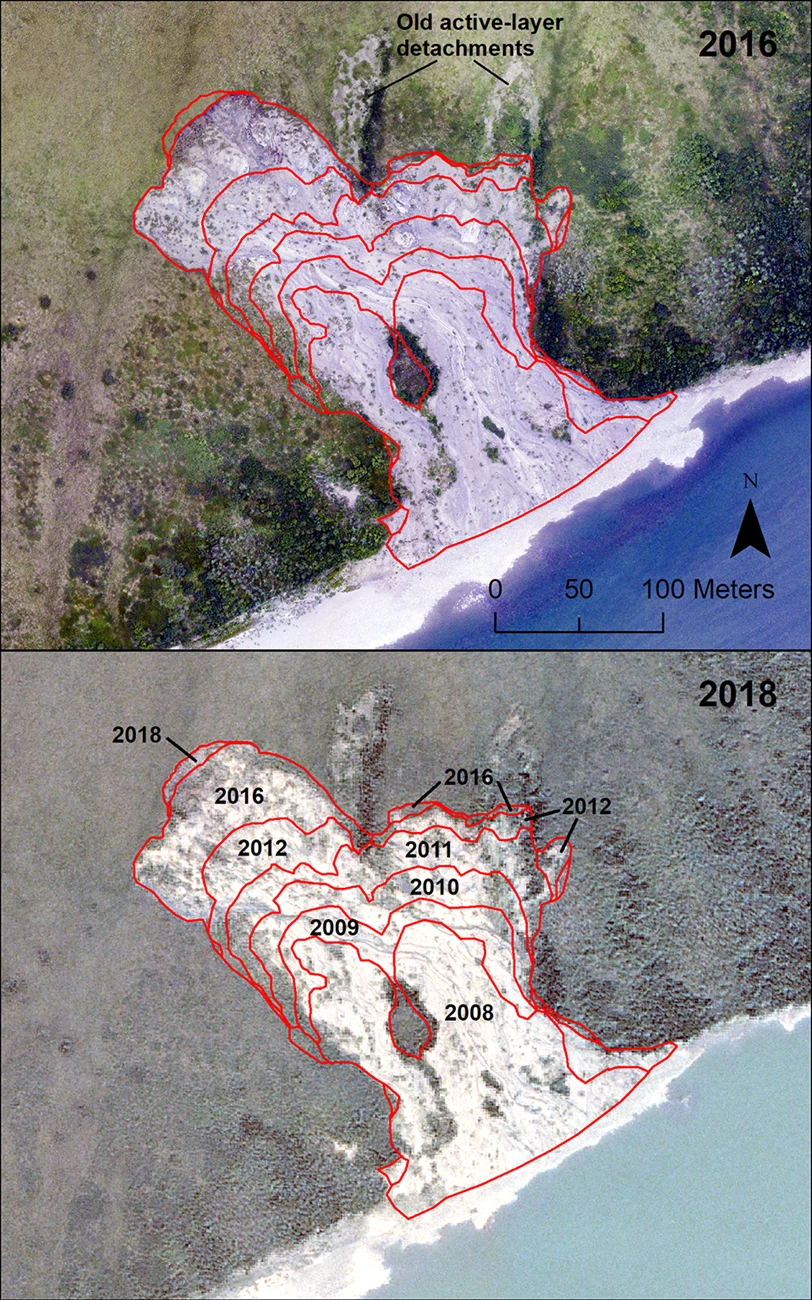
NPS/Dave Swanson
How we monitor permafrost
- Monitor ground temperatures at strategically chosen locations around the Arctic Network, to determine if ground temperatures are rising and if so, how much and how fast. Ground temperature monitoring are co-located with air climate monitoring stations.
- Monitor the area occupied by landslides caused by thaw of permafrost. Map these features on satellite images and historical aerial photographs to determine if they are becoming more or less abundant.
- Create 3-dimensional models of selected high-impact slumps caused by thaw of permafrost and track their growth over time. 3D models are made from aerial photographs with special computer software. Repeat the photos every few years to track the growth of slumps.
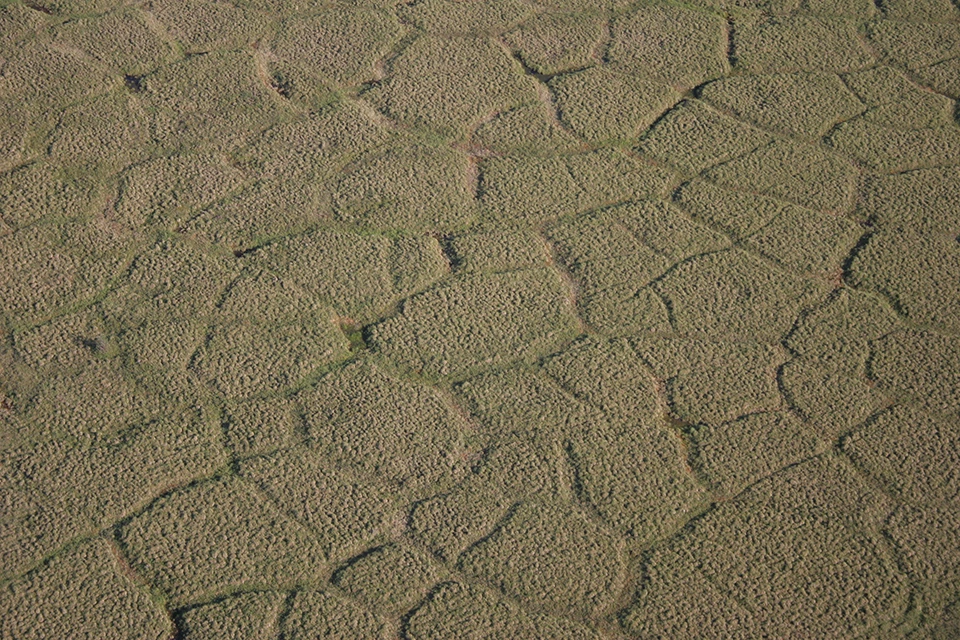
- Monitor the degradation of ice wedges by mapping the appearance of the small ponds that form as the wedges melt. These ponds are visible on high-resolution satellite images and aerial photographs. Ice wedges are a common form of ground ice in the arctic and produce distinctive polygonal patterns.
NPS/Ken Hill