Last updated: November 8, 2022
Article
Trends in Water Quality at Bryce Canyon National Park, Water Years 2006–2021

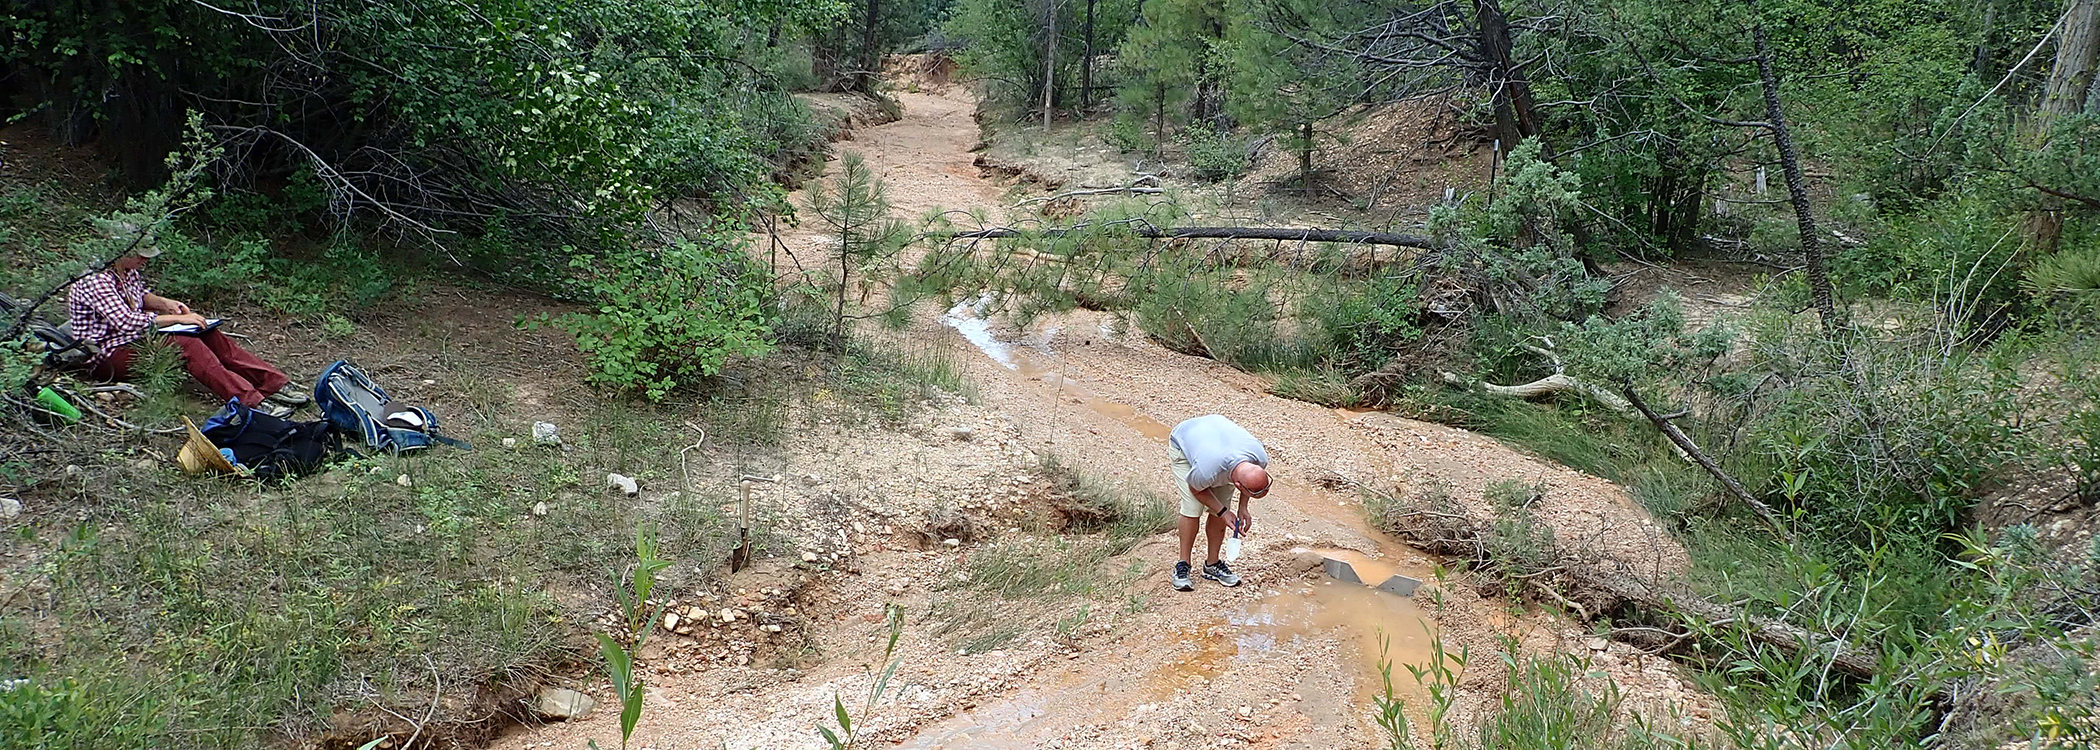
Sampling location on Sheep Creek, Bryce Canyon National Park.
Background
The quantity of water in streams, and the content of materials found in them, affect the productivity of ecosystems and the quality of human recreation. The Northern Colorado Plateau Network (NCPN) monitors stream conditions that are important in maintaining a healthy habitat for aquatic organisms, wildlife, plants, and people.
About once a month, our staff collects water-quality samples at three sites in Bryce Canyon National Park. After the samples are analyzed, the network reports the results to park managers. This consistent, long-term monitoring helps alert managers to existing and potential problems. Looking at the results over time can help managers know how they’re doing at addressing those problems—or at maintaining good water quality.
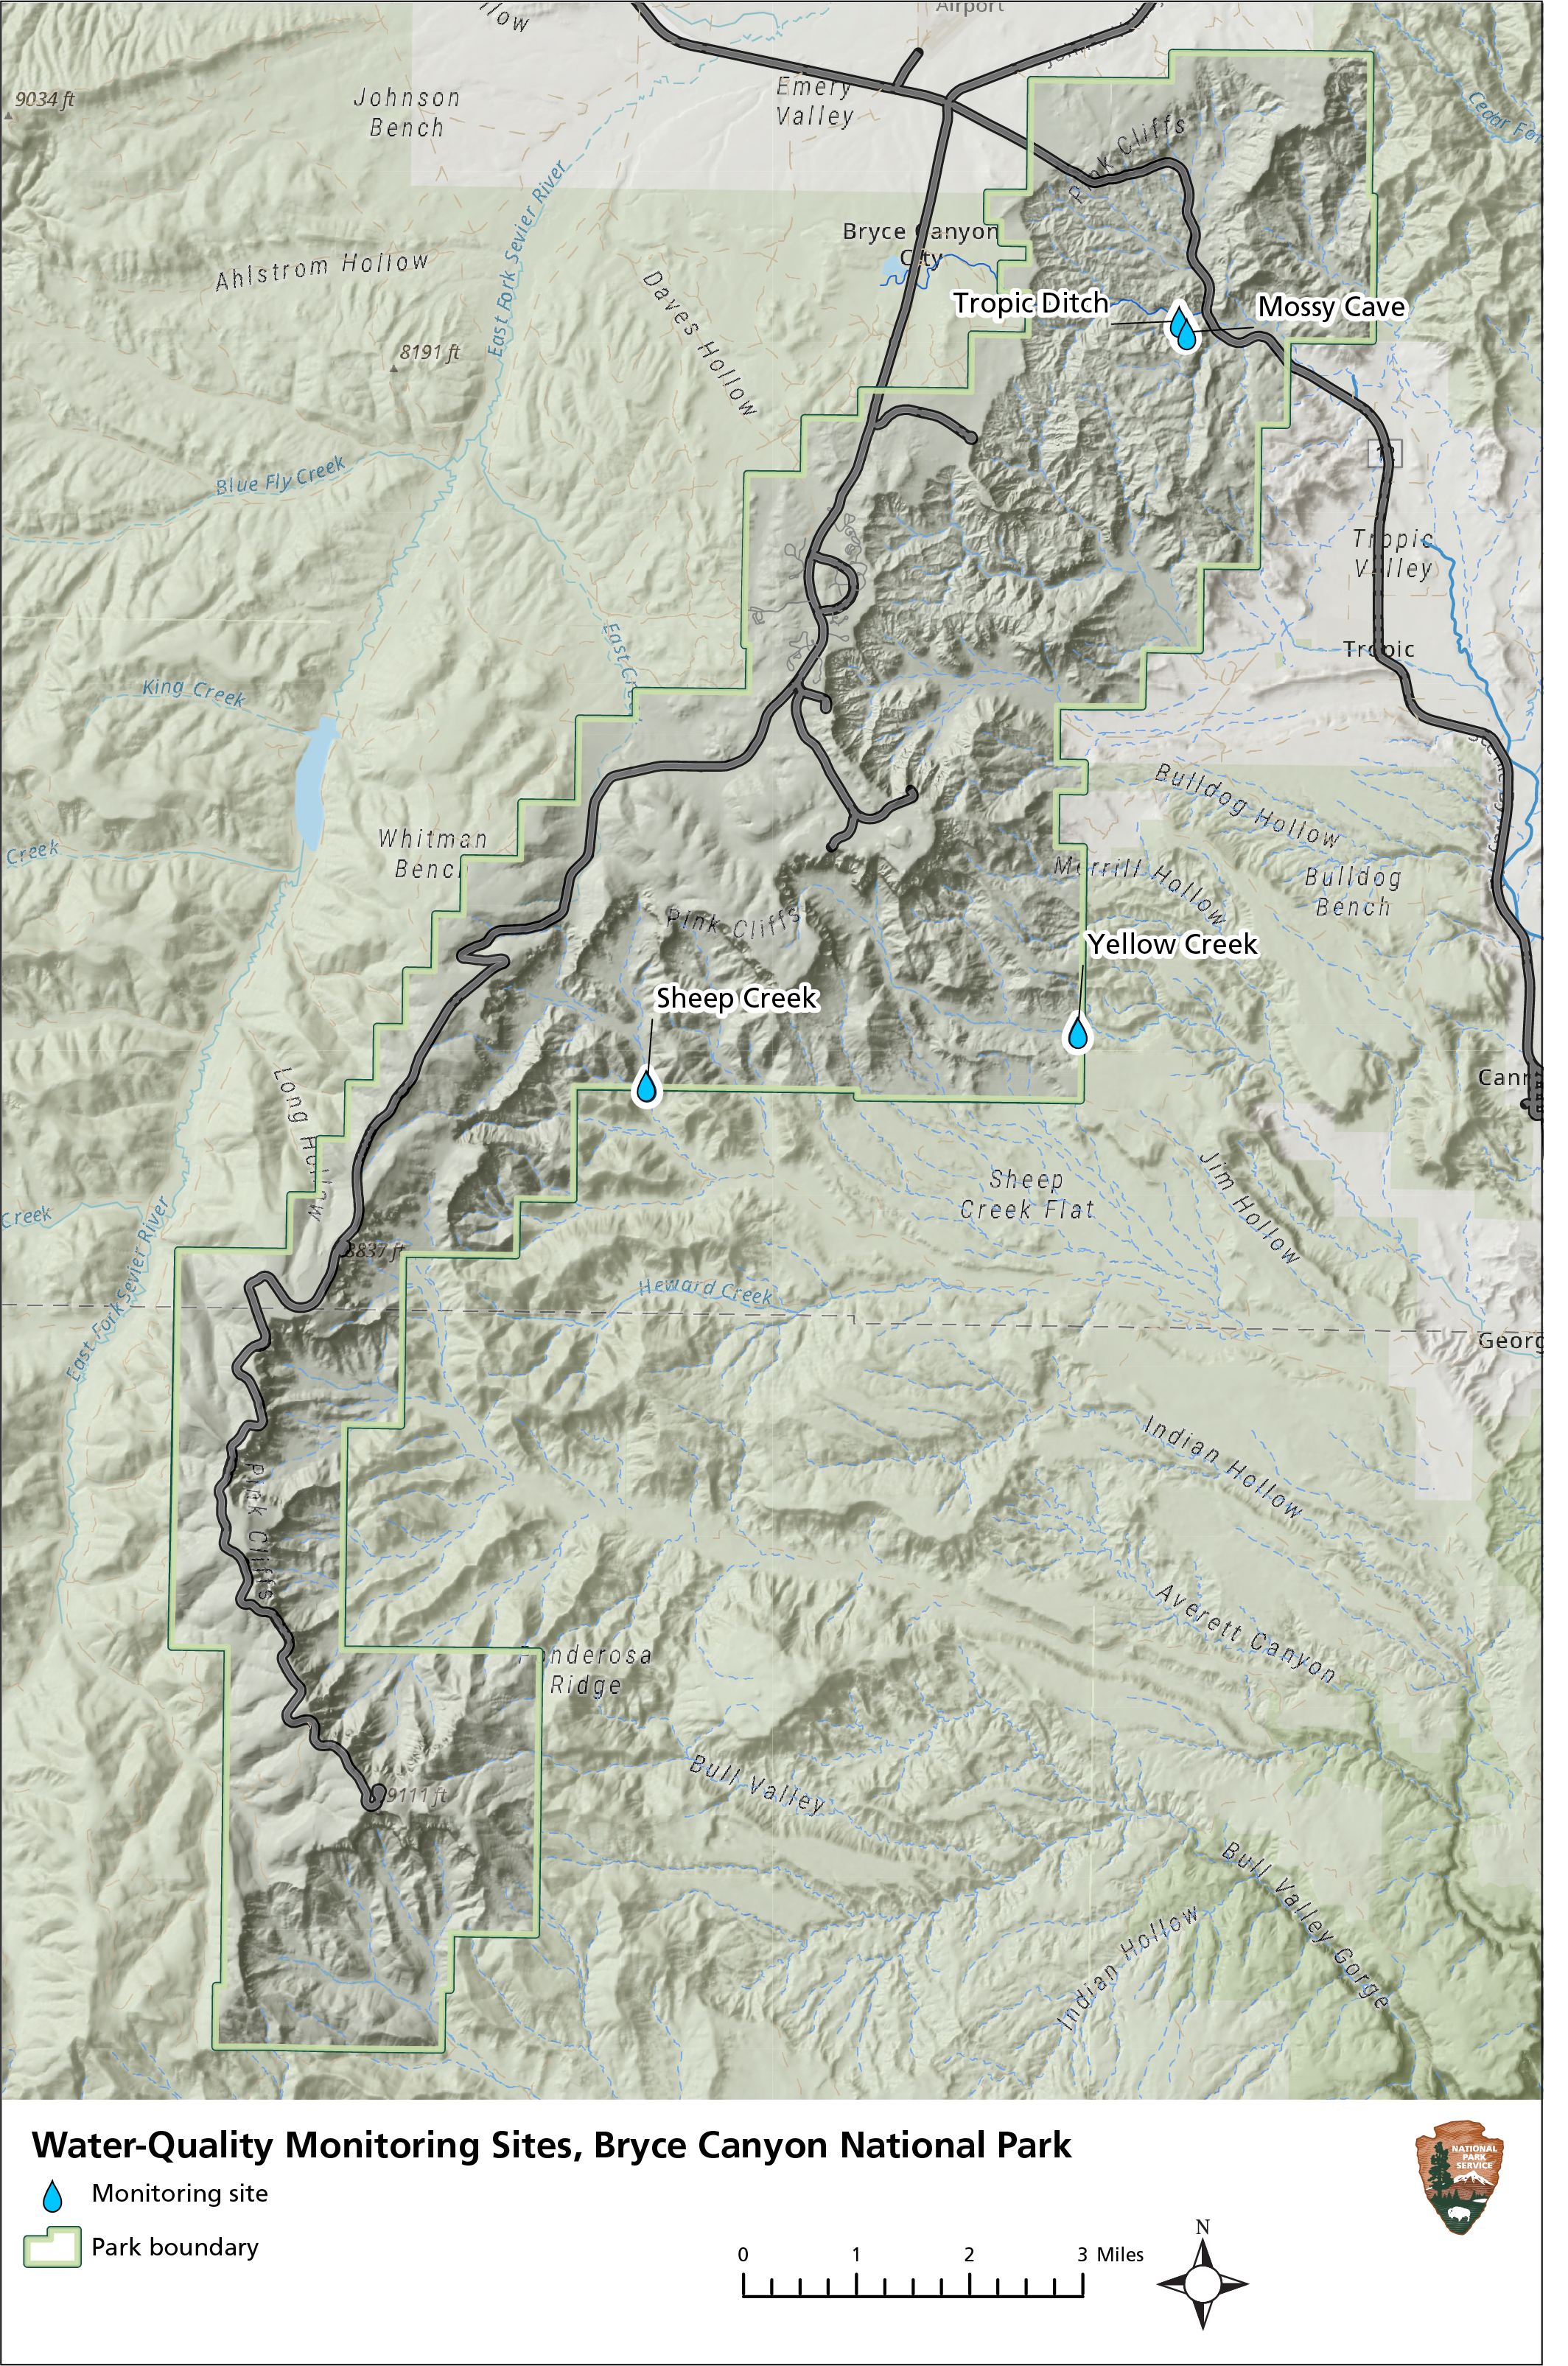
Monitoring stations are located on Sheep Creek, Yellow Creek, and Mossy Cave Spring (see map). Data collection began at Sheep Creek and Yellow Creek in November 2005, and at Mossy Cave in July 2008. Data on core water-quality parameters, fecal coliforms, major ions, and nutrients are collected monthly. Trace elements (metals) are sampled quarterly.

Long-term water-quality monitoring stations at Bryce Canyon National Park.
Recent Results
A recent report examined water-quality trends for the park from 2006 to 2021, and compared concentrations to relevant water-quality standards for the State of Utah (see table below).
Key findings showed:
- Overall, water quality at the park’s monitoring stations continues to be excellent, and park managers have been successful in their goal of maintaining these systems in unimpaired condition. High-quality conditions may qualify all three sites as Category 1 waters, the highest level of anti-degradation protection provided by the State of Utah.
- Infrequent but continued Escherichia coli exceedances have coincided with the presence of trespass livestock at Sheep and Yellow creeks, supporting the need for regular fence maintenance along the park boundary.
- Minimum and maximum air temperatures at the park have increased, while precipitation remains highly variable. Increasing air temperatures have led to increasing water temperatures in Sheep and Yellow creeks.
- Sheep Creek had a decrease in flow across several periods from 2006 to 2021, while higher flows decreased at Yellow Creek in the same period. Surface flows in these two creeks are likely to be increasingly affected by higher evapotranspiration due to warming air temperatures and possibly decreasing snowmelt runoff as the climate changes.
- Despite increased visitation along Water Canyon and the Mossy Cave trail, we have not seen changes in water quality at Mossy Cave Spring.
There were additional statistical trends in water-quality parameters at all three sites. However, most of these trends were quite small and are likely ecologically negligible. Some statistical trends may be the result of instrument changes and improvements in quality assurance and quality control over time in both the field sampling effort and the laboratory analyses.
| Category | Parameter (unit) | Sheep Creek | Yellow Creek | Mossy Cave Spring | |||
|---|---|---|---|---|---|---|---|
| Trend1 | Standard exceedances2 | Trend1 | Standard exceedances2 | Trend1 | Standard exceedances2 | ||
| Core | Dissolved oxygen (mg/L) | none | 0–4% | none | 0–4% | ↑ | 0–4% |
| Core | Escherichia coli (MPN/100 mL) | none | 5–9% | none | 5–9% | C | 0–4% |
| Core | Flow (cfs) | ↓ | NS | none | NS | ↑ | NS |
| Core | pH | ↑ | 0–4% | ↑ | 0–4% | ↑ | 0–4% |
| Core | Specific conductance (µS/cm) | ↓ | NS | ↓ | NS | none | NS |
| Core | Turbidity (NTU) | ↓ | NS | ↓ | NS | none | NS |
| Core | Water temperature (°C) | ↑ | 0–4% | ↑ | 0–4% | none | 0–4% |
| Major ions | Alkalinity as CaCO3 (mg/L) | none | NS | ↓ | NS | ↓ | NS |
| Major ions | Calcium (d) (mg/L) | none | NS | none | NS | ↑ | NS |
| Major ions | Chloride (mg/L) | ↑ | NS | none | NS | ↑ | NS |
| Major ions | Magnesium (d) (mg/L) | ↓ | NS | ↓ | NS | none | NS |
| Major ions | Potassium (d) (mg/L) | ↑ | NS | ↓ | NS | ↑ | NS |
| Major ions | Sodium (d) (mg/L) | ↓ | NS | ↓ | NS | ↑ | NS |
| Major ions | Sulfate as SO4 (mg/L) | none | NS | ↓ | NS | C | NS |
| Major ions | Total dissolved solids (mg/L) | none | 0–4% | ↓ | 0–4% | none | 0–4% |
| Nutrients | Ammonia as N (mg/L) | C | 0–4% | C | 0–4% | C | 0–4% |
| Nutrients | Nitrite + Nitrate as N (d) (mg/L) | C | NS | C | NS | none | NS |
| Nutrients | Phosphorus as P (d) (mg/L) | none | NS | C | NS | C | NS |
| Nutrients | Phosphorus as P (mg/L) | ↓ | 0–4% | C | 0–4% | ↓ | 0–4% |
| Nutrients | Total Nitrogen (d) (mg/L) | C | NS | C | NS | none | NS |
| Trace elements | Aluminum (d) (µg/L) | C | 0–4% | C | 0–4% | C | 0–4% |
| Trace elements | Arsenic (d) (µg/L) | C | 0–4% | C | 0–4% | none | 0–4% |
| Trace elements | Barium (d) (µg/L) | C | NS | C | NS | none | NS |
| Trace elements | Boron (d) (µg/L) | none | 0–4% | none | 0–4% | none | 0–4% |
| Trace elements | Cadmium (d) (µg/L) | C | 0–4% | C | 0–4% | C | 0–4% |
| Trace elements | Chromium (d) (µg/L) | C | 0–4% | C | 0–4% | C | 0–4% |
| Trace elements | Copper (d) (µg/L) | C | 0–4% | C | 0–4% | C | 0–4% |
| Trace elements | Iron (d) (µg/L) | C | 0–4% | C | 0–4% | C | 0–4% |
| Trace elements | Lead (d) (µg/L) | C | 0–4% | C | 0–4% | C | 0–4% |
| Trace elements | Manganese (d) (µg/L) | C | NS | C | NS | C | NS |
| Trace elements | Mercury (d) (µg/L) | C | 0–4% | C | 0–4% | C | 0–4% |
| Trace elements | Nickel (d) (µg/L) | C | 0–4% | C | 0–4% | C | 0–4% |
| Trace elements | Silver (d) (µg/L) | C | 0–4% | C | 0–4% | C | 0–4% |
| Trace elements | Zinc (d) (µg/L) | C | 0–4% | C | 0–4% | C | 0–4% |
1C = >50% censored data (no analysis); ↑ = increasing trend (p <= 0.05); none = no trend (p >0.05); ↓ = decreasing trend (p <=0.05).
2NS = no standard. Colors also correspond to water-quality standards comparisons. NS is clear, 0–4% is green, 5–9% is yellow.
Management Recommendations
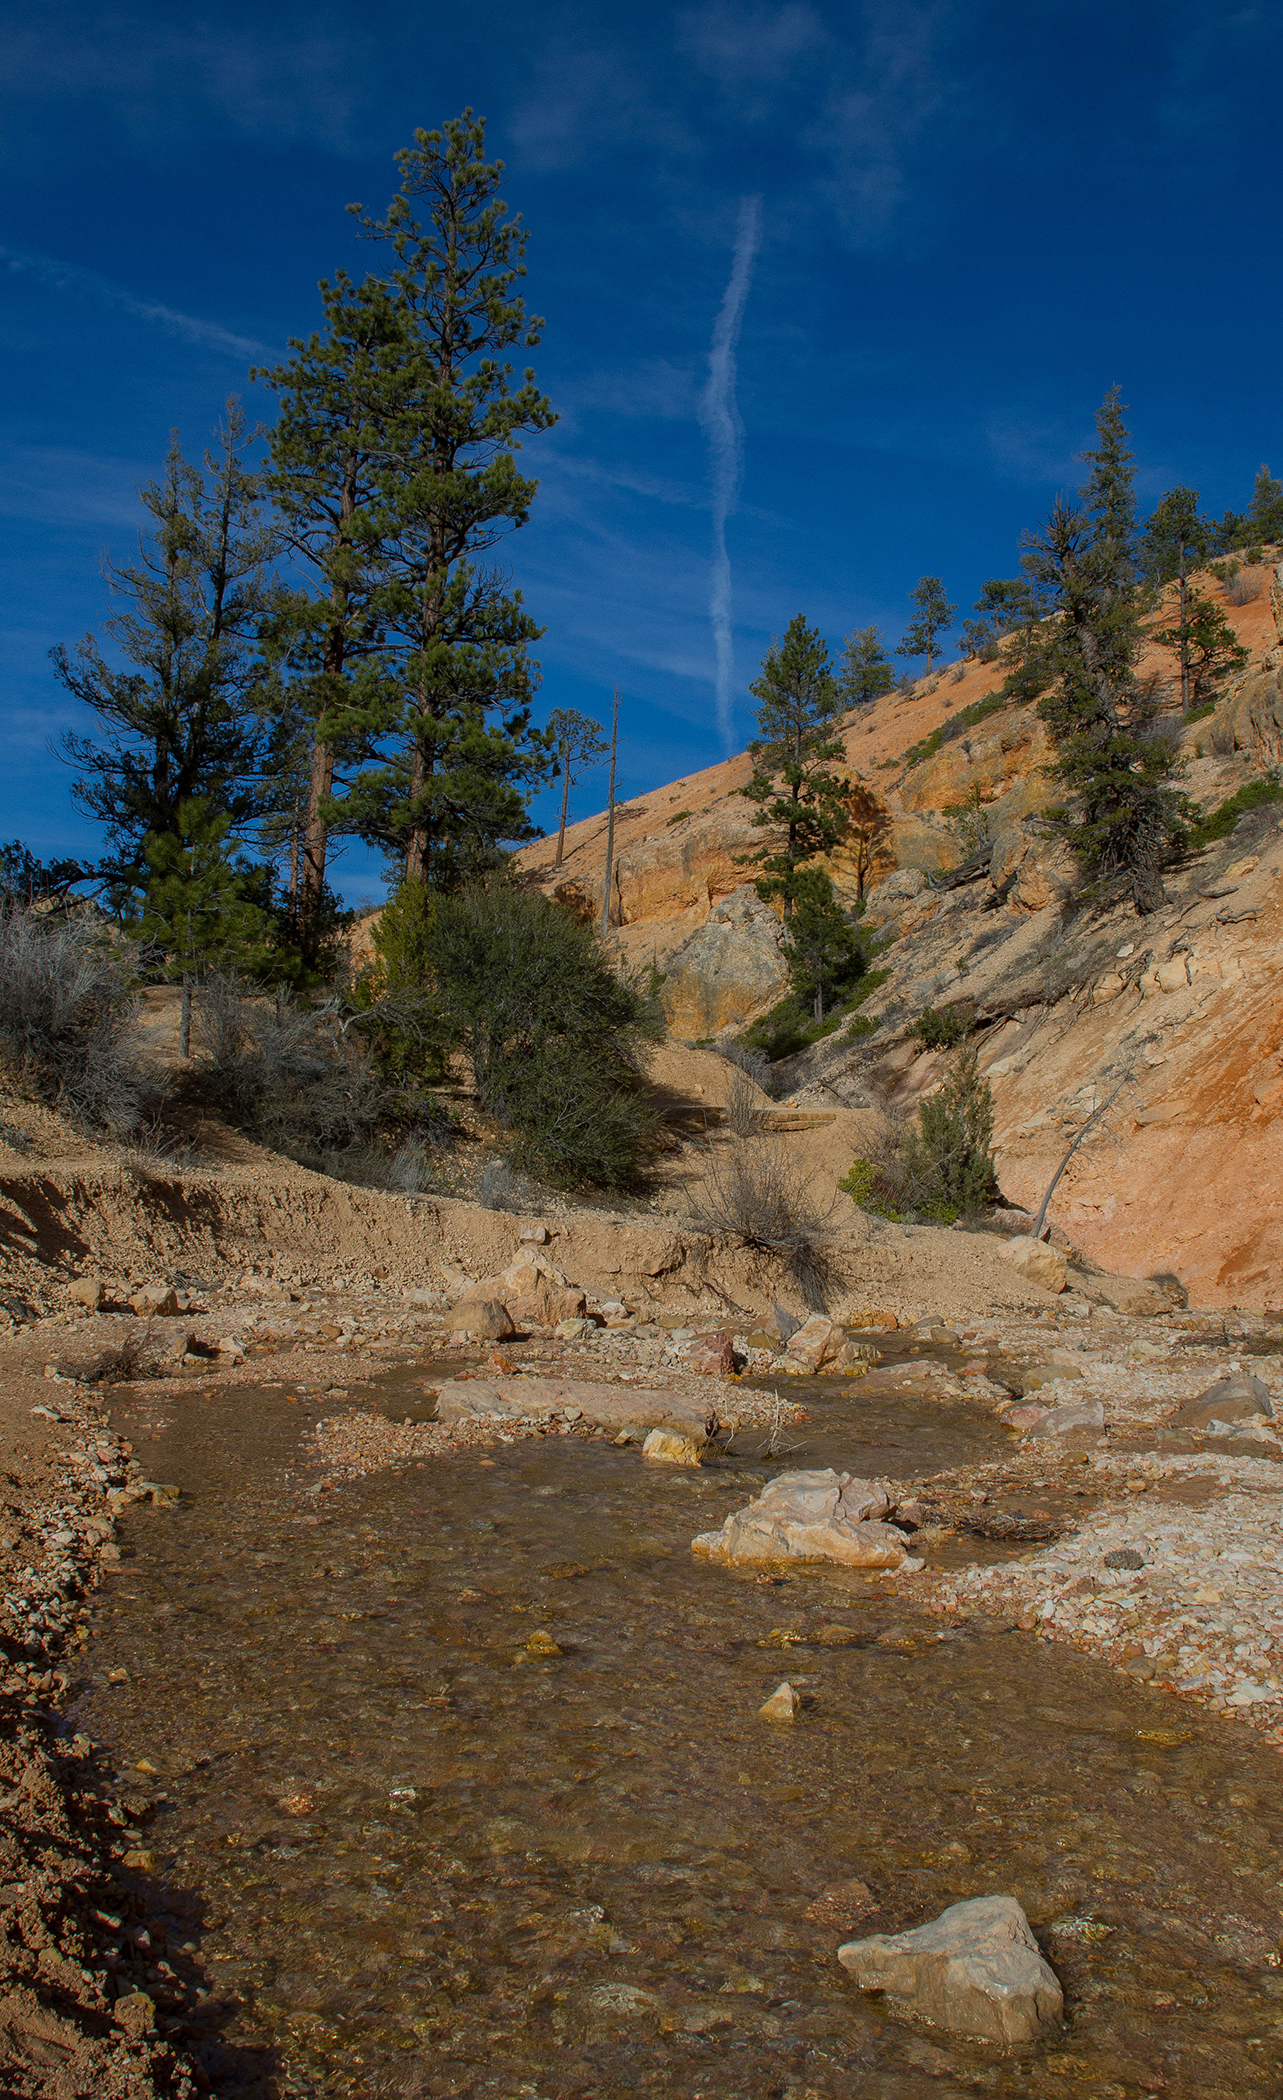
 Springflow and irrigation water run through Water Canyon at Bryce Canyon National Park.
In sum, long-term monitoring of water-quality stations at Bryce Canyon NP suggests relatively stable aquatic systems that benefit from protection within the park. To maintain these unimpaired conditions into the future, park managers could consider:
- Conducting regular fence checks and maintenance along active grazing allotments at the park boundary to protect riparian areas and aquatic systems from trespass livestock.
- Developing a springs-monitoring program to better understand changes in bedrock-aquifer water supplies. These data would also help quantify springflow for use in water-rights hearings.
- Supporting hydrogeologic investigations to map the extent and flow paths of groundwater aquifers.
- Working with the State of Utah to develop groundwater-protection zones to protect groundwater aquifers from developments that would affect springs in the park.
- Prioritizing watershed management with proactive fire risk-reduction practices.
- Explicitly including watershed protection as a goal in plans for fire management and suppression.
- Using additional data and analyses to better understand the drivers of trends in water quality and their ecological significance. These could include higher-frequency data to better understand relationships between groundwater, precipitation, and surface flows at the sites. These could also include watershed metrics, such as vegetation cover and site shading, or integrated aquatic metrics, such as aquatic-invertebrate sampling.
Information in this article was summarized from R. Weissinger, Trends in Water Quality at Bryce Canyon National Park, Water Years 2006–2021.
Print this brief
