Last updated: July 29, 2022
Article
Materials Characterization Utilizing Advanced Spectral Imaging
Institution/Organization
- Library of Congress
Grant Number:
- MT-2210-09-NC-0 IA-2210-10-0139
Principal Investigator:
- Dr. Fenella G. France
Project Team:
- Meghan Hill
- Dr. Bill Christens-Barry
Oct 10, 2011
Executive Summary
The use of noninvasive advanced imaging techniques addresses a critical need to support preservation at all levels – national, state and local. The grant supported the advancement of non-destructive analyses through the integration of aligned spectral techniques to develop a multi-functional system with enhanced capabilities for heritage science. The techniques better informed materials characterization to assess, monitor, evaluate and map the impact of historic and future treatments on cultural heritage objects while characterizing media, substrate and other components without sampling. Polarizing and 3D-florescence components were integrated with a proven hyperspectral imaging.
The polarizing light and 3D fluorescence equipment was purchased from MegaVision Inc and installed August 11th, 2010. Delays in acquiring the equipment led to the extension for the completion of the work for this grant through September 2011. Once the equipment was installed Preservation Research and Testing Division (PRTD) personnel began investigating the various applications for utilization of this equipment to expand the existing spectral imaging system. Working protocols were undertaken in conjunction with Dr. Bill Christens-Barry (Equipoise Imaging LLC) to assess the utilization of this equipment for capturing and characterizing ultra-violet (UV) fluorescence and integrating this new data with the existing captured spectral data set. This necessitated the development of an interim scientific reference sample collection to assist in materials characterization as the protocols were established.
The spectral imaging system located in PRTD’s SB27 laboratory in the Madison Building, previously configured and used to provide reflectance and transmission images and data, was augmented to allow the acquisition of fluorescence images. Use of narrow waveband emissions at short wavelengths (365 - 505 nm) together with red, green, and blue emission filters allowed fluorescence images to be acquired. Materials evaluated include: the “Ptolemy Map”; sample colorants related to those thought to be used in the Ptolemy Map; un-aged and aged recycled papers (Whatman); modern pastels with strong fluorescence emissions. Crossed and parallel polarizer configurations were used to collect polarization images of LC documents.
Significant fluorescence signals were generated from several of the materials in the Ptolemy Map by analysis using image processing tools provided with the instrument. Software further modules for fluorescence studies were added to the repertoire of analysis tools available in the laboratory. Procedures and protocols for conducting fluorescence studies were defined and developed. Polarization signals were largely absent in the DDI.
Seminar and training materials were developed as protocols were integrated for the system and materials characterization. A training session for 12 preservation professionals was undertaken in September 2011.
Introduction
The following tasks and goals were defined for this project:
- Develop and undertake imaging experiments to identify excitation wavelengths and emission filters for identifying and quantifying properties of specific materials
- Determine fluorescence imaging parameters for selected materials.
- Develop fluorescence imaging protocols for use in conjunction with reflectance imaging.
- Identify and develop user software for analysis of fluorescence images.
- Collect data for inclusion in database of scientific reference materials.
The spectral imaging system in PRTD has proven effective in numerous multispectral imaging studies of materials of importance to the LC. The performance of prior systems that led to its design are described in several published papers [refs. 1 and 2]. The central features of this system are based on the concept that collection of high spatial resolution images by a high performance monochrome camera are well matched to the provision of narrowband illumination in the ultraviolet (UV), visible (VIS), and infrared (IR) regions of the light spectrum. These images can be analyzed, following appropriate computer processing of their content, to disclose important characteristics of the materials of which they are composed, the condition of these materials, and processes ongoing or used in their preparation.
In order to extend the utility of the existing instrument, a filter wheel allowing images containing only those wavelengths matching the transmission characteristics of filters contained in the filter wheel has been added to the system. These modifications offer the possibility of capturing fluorescence and polarization images that augment the reflectance and transmission images collected during past studies. This will add valuable data to that already obtained, and allow the nature of materials present in important objects in the LC collections to be more fully identified and understood.
Methods and/or materials
Acquisition protocol
Before the collection of fluorescence emission images, standard sequences of images using illumination from light emitting diodes (LEDs) of a single wavelength were collected, without the use of emission filters. A typical sequence consists of 13 single wavelength images bilaterally illuminated and acquired in reflectance mode (i.e. with an illumination incidence angle of approximately 45º) and 4 images using unilateral illumination on raking mode (i.e. reflectance images with an incidence angle of approximately 75º). Individual fluorescence emission images were then recorded using a single LED wavelength to illuminate the object. For each LED illumination, one of the red, green, or blue filters in the filter wheel was positioned in the light path between the object being image and the camera lens, so that the recorded image was formed only by light that was transmitted through the filter. Table 1 lists each combination of excitation source and emission filter used to acquire images in this study, together with the exposure durations used for each such combination.
| Excitation LED | Peak wavelength | Emission filter | Wratten # | Exposure (sec.) |
|---|---|---|---|---|
| UV | 365 nm | Red | #25 | 30 |
| UV | 365 nm | Green | #61 | 15 |
| UV | 365 nm | Blue | #47 | 5 |
| Royal Blue | 450 nm | Red | #25 | 15 |
| Royal Blue | 450 nm | Green | #61 | 15 |
| Royal Blue | 450 nm | Blue | #47 | 1.6 |
| Cyan | 505 nm | Red | #25 | 15 |
| Cyan | 505 nm | Green | #61 | 4.5 |
| Green | 535 nm | Red | #25 | 15 |
| Green | 535 nm | Green | #61 | 3 |
Only filters with a central transmission greater than that of the excitation source were used. This criterion derives from a physical principle of fluorescence, in which the emission wavelength is greater than the excitation wavelength (refs.1 -3 explain physics of the fluorescence process).The exposure duration was adjusted by inspection of histograms obtained from preliminary images used to determine optimal imaging conditions. Exposures were then increased to yield histograms that filled the dynamic range of the camera system to the extent possible. In the majority of cases, exposure durations were limited to 10 seconds, due to the desire to limit the total illumination to levels considered optimal for imaging actual materials in the Library’s collection.
The illumination wavebands, emission filters used with each illumination, and exposure durations used as part of the fluorescence image acquisition protocol as entered into the PhotoShoot acquisition software are shown in Table 1. This set of acquisition parameters, known as an “N-shot table”, is permanently stored on the spectral imaging workstation and may be loaded and used as a standard protocol for future fluorescence image acquisition. Alternatively, they may be modified in order to meet the demands of imaging fluorescence from materials, based on their composition, or to meet performance requirements.
For the majority of materials assessed in this study, this exposure limitation resulted in images in which the histograms were far from full, due to the low fluorescence intensities they exhibited. As noted in the Results and Conclusions sections of this report, changes in filter properties and changes in the placement of illuminators that result in increased illumination levels may motivate changes to exposure parameter values used during image acquisition.
For each sequence of images (reflectance and fluorescence), images of a white reference sheet were collected at each wavelength. These images were subsequently used during “flattening” in order to correct for spatially varying illumination levels.
Preprocessing
The workstation’s PhotoShoot software was used to perform a succession of preprocessing operations employed to: (i) correct for dark noise arising in the camera in the absence of light signal; (ii) ensure that spatially varying illumination intensity was adjusted via “flattening”; (iii) convert files from raw digital negative (DNG) format to conventional TIFF format.
Processing and analysis
Special processing modules were developed for use in the “ImageJ” open source software package [ref. 7]. ImageJ was also used for additional preprocessing of image sequences from each material that allowed quantitative calculations on images that were converted with a linear gamma and zero offset. Preprocessed images were additionally organized into single TIFF format files that facilitate display and further analysis using common image manipulation software. Storage of images in this standard form allows many of ImageJ’s extensible processing tools (known as “plugins”) to be used for further processing.
Initial analysis consisted of visual inspection of individual fluorescence images to determine if significant fluorescence was evident in any regions of the imagery. For images evidencing a significant fluorescence signal, quantitative image comparisons between reflectance-mode images and fluorescence images were then applied in order to characterize the extent of fluorescence signal, relative to the reflected component. Where notable fluorescence occurred, results from these measurements were compiled in a summary Excel spreadsheet.
Results and Discussion
Various materials were analyzed as outlined below.
Unaged and aged Whatman papers
The moderate level of fluorescence of the paper itself, together with the unknown density of the candidate and reference samples themselves, constituted an underdetermined problem that prevented mathematical analysis of the separate contributions of paper and potential sample fluorescence signals.
Herblock pigments
Fluorescence signal exceeding the amount that could be predicted by transmission of reflected light at the illumination wavelength through any of the filters was not observed.
Ptolemy Map
Imaging of the Ptolemy Map yielded substantial differences between reflectance and fluorescence images in several regions. Several regions of ƒ96R exhibiting strong fluorescence are illustrated in Figures 6 – 9; these notable regions and analyses of them are described further here. These analyses share a mathematical basis with the fluorescence correction described [ref. 6]. The central concept of the analyses is that knowledge of the reflectance of a material, determined by examination of the reflectance mode images at particular wavelength, can be used to determine how much of the signal in a fluorescence image acquired at the same wavelength arises due to the fluorescence process and how much of this signal is due to “leakage” of reflected light through the filter employed during capture of the fluorescence image. By accounting for the intensity of the illuminant used during reflectance and fluorescence image capture, the fraction of light in the fluorescence image due to each process can be quantitatively determined.
Figure 1 depicts the transmission spectra of the Red, Green, and Blue emission filters employed during fluorescence imaging. These spectra were obtained using an Ocean Optics USB-2000 fiber spectrometer that is capable of measuring transmission in the 350 – 1000 nm region. Each filter has a large peak in a particular region of the visible spectrum (corresponding to the names of the filters); these peaks indicate the wavelengths that are transmitted strongly by each filter. Other wavelengths in the visible region are attenuated more greatly. It should also be noted that the apparent transmission of light by these filters at wavelengths below approximately 400 nm is likely an artifact of the fiber optic spectrometer; manufacturer’s data shows only negligible transmission of light by these filters in this region. For purposes of calculation, transmission of light by these filters was treated as nonexistent in this region.
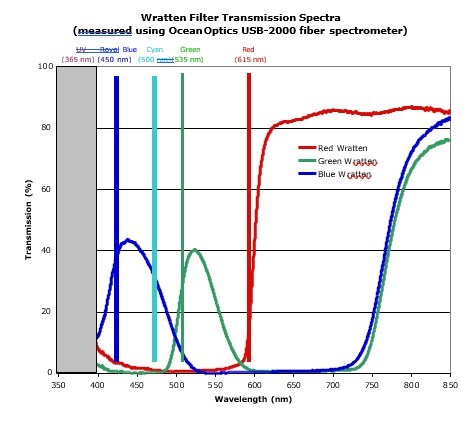
Figure 1. Wratten filter transmission spectra. Spectra were acquired using an Ocean Optics USB-2000 fiber spectrometer, using a broadband incandescent light source. Note that at wavelengths below approximately 400 nm (grey box), the transmission of light is greatly exaggerated in the figure due to the low intensity of short wavelengths in the light source; actual filter transmission in this region is negligible. Vertical dashed lines indicate approximate peak wavelengths of light emitted by LEDs used in this study.
The use of a particular filter ensures that the monochrome image captured by the camera sensor is due only to wavelengths in the filter “passband”. In general, greater distance between the centers of the source illuminant and filter passbands results in greater reduction of leakage. It should be noted that all of the filters are highly transmissive in the near infrared spectral region, i.e. at longer wavelengths than are visible to the human observer. Because no additional filter is employed to prevent near infrared wavelengths from reaching the camera, fluorescent emission in the near infrared are treated as though arising within the principal passband of the filter used during capture.
For reference, Figure 1 also indicates the central wavelength (vertical dashed lines) of each of the LED types used to excite fluorescence emission.
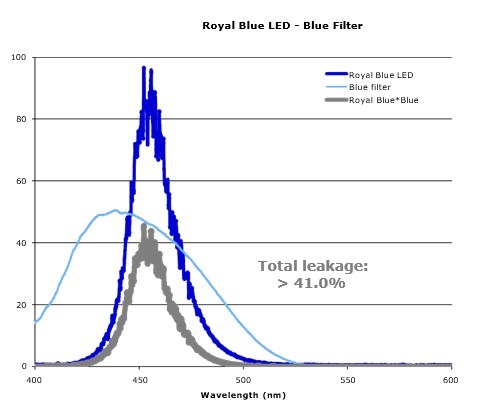
Figures 2 – 5 show the filter transmission spectra in greater detail. These figures also depict the spectra of the LED illumination and the “leakage” of light in the illumination wavebands through the emission filter for several illuminant-filter combinations. This leakage is calculated as the product of the LED illuminant at a particular wavelength and the transmission of light by the filter at that wavelength. In Figure 2, the large overlap between the Royal Blue LED wavelength and the transmission pass band of the Blue filter leads to a large amount of leakage of the light from the LED through this filter. If not accounted for during quantitative analysis, this light (at the LED wavelength) could be misconstrued as resulting from fluorescent emission in the passband of the filter. For this illuminant-filter combination, as much as 41.0% of the light from the LED source is transmitted by the filter.
As seen in Figure 3, modest overlap between the Royal Blue LED source and the transmission band of the Red filter leads to only a low level (~ 1.0%) of leakage of the illumination waveband through this filter. Similarly, the separation between the illumination waveband of the Royal Blue LEDs and Red filter of Figure 4 result in low leakage (< 1%) for this pair.
In Figure 5, the separation between the wavebands of the Cyan illuminant (centered at 505 nm) and the Green filter (centered at approximately 525 nm) results in significant leakage (> 16%). In the absence of very high levels of fluorescence in the green region of the spectrum, it would be quantitatively difficult to discriminate leakage of reflected light (at 505 nm) from true fluorescent emission with the Green filter passband.
Figure 6 plots transmission curves for the Green LED – Red filter combination. Here, a modest level (~ 2%) occurs.


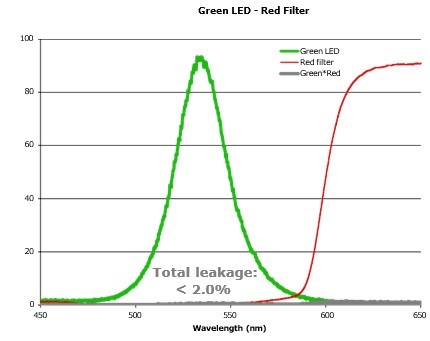
Quantitative measurement of fluorescence in the Green LED – Red filter combination in regions of ƒ96R of the Ptolemy Map
Figures 7 – 9 illustrate regions and results that obtain from a detailed analysis of illuminant reflectance and fluorescence emission from a region of the Ptolemy Map (ƒ96R) that evidenced a high level of fluorescence emission in the red region of the visible spectrum.
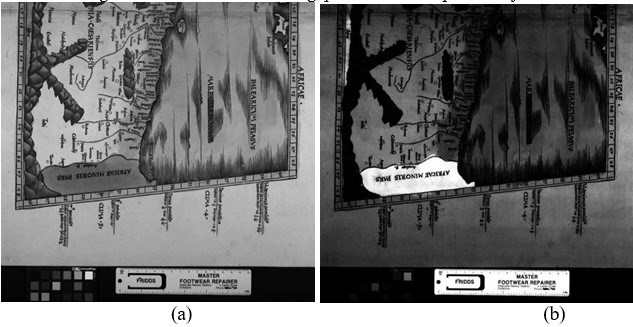
A region labeled “Africae Minoris Pars” of the map shows dramatic differences between the reflectance and fluorescence images (a and b, respectively). The bright square in the lower left of each panel (to the left of the plastic ruler) is from a swatch of the ColorChecker reference card; this swatch is known to be non-fluorescent. Its brightness in each panel is proportional to the leakage of the incident green illumination through the Red filter. While the fluorescence image of panel b was obtained using an exposure duration of 18.75 times that used to acquire the reflectance image in panel a (30 sec. versus 1.6 sec., respectively), the swatch in panel a has a higher intensity than that in panel b. In contrast, the “Africae Minoris Pars” region in panel b is more intense than in panel a; this is a result of the intense fluorescence of the pigmentation of this region.
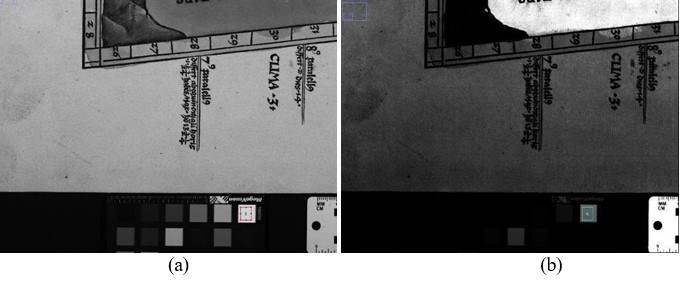
Figure 8. Images of ColorChecker white swatch region, obtained using green LED illumination (535 nm). (a) No filter, 1.6 sec. exposure duration; (b) Red filter, 30 sec. exposure duration. Both images are obtained using linear calibration, allowing quantitative comparison of intensities in the white swatch regions (lower right, with color outlines).
Figure 8 shows a region-of-interest in this swatch (indicated by a colored outline) that was used for quantitative measurement of the signal in this region. The ratio of: (reflectance image swatch mean intensity) / (fluorescence image swatch mean intensity) is equal to 1.94 (calculation not shown; data available in the “WS&_data.xls” spreadsheet). This ratio can be used to normalize the different image data resulting from the differing exposure durations used in the reflectance and fluorescence images.
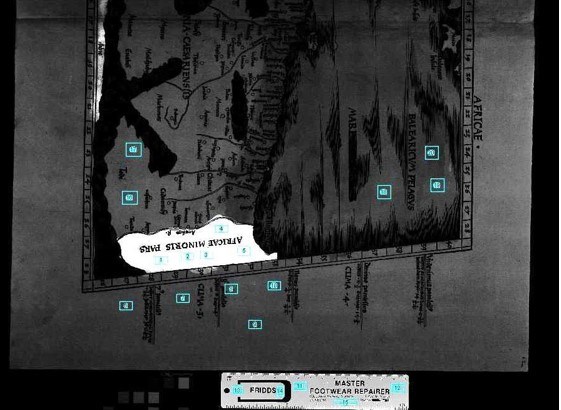
In contrast, values of the ratios: (fluorescence image swatch mean intensity) / (reflectance image swatch mean intensity) for the regions-of-interest shown in Figure 9 indicated that extensive fluorescence in the red region of the spectrum results from illumination of the pigments in this region by light in the green spectral region.
If it assumed that the leakage of Green LED illumination through the Red filter equals approximately 2% of the incident illumination, then the remaining signal measured for this region in the fluorescence image arises due to fluorescence. Factoring in the normalization provided by the white swatch measurements, the mean transmission of the Red filter (equal to 70.8% over an assumed fluorescence waveband of 600 – 630 nm), and the mean intensity ratio given for this region, the fluorescence to reflectance ratio is calculated as:(fluorescence signal) / (reflectance signal) = 1.94 x (2.90 – 1) / (2.90 * 0.98) = 1.30This indicates that the fluorescence contribution to the signal in this region is 30% greater than the reflectance contribution, a value considered very high.
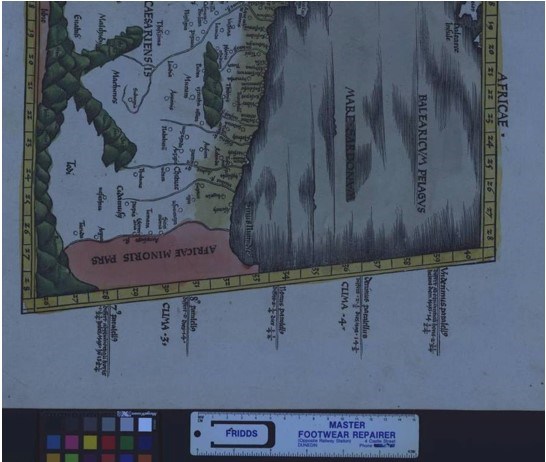
Figure 10. Simple RGB color composite image illustrating region of Ptolemy Map ƒ96R used to assess fluorescence. The red visual appearance in the “Africae Minoris Pars”, due in part to fluorescent conversion of green illumination to red emission. The nature of the fluorophore and pigment responsible for this conversion awaits identification.
The discovery of high levels of fluorescence in the Ptolemy Map is a strong demonstration of the value of performing fluorescence studies of suitable materials, especially those colored pigments and dyes, using the spectral imaging workstation. The surprising finding of high levels of fluorescence in the red region of the spectrum upon illumination with green light clearly indicate that protocols and filter properties that are geared more to fluorescence emission at longer wavelengths (including the infrared region of the spectrum) should be utilized. In particular, infrared emission filters should be included in future studies. Additionally, protocols employing longer excitation wavelength (including the output at 570 nm produced by Amber LEDs) should be used in conjunction with red and infrared emission filters.
The PRTD spectral imaging system can be used as currently configured for materials exhibiting strong fluorescence. It can also produce useful fluorescence data for materials exhibiting moderate fluorescence and that can tolerate higher levels of light exposure at excitation wavelengths.
Several modifications to procedures and system components are available for improving performance and for extending the range of materials from which fluorescence data can be obtained:
- Binning of pixels can be used to improve sensitivity, although at the expense of spatial resolution. This can be done during a first pass to identify the locations and emissions of fluorophores of interest. Once these materials have been located, images at full spatial resolution can be collected at these locations.
- Results from this study, in particular the Ptolemy Map work, indicate that fluorescence in the IR may occur. Data using IR emission filters should be collected to determine if IR fluorescence emissions occur for any materials of interest.
- Long pass edge filters can be used in the filter wheel in place of the initial set of emission filters. Short pass excitation filters may be a useful adjunct or alternative to long pass edge filters in order to reduce long wavelength tails of the LED excitation.
Conclusions
New developments in cultural heritage science take time for integration since the field is of necessity risk-adverse. New technology has generated the ability to advancenon-destructive analyses, with the most effective method for transfer of technology to integrate known and proven analytical techniques with advanced capabilities in the non-destructive testing arena. This integrated system balances the need for ensuring no damage to the object from the instrumentation, while advancing this preservation of the artifact with techniques that are known to characterize cultural heritage materials, by removing the need to take a sample from the object to an instrument.
Developing a system that combines three analytical techniques into one greatly reduces the impact on the object – reduced exposure to light and other environmental fluctuations.
The multifunction system combines the existing hyperspectral imaging with polarized light and fluorescence of materials. About 90% of all solid substances have optical properties that vary with the orientation of incident light. When these anisotropic materials are rotated, changes in brightness and / or color are observed that depend on the orientation of the material in the light path. Fluorescence of materials relates to their ability to absorb light at one wavelength and to re-emit it at longer wavelengths where light of a visible color is emitted from a substance under stimulation or excitation by light or other forms of electromagnetic radiation or by certain other means. Fluorescence of certain rocks and other substances had been observed for hundreds of years before its nature was understood. Later it was discovered that certain organic and inorganic substances can be made to fluoresce by activation not only with ultraviolet light but also with visible light, infrared radiation and some other excitants. The integrated system developed with this grant allowed characterization of materials and did not require samples to be taken for analysis.
Integrating these optical techniques enhanced the current imaging system, and advanced non-destructive capabilities for characterizing optical properties of materials, fully assimilating this information with other spectral information. Based on these studies, further filter bands are being investigated and will be added for enhanced materials characterization.
References
- Christens-Barry WA, Boydston K, France FG, Easton RL Jr, Knox KT, Toth MB, “Camera system for multispectral imaging of documents”, Sensors, Cameras, and Systems for Industrial/Scientific Applications X, Electronic Imaging 2009, Sensors, Cameras, and Systems for Industrial/Scientific Applications X, Sensors, Cameras, and Systems for Industrial/Scientific Applications X, 7249, San Jose, California, United States, January (2009).
- Easton RL Jr, Knox KT, Christens-Barry WA, Boydston K, Emery D, Noel W, “Standardized system for multispectral imaging of palimpsests”, Proceedings of the SPIE, Computer Vision and Image Analysis of Art, Computer Vision and Image Analysis of Art, Computer Vision and Image Analysis of Art, 7531, San Jose, California, United States, pp. 75310D-1-75310D-11 (2010).
- Abramowitz M and Davidson MW, “Introduction to Fluorescence,” http://www.olympusmicro.com/primer/lightandcolor/fluorointroduction.html (2011).
- Joseph R Lakowicz, “Principles of Fluorescence Spectroscopy”, Springer, 3rd ed. (2006).
- Moerner WE and Fromm DP, "Methods of single-molecule fluorescence spectroscopy and microscopy", Rev. Sci. Instr. 74:3597-3619 (2003).
- Christens-Barry WA, Boydston K, Easton RL Jr, “Evaluation and compensation of fluorescence for spectral imaging of art materials and historical documents”, Proc. SPIE 7528:75280M-1-75280M-8 (2010).
- Rasband, W.S., ImageJ, U. S. National Institutes of Health, Bethesda, Maryland, USA, http://imagej.nih.gov/ij/, (1997-2011).
- “Standard Test Method for Determination of Effect of Moist Heat (50 % Relative Humidity and 90°C) on Properties of Paper and Board”, ASTM D 4714 – 96 ( 2001)
- “Effect of moist heat on properties of paper and board”, TAPPI document T 544 sp-03 (2003).
- Christens-Barry, W., Boydston, K., France, F.G. Knox, K., Easton, R.L., and Toth, M.B., Camera system for multispectral imaging of documents, Digital Imaging Sensors and Applications, 21st Annual IS&T/SPIE Symposium on Electronic Imaging, San Jose CA, January (2009) 724908-1 - 724908-10.
- Emery, D, France, F.G., and Toth, M.B., “Management of Spectral Imaging Archives for Scientific Preservation Studies, Archiving 2009, Society for Imaging Science and Technology, May 4-7 (2009), 137-141.
- France, F.G., Emery, D., and Toth, M.B., "The Convergence of Information Technology, Data and Management in a Library Imaging Program", Library Quarterly special edition: Digital Convergence: Libraries, Archives, and Museums in the Information Age, in press (2009).
- France, F.G., Hansen, E.F. and Toth, M.B. “Creating a Composite Cultural Heritage Artifact – the Digital Object”, Digital Humanities 09, University of Maryland, June 23, 2009 113-115.
- France, F. G. Main Session Presentation: Integrating Advanced Imaging Technologies to Conservation: Challenges & Successes, AIC Annual Meeting, Los Angeles, May 22 (2009).
- Fenella G. France, Managing Digital Image Repositories as Key Tools in the Preservation of Cultural Objects, Imaging Science and Technology Conference, Arlington, VA, 2007.
- Fenella G. France, Scientific Analysis in the Identification of Textile Materials, AHRB Research July 2004.
- Fenella G. France Creating a Standard Vocabulary for Defining Levels of Deterioration, Development of a Web-Accessible Reference Library of Deteriorated Fibers, Shepherdstown, WV April, (2003) 77-86.
- Keith T. Knox, Roger L. Easton, Jr.: Recovery of lost writings on historical manuscripts with ultraviolet illumination. In: Fifth International Symposium on Multispectral Color Science (Part of PICS 2003 Conference), Rochester, NY, pp. 301–306 (2003)
- Michael B. Toth, "Management of Digital Archives for Integrated Web Access to Scientific and Cultural Information", Proceedings of the IS&T Archiving 2007 Conference, Arlington, Virginia, May 2007, pp. 175-178
- Michael B. Toth, Doug Emery, “The Archimedes Palimpsest Project: A Case Study in Applying Science to Cultural Objects”, Presentation to the NEH Office of Digital Humanities (Washington, DC, 2008).
- Gregory Young, “Quantitative Image Analysis in Microscopical Thermal Stability Measurements”, Canadian Conservation Institute Newsletter, 31, June 2003, pp.10- 11.
