Last updated: August 19, 2024
Article
Water Resources Monitoring in the Madison River near West Yellowstone, Montana, 2022
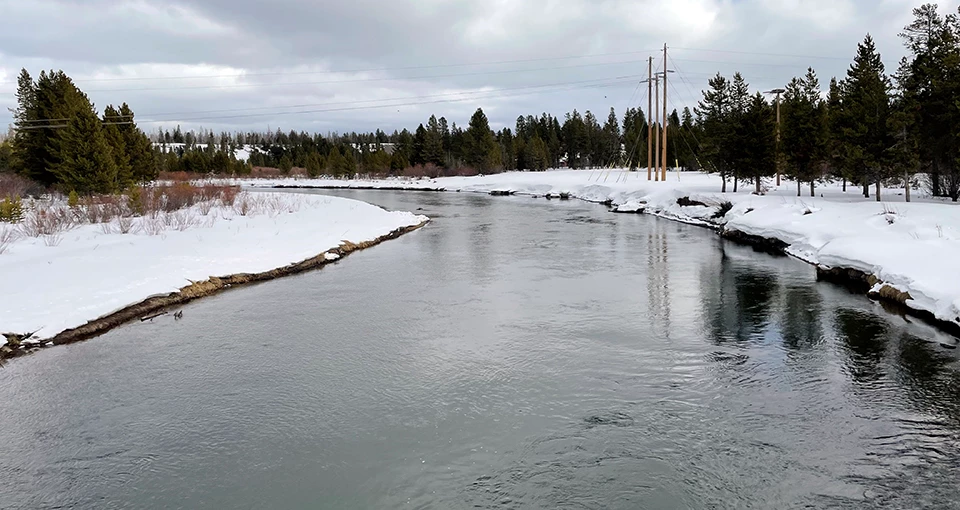
The Greater Yellowstone Inventory and Monitoring Network monitors water quality and analyzes river discharge (flow) in the Madison River each year. The Madison River has high water quality and is a popular recreation destination. The river begins in Yellowstone National Park and flows out of the park, joining with other rivers to become the Missouri River.
NPS
The Madison River Site
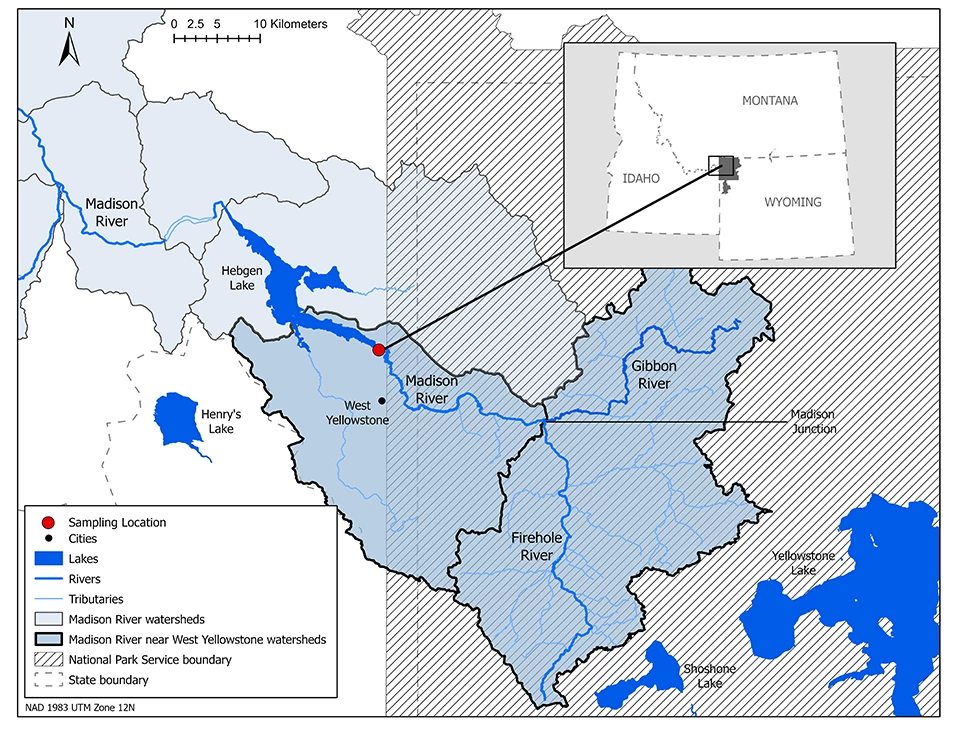
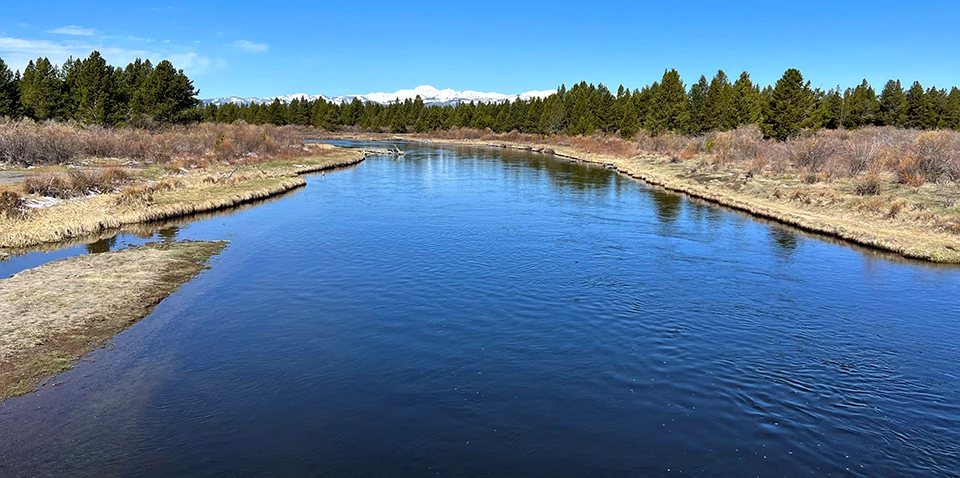
The Madison River, a tributary of the Missouri River, begins in Yellowstone National Park at the confluence of the Firehole and Gibbon rivers. This site is called Madison Junction. Both the Firehold and Gibbon rivers are thermally influenced by contributions from geothermal features. The Madison River travels 19 miles (31 km) through Yellowstone National Park before crossing the park boundary and flowing into Hebgen Lake towards Ennis, Montana. It continues northwest from there and meets the Jefferson and Gallatin rivers to form the Missouri River. The Madison River is a renowned recreation destination for fishing, birding, and wildlife viewing.
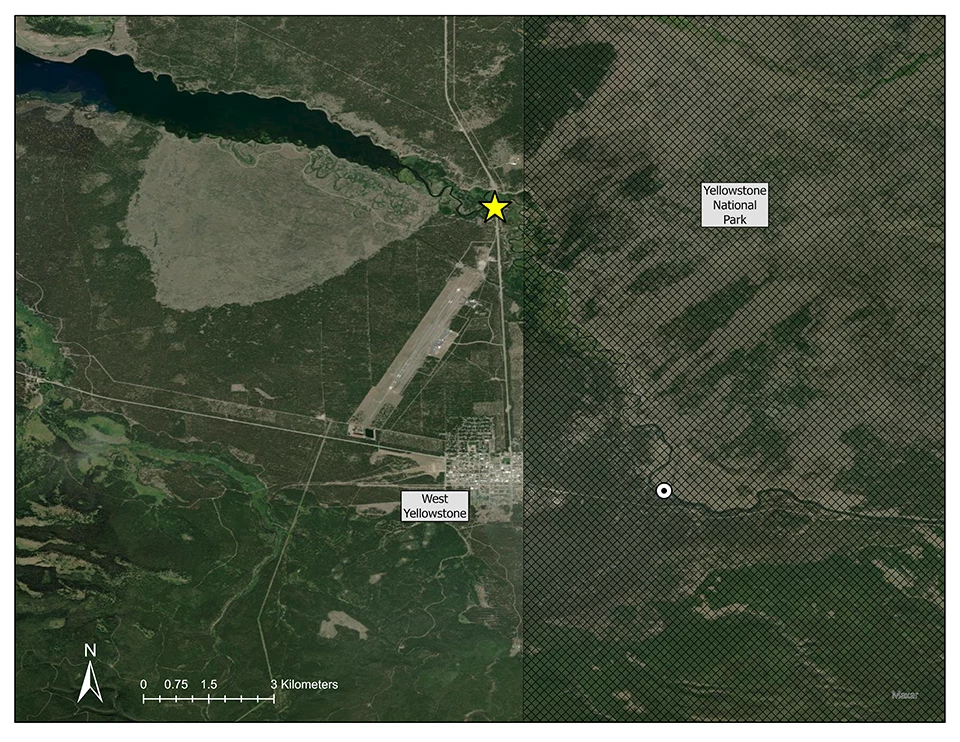
The Greater Yellowstone Inventory and Monitoring Network monitors water quality and discharge in the Madison River just outside the Yellowstone National Park boundary, 3.75 miles (6 km) north of West Yellowstone, MT, at a bridge crossing along Montana Highway 191 (Figure 1 and Figure 2).
NPS
NPS graphic on USDA base map
Water Flow in the Madison River
The U.S. Geological Survey operates a gaging station (USGS Gage 06037500) on the Madison River near West Yellowstone, MT. The gage is located 4.5 miles (7 km) upstream from the Montana Highway 191 bridge crossing where our sampling occurs. This station has daily flow data dating back to 1913. A portion of the discharge record spanning from 1975 through 1983 is missing. Daily water temperatures have been recorded since 2014.
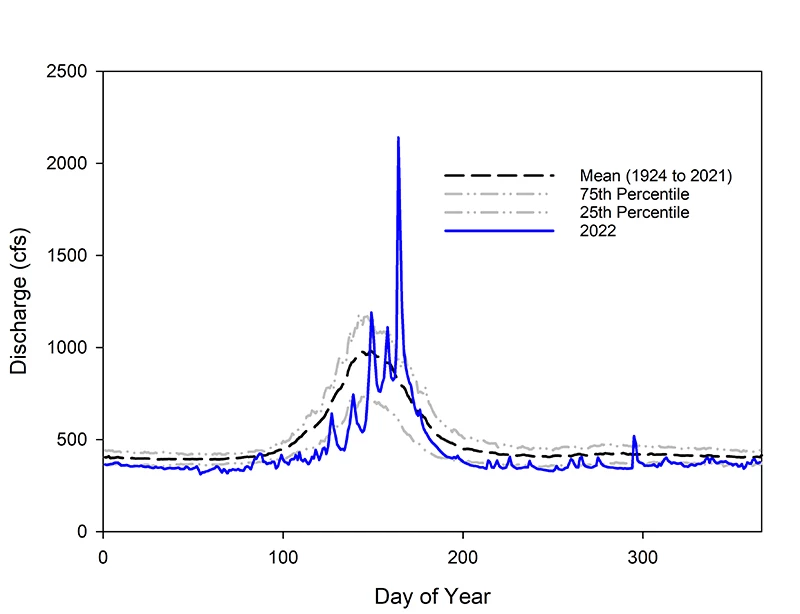
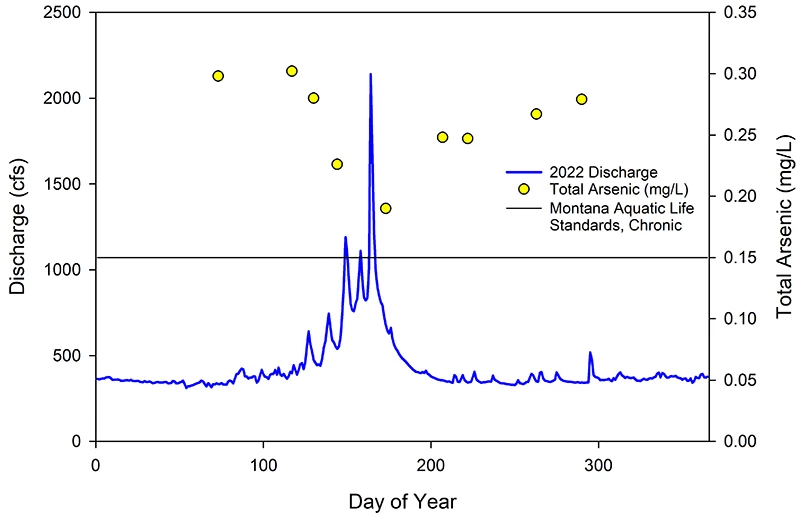
The hydrograph for the Madison River monitoring site is characteristic of a groundwater-fed system (Gardner et al. 2010). Despite experiencing the effects of the unprecedented flooding that occurred in the Park in June of 2022, average daily flows in the Madison River in 2022 (427 cubic feet per second [cfs]) were lower than the long-term (1924–2021) average flows (486 cfs) for the site (Figure 3). In 2022, daily flows dropped below the long-term average by the end of June (day 175 of the year). Peak flow was 2,140 cfs and occurred on 13 June (day 164 of the year), which was the date of the flood. Record peak flow at this site is 2,750 cfs occurring in 1996. The long-term average of annual peak flows between 1924 and 2021 is 1,306 cfs occurring on 24 May (day 144 of the year). Minimum annual daily flows over this same period of record averaged 335 cfs. Minimum annual daily flow in 2022 was recorded at 311 cfs.
NPS
Water Quality in the Madison River
The Madison River has high quality water that is influenced by local geology. Many of Yellowstone National Park’s geyser basins drain into the Firehole River, which joins the Gibbon River to form the Madison River. This natural geothermal activity can contribute to raised temperature, pH, and arsenic levels that exceed state water quality criteria (Thompson 1979).
We sampled the Madison River for water chemistry and core water quality parameters nine times from March to October in 2022. Core water quality parameters include temperature, specific conductance, dissolved oxygen, pH, and turbidity.
The river contained low levels of dissolved nutrients. On all sampling dates, ammonia as nitrogen (NH3 as N) was below detection levels (reporting limit is 0.05 mg/L). Nitrate + nitrite as nitrogen (NO3 + NO2 as N) levels measured between 0.01 and 0.04 mg/L when detected or were under the detection limit (reporting limit is 0.01 mg/L). Between March and October 2022, total suspended solid (TSS) levels in the Madison River ranged from 2 to 9 mg/L when detected or were under the detection limit (reporting limit is < 1 to < 2 mg/L).
Surface water from the Madison River near West Yellowstone, MT, exceeded the State of Montana’s chronic aquatic life criteria (0.15 mg/L) for total arsenic during all sampling events (Figure 4). Surface water and groundwater contributing to the Madison River inside the park boundary are influenced by geothermal features (NPS 1994). Accordingly, arsenic in the Madison River is likely naturally occurring from the geothermal geology in the watershed.
NPS
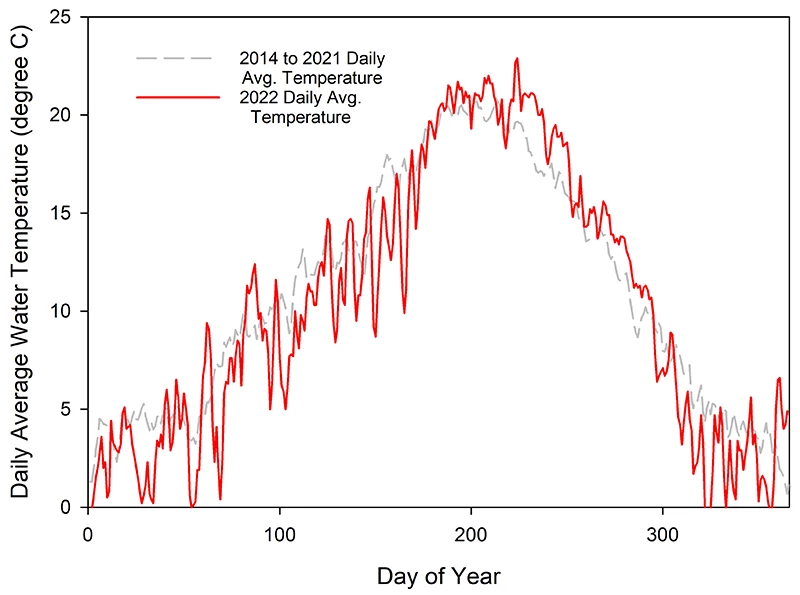
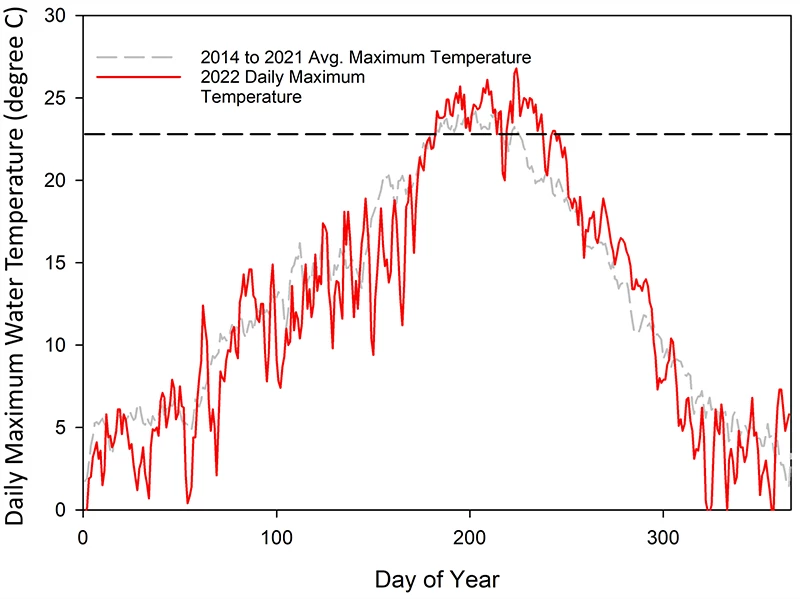
Water temperature is monitored continuously by the USGS at the Madison River near West Yellowstone, MT, station (USGS Gage 06037500). Average daily water temperatures in 2022 were higher than average daily water temperatures from the period of record (2014–2021), and warmer temperatures occurred earlier than average (Figure 5). In 2022, daily maximum water temperatures were above the daily maximum water temperatures from the period of record (2014 to 2021; Figure 6). The daily maximum water temperature reached in 2022 was 26.8°C (80.2°F). The average daily maximum water temperature from 2014 to 2021 was 25.9°C (78.6°F).
Montana Fish, Wildlife and Parks regulates cold water fishing closures when water temperatures exceed 73.0°F (22.8°C) at any time of the day for three consecutive days (Montana Rule 12.5.507). In 2022, temperatures first exceeded 22.8°C on 2 July (day 183 of the year). Temperatures were sustained above this threshold for at least three days in a row beginning on this date and continuing through the end of August. Geothermal activity from Yellowstone National Park's geyser basins, which drain into Madison River headwaters, contributes to raised temperature levels above the state water quality criteria (Thompson 1979).
NPS
NPS
2022 Water Quality Results
Table 1 shows water quality lab results and Table 2 shows water quality field results for the Madison River near West Yellowstone, MT, in calendar year 2022. All Data for current and previous years can be accessed in the NPS Data Store. Data can also be downloaded from the Water Quality Portal using "11NPSWRD_WQX-YELL_MDR" as the SiteID in the "Advanced" menu.
| Water Quality Lab Parameters | 14 March Reg | 27 April Reg | 11 May Reg | 24 May Reg | 22 June Reg | 26 July Reg | 26 July Rep | 10 August Reg | 20 September Reg | 17 October Reg |
|---|
| Core Water Quality Field Parameters | 14 March | 27 April | 11 May | 24 May | 22 June | 26 July | 10 August | 20 September | 17 October |
|---|
NPS
Monitoring Methods
Water Chemistry
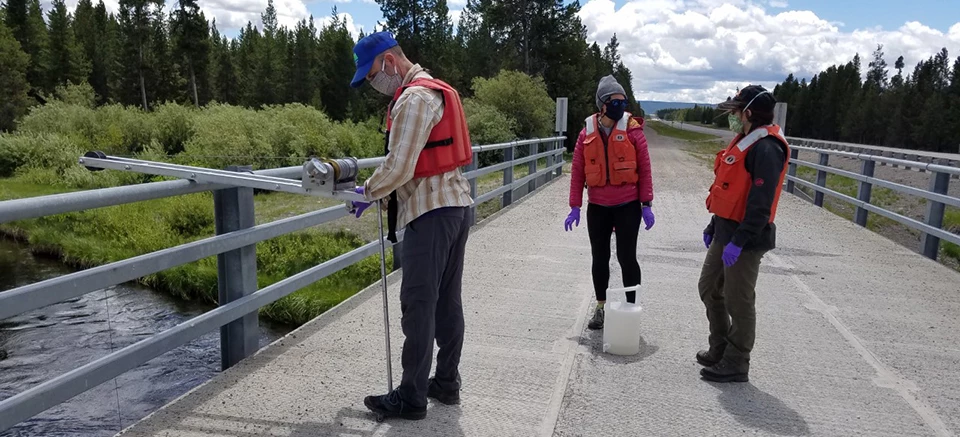
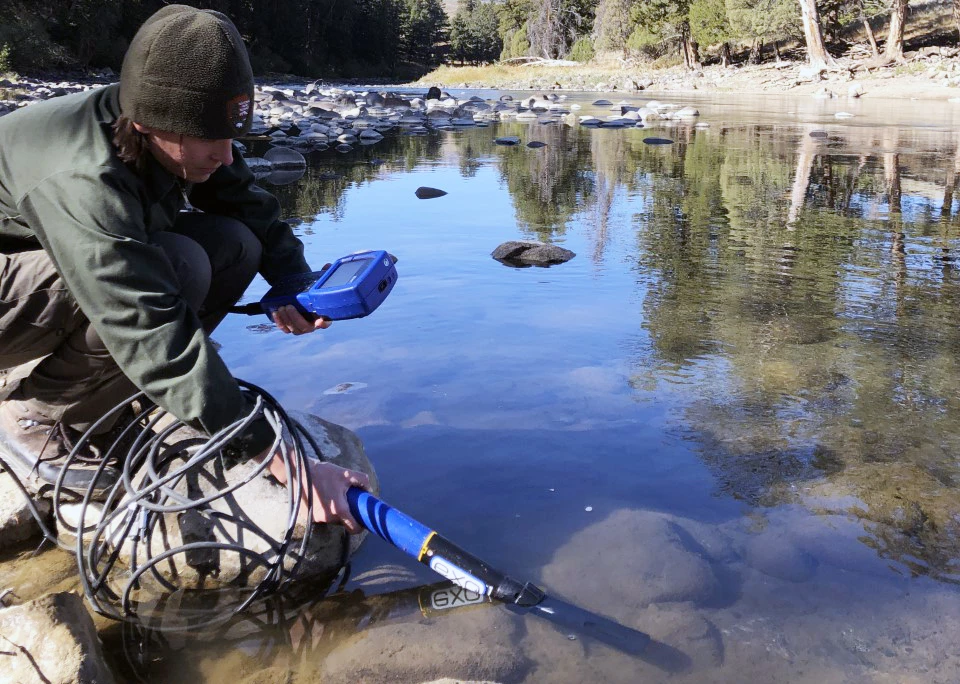
The Greater Yellowstone Inventory and Monitoring Network collects water samples monthly during ice-free periods generally following depth and width-integrated protocols outlined in the U.S. Geological Survey (USGS) National Field Manual for the Collection of Water-Quality Data.
In wadeable depths, we use a 1 L, hand-held DH-81 sampler affixed to a 1 m wading rod to collect depth and width-integrated water samples. During non-wadeable flows, samples are collected from a bridge using a bridge-board or crane, reel, and DH-95 suspension sampler. At multiple locations along a cross-section of the river, we collect water using vertically integrated sampling techniques. Samples from the 1 L bottle are mixed into an 8 L churn splitter; we use the churn splitter to homogenize and dispense a representative subsample into laboratory-provided bottles. These bottles are then shipped overnight to an EPA-certified commercial lab for processing.
NPS
Core Water Quality Parameters
In addition to water samples, water quality parameters (temperature, specific conductance, dissolved oxygen, pH, and turbidity) are collected in situ using a handheld, multi-parameter instrument (e.g., YSI EXO 1 sonde) at four representative locations on the river cross section. Collection of water sample core parameters and rationale for testing nutrients and suspended solids are described in the approved Greater Yellowstone Network Regulatory Water Quality Monitoring Protocol (O'Ney 2006).
River Discharge
Discharge (river flow estimates) and water temperature data from the Madison River sampling location are available online from the U.S. Geological Survey's National Water Information System and listed under station USGS 06037500. The station is located east of West Yellowstone, MT.
Greater Yellowstone Network Water Resources Protocols
Read the full protocols and standard operating procedures for water quality and discharge here.Source: NPS DataStore Collection 7853. To search for additional information, visit the NPS DataStore.
NPS
Water Quality Criteria for the Madison River
Under the Clean Water Act, the surface waters in Yellowstone National Park are classified as Outstanding National Resource Waters. Under the Montana Water Classification System, these waters, located wholly within national park boundaries, are designated as A-1, or Outstanding Resource Waters in Montana (Administrative Rules of Montana 17.30.617). Exiting the park near West Yellowstone, MT, the Madison River has been classified as B-1. Water bodies classified as B-1 are suitable for drinking (after conventional treatment); full contact recreation; growth and propagation of salmonid fishes and associated aquatic life, waterfowl, and furbearers; and agricultural and industrial water supply.
Madison River water quality monitoring results are compared to the following federal and state water quality standards as well as the watershed specific total maximum daily load (TMDL) and water quality improvement plan:
EPA National Recommended Water Quality Criteria
Environmental Protection Agency (EPA). 1987. Quality criteria for water 1986 [The Gold Book]. EPA440/5-86-001. U.S. EPA, Office of Water Regulations and Standards, Washington D.C.
Montana Numeric Water Quality Standards – MT DEQ Circular DEQ-7
Montana Department of Environmental Quality. Final 2020 Water Quality Integrated Report
Administrative Rules of the State of Montana 17.30.617
Madison Nutrient, E. coli, and Metal TMDLs and Water Quality Improvement Plan
Montana Rule 12.5.507 Angling Restriction and Fishing Closure Criteria
