Part of a series of articles titled The Midden - Great Basin National Park: Vol. 21, No. 2, Winter 2021.
Article
Lehman Caves Temp and Humidity before, during, and after Closure
This article was originally published in The Midden – Great Basin National Park: Vol. 21, No. 2, Winter 2021.
By Gretchen Baker, Ecologist
Lehman Caves was closed to the public for 427 days due to COVID, from March 19, 2020 to May 22, 2021. This may have been the longest closure since the cave was opened for tours since 1885. (In 1944, during World War II, there were only 872 visitors for the year, so the cave was likely closed for a few months.)
Lehman Caves was closed to the public for 427 days due to COVID, from March 19, 2020 to May 22, 2021. This may have been the longest closure since the cave was opened for tours since 1885. (In 1944, during World War II, there were only 872 visitors for the year, so the cave was likely closed for a few months.)

NPS Photo by Gretchen Baker
Temperature and humidity dataloggers were installed in several locations in the cave in the summer of 2019 as part of the cave lighting project. They recorded hourly temperature and relative humidity data.
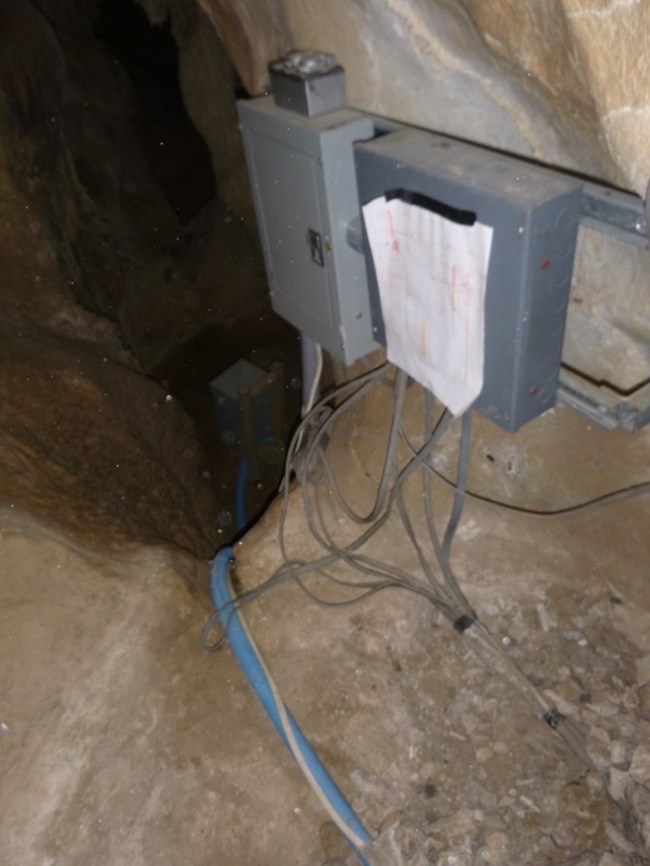
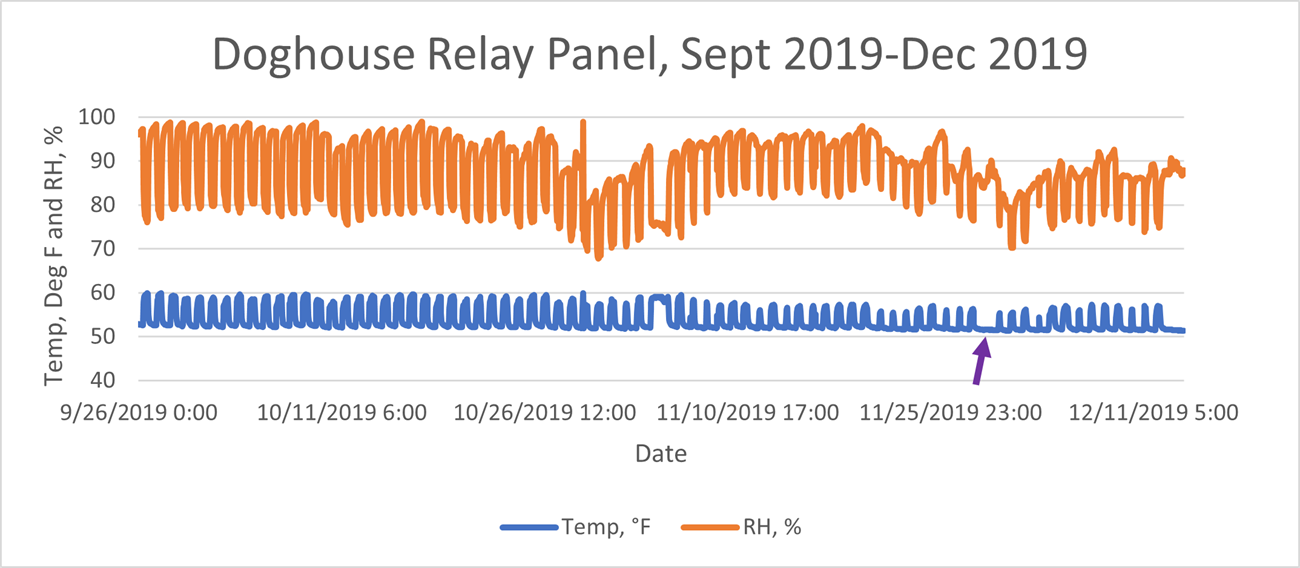
During normal operations (pre-closure), the data showed daily fluctuations (Figure 2). The temperature next to the Doghouse relay station goes from about 52°F to 60°F every day. Humidity drops from near 100% to less than 80% (and sometimes less than 70%) every day. Why? When the electricity to the cave is turned on, it goes to a main transformer at the Giant’s Ear and then goes to four relay panels. A small heater is installed in each relay panel 8 The Midden to help keep the electronics in it dry. So heat is being added to the cave not only due to lightbulbs and human bodies, but also due to these heaters.

One last thing to point out on this graph. What happened at the red arrow? The temperature stays high and the humidity low. If you guess that the lights were left on over night, you are correct. It has a big impact on the cave. What about at the purple arrow, where temperature stays low and humidity high? That’s Thanksgiving, one of the three days of the year that the cave is normally closed.
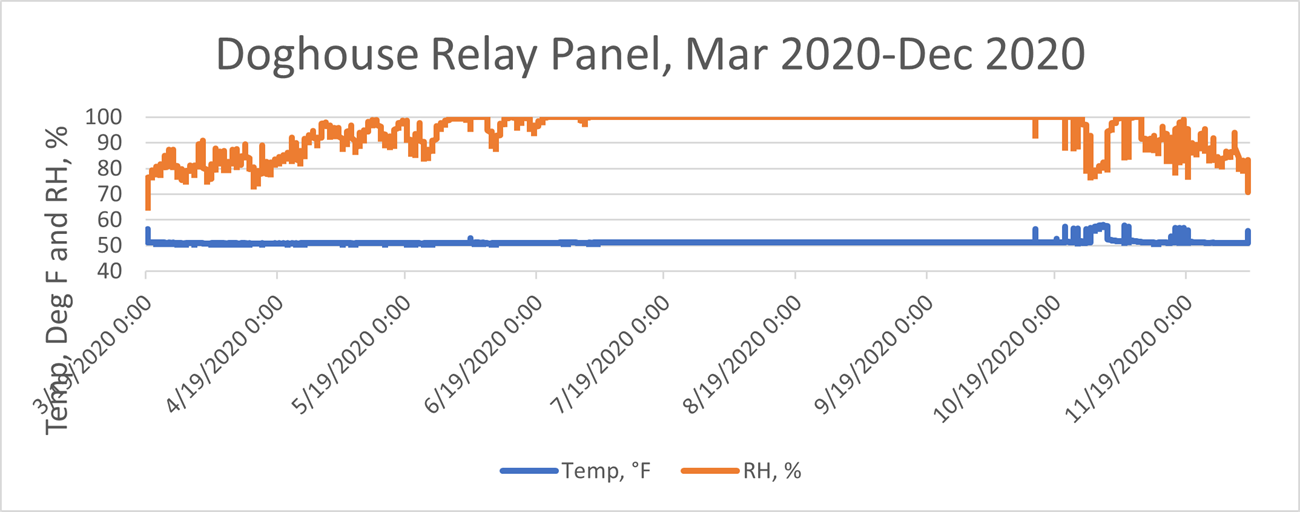
Let’s move now to 2020, when the cave closed. We’re going to specifically look at March through December (Figure 3). First, check out the blue line, the temperature. It stays nice and flat for most of the time period. The relative humidity, the orange line, stays at 100% for a few months. The little blips you see on the right are when the lights were turned on to do cultural resource surveys and quarterly biomonitoring. The stretch from March to October with the lights out provided time for the cave to settle into what we might call its baseline, where it’s not being impacted from tours or infrastructure.


Reducing these temperature and humidity fluxes is one of the goals of the new cave lighting system. Hopefully we can help restore a more natural cave climate by having the lights on less (only when we need them) and by eliminating extra heaters in the cave by using newer technology.
Last updated: February 6, 2024
