Last updated: April 7, 2025
Article
Laser Scanning in Carlsbad Caverns
National Center for Preservation Technology and Training
This presentation, transcript, and video are of the Texas Cultural Landscape Symposium, February 23-26, 2020, in Waco, TX.
National Park Service
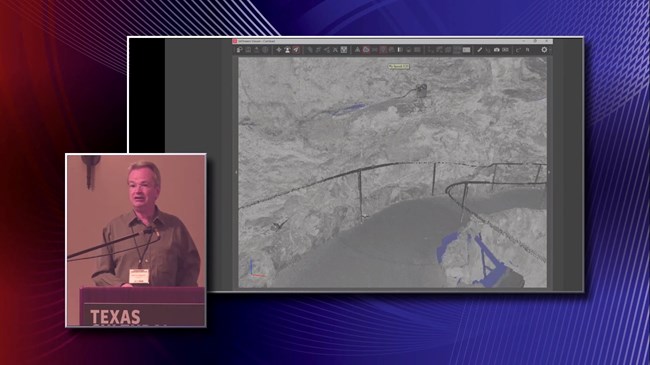
Malcolm Williamson: I'm a long-term DEER spacial researcher at the Center for Advanced Spatial Technologies (CAST) at the University of Arkansas. I'm going to be talking about the digital 3D documentation of the portions of Carlsbad Caverns National Park that had the highest degree of cultural contact. My initial walk through of the cave several months prior to the actual work, my repeated comment was, "This is really big." This rather apparent observation did drive quite a few of the decisions we had to make doing this project.
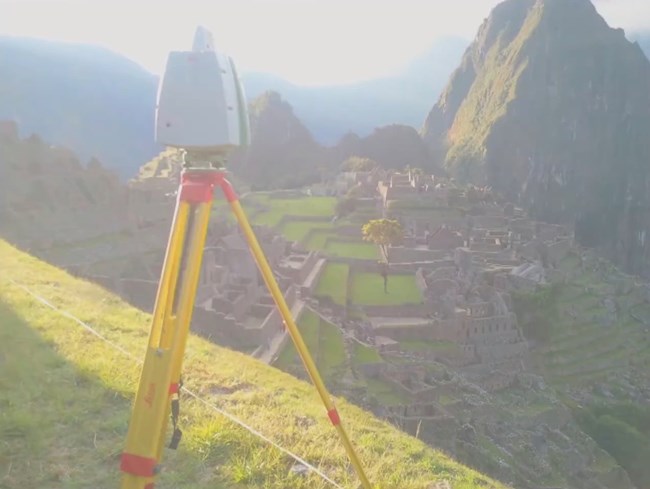
So, to our benefit CAST has applied terrestrial laser scanning, TLS, to a variety of the landscapes around the world, including well-known sites such as Petra in Jordan, Machu Picchu in Peru. More recently we'd gained experience underground while scanning Blanchard Springs Caverns in North Central Arkansas. That project also focused on cultural infrastructure as the USDA forest service was considering some long overdue improvements to the site.
These experiences led to a set of skills and understanding that are vital to maximizing efficiency while collecting data in the field. Also critical is an ongoing review of the data as it is collected. While invaluable to planning, the sequence of collecting, processing and reviewing the data in the field also guarantees long work days.
Malcolm Williamson, University of Arkansas
The instrument used for this project was a Leica Geosystems ScanStation P40, which though not a new release, still represents the state of the art in terms of accuracy and speed. When purchased, its price was $123,000, not including the cost of software and maintenance. For that price, you get single-point 3D accuracy of three millimeters at 50 meters and six millimeters at 100 meters. A measurement rate of 1 million points per second at up to 120 meters and 500,000 points per second at up to 270 meters. And it's got a dual access liquid level compensator that maintains levelness within one and a half seconds of angle.
The P40 is a time of flight laser scanner, enhanced by wave form digitizing technology. A pulse of laser lights emitted from the sensor reflected in part or in whole from the surface that it strikes and then it returns to the sensor. The way form digitizing technology is used to more intelligently interpret what happens when a pulse strikes multiple surfaces at varying distances resulting in partial returns. In order to achieve the speed and accuracy at these distances, the scanner, like most today, uses an invisible near infrared laser, which is eye safe because it cannot pass through water, so therefore it can't go through the water in your eye.
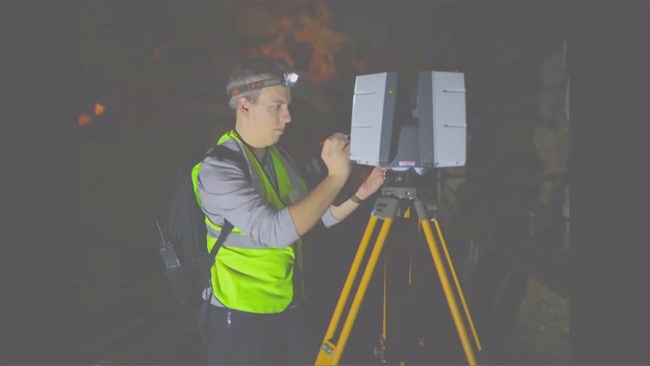
The P40 is a self-contained instrument with built-in stylus-based touchscreen for operation and a solid state drive for data storage. At each location it's got to be leveled on its tripod to the point that its internal level compensator can then maintain perfect levelness even if it gets a little bit of movement. At a weight of around 13 kilograms with batteries plus a wooden tripod, it'll help me stay fit and fortunately my colleagues are a little younger than me.
Malcolm Williamson, University of Arkansas
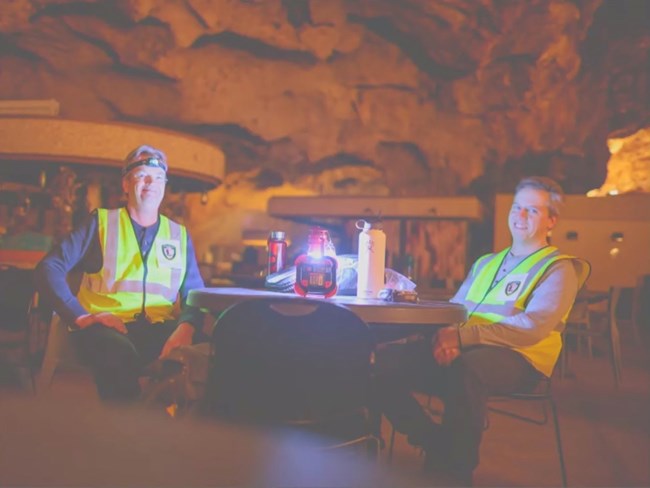
Outside the natural entrance to the cave we used scanning targets to tie our entire model to geographic coordinates using a survey grade GNSS RTK system. Working after hours to avoid people in our scans, we worked our way down the main corridor to the big room and lunchroom sections of the cave, always scanning from the modern trails as well as some lengths of the historic trails. We averaged about 50 scans per night with around 25 meters between locations.
So, looking at the numbers, we spent 20 days in Carlsbad Caverns, or nights if you will, one and a half government shutdowns, 1030 individual scan setups, 1.9 terabyte of raw scanning data, 3.37 terabytes of process data, 74 billion actual points, 4,000 plus miles driven and that means lots of Enterprise plus points.
So, we opted not to attempt to capture color images, which can be used to colorize the point cloud, except for while we were outdoors because the very low light inside the cave demanded long camera exposures which would have multiplied our acquisition time by about five times, so we just couldn't do that. A typical scan ran for 90 seconds, resulting in almost 90 million points measured. Because there were reflective surfaces all the way around, we were pretty much collecting data everywhere it's looking.
Malcolm Williamson, University of Arkansas
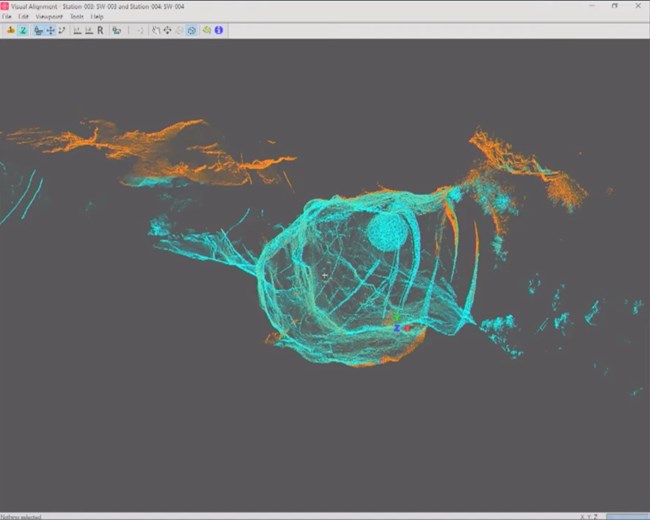
As we processed the scanned data, we used a cloud to cloud alignment technique that performs an iterative best fit between each scan. Because there were no moving objects in the cave, except for a stray bat or two, this technique is extremely robust for this environment, and it saves a massive amount of time in the cave itself as compared to using the technique of targets for aligning scans in the cave, which is much more time consuming in the field.
So the other major issue that we ran into in this project was the reflection of the scanner's laser beam by the stainless steel railing that's all along the trails, right? And so if you look in this picture, it's a little hard to see, there's little red streaks through the data right here. Those are reflections from the railings. And so they don't represent real points in space. Thankfully the railing isn't polished, so the reflected light is substantially lower intensity than the beam emitted directly from the scanner.
So at first we did a lot of manual cleaning trying to get rid of all this, but we eventually came up with a strategy to filter the returns by their intensity and so we were able to delete those low intensity points in the point cloud automatically. We still had to do that on each of the 1000 plus scans.
The delivered data from this project has always been maintained as a point cloud, billions of XYZ coordinates, as well as converted into a voxel-based data. So voxels are three-dimensional pixels, cubes, like in Minecraft, right? Why not convert all these points into a mesh of billions of triangles? Well, first of all, keep in mind that any way that we choose to digitally represent an object, it's an abstraction of reality. When we model buildings as planes and corners and curves, regardless there, there's really no flat surfaces or right angles in an actual building, right?
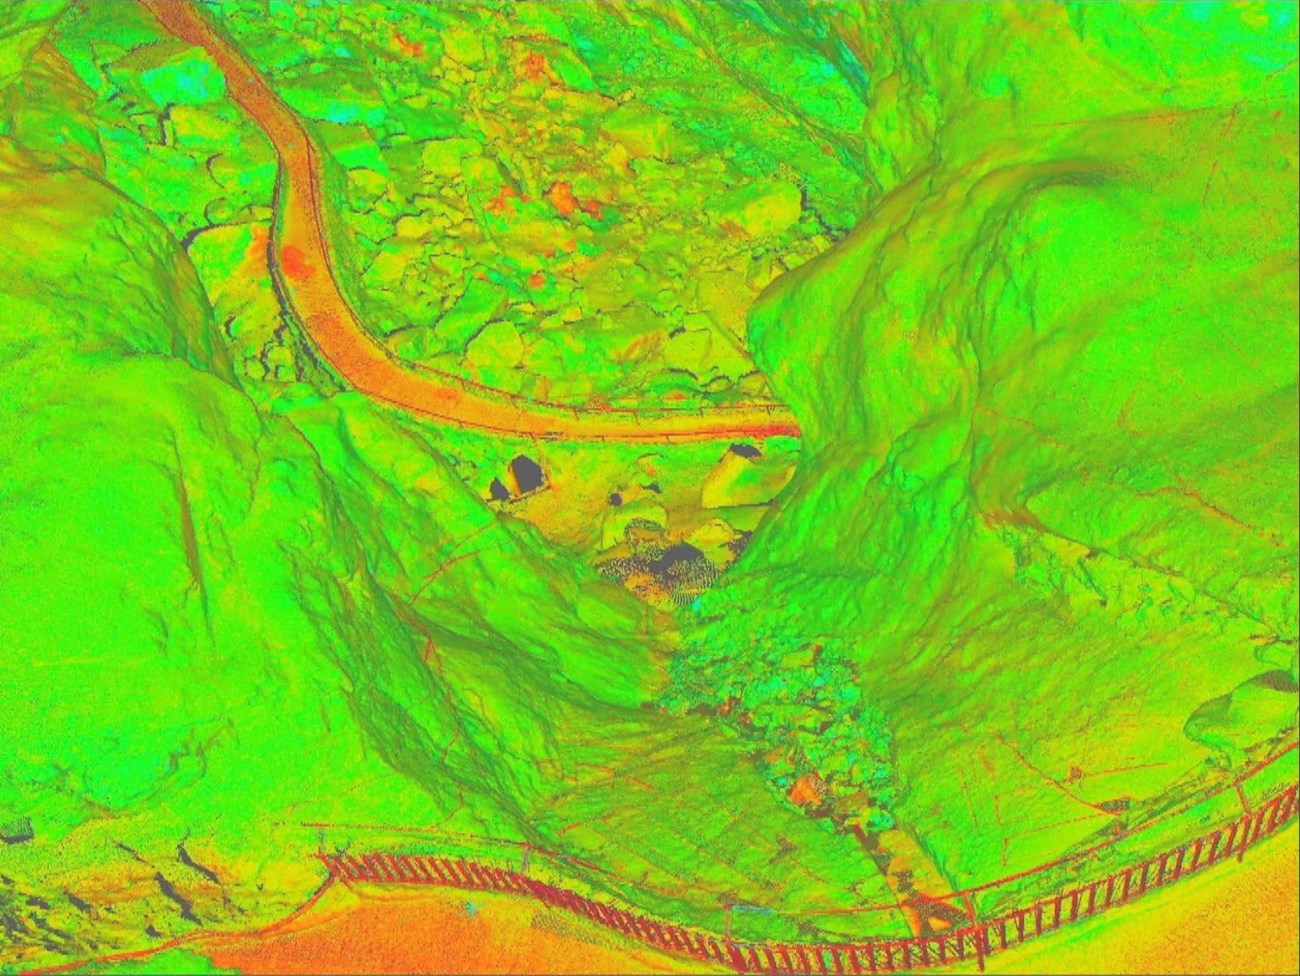
Malcolm Williamson, University of Arkansas
Organic surfaces a much more difficult to represent accurately, so we routinely settled for quite arbitrary rock representations, especially working in 2D. So in the Carlsbad Cavern point cloud surfaces within 10 to 20 meters of the scanner are often represented by point spacing as small as two millimeters. That little green markup there is indicating points that are two millimeters apart that were right up here.
At this density of measurement, does one even need a surface? Furthermore, areas in the cave that are highly decorated with smaller speleothems, such as soda straws, may not have a uniformly height point density from scanning due to obstructions and distance from the scanner. So meshing those features accurately would be extremely difficult, rather like meshing grass. So besides visualization, there are many uses for the point cloud model. As a geo-reference survey grade data collection, these data can be used to create the most accurate 2D and 3D maps of the cave to date.
Although the data is normally viewed in a prospective mode, the viewer and prints produced through it can be switched to an orthographic mode resulting in a constant scale across the image, whether it be in plan or elevation view. It's simple to take measurements of distance or angles to even fit simple lines, planes or even cylinders to areas of the point cloud to estimate slope, volume, etc. It's easy to look for spatial relationships between disconnected parts of the cave and view sheds can be established for any point in the cave, in particular, the 360 degree view from each actual scanner location already exists in the data set as something called a true space and it can be viewed as a sphere.
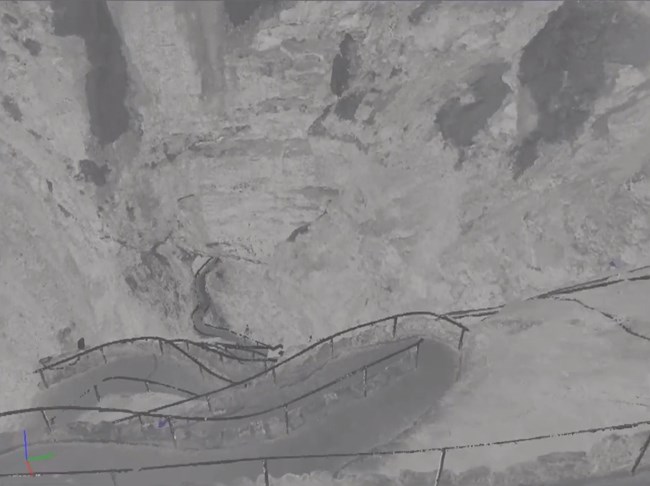
Malcolm Williamson, University of Arkansas
So this is the view from one scan location and you notice that there's no shadows, no data missing here because it's seeing something everywhere it looks, just like we do in two dimensional photographs. Another advantage of maintaining data in digital 3D form is the ability to render views under different lighting conditions. So in Leica Geosystems cyclone software there are four different lighting methods: environmental; headlamp, which is from the direction of the viewer; spotlights; and point lights.
The latitude can be placed as many times as desired and at as many locations as you desire, and all lights have adjustable color, brightness and angle, and attenuation. So, with work, it's actually possible to simulate actual present and past lighting on the cave model itself. For real-time exploration and fly-throughs, today's video cards for data that has surfaces rather than non-dimensional points. By converting the point cloud to voxels, we can leverage modern video gaming rendering technology in the video cards and enjoy rapid loading and updating of our remodels.
In Leica Geosystems, that means converting it to a technology called jet stream. So I'm going to show you a video that was recorded just directly off my screen live. This is not rendered over time or anything. So this is flying through the voxel based point cloud down the natural entrance of the cave. The purple areas that you see are where there are no data and so we'll go through the death gate, as it's known, since we don't want to fall in.
The circular areas that you see along the trail as we go along, that's where the tripod for the scanner was located, so it can't see below itself, it can see every other direction.
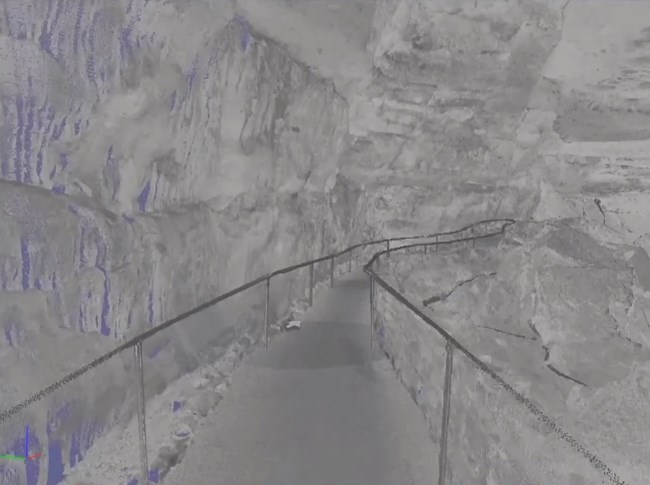
Malcolm Williamson, University of Arkansas
Speaker 2: What's causing the blue?
Malcolm Williamson: That's where there's no data. So those are shadows. And I'm going to jump over the railing here rather than follow the whole way down. So we'll jump over the edge. Whoa. You ought to see me driving this, I cringe and stuff. So now we're heading back under the amphitheater and into the main part of the main corridor. And where you see dark patches on the walkway here, that's a damp places. So remember that near infrared light's not reflected by water?
Speaker 2: How long of a distance is that from where you started?
Kimball Erdman: So we're barely in the cave…
Malcolm Williamson: Yeah, this is [crosstalk 00:12:08].
Speaker 2: …can you walk through, 20 minutes .. [inaudible 00:12:11].
Malcolm Williamson: Oh, to here, that's what? Not even 10 minutes if you're walking fast. Yeah.
Kimball Erdman: This is where the formations really start.
Malcolm Williamson: Yep.
Speaker 3: At this point, where we are at this moment.
Malcolm Williamson: Right. And you'll notice in some places where you see the railings are brighter. That's because it's right where the scanner was located, so stronger light beam reflecting off of them there. And you'll see dark lines on the side too, those are the lighting cables, the black rubber cables. And so following along the path, and I think… you know what? Let's just go freestyle here and just head over the edge. And so this is where the cave starts to get pretty steep.
And we can see a bench up here, one of the electrical control panels here, and then the cave gets really steep. So you can also get view sheds that aren't possible from an actual person on the trail. Yep.
Anyway, I'm going to ease up here and finish this up. As you've seen, there's real value in these technologies. Our goal is to help maintain this value after the data is collected. I'd like to thank my hardworking colleagues, Vance Greene and Clinton Beasley for their dedication in the field on this project and also Julie McGilvery and Doug Neighbor and Kimball. Thanks very much for making this possible, it was a lot of fun. And a special thanks to all the other staff at Cave, who helped and tolerated us throughout our journey.
University of Arkansas
Speaker Biography
Malcolm Williamson is a senior researcher at the Center for Advanced Spatial Technologies at the University of Arkansas. He leads research and provides project management over a wide range of geospatial and visualization subjects, including wetlands mapping and analysis, visual and environmental impact analysis of on-shore and off-shore energy facilities, 3D recordation of heritage sites, and pedagogical approaches for K-12 geospatial education. As an FAA-licensed Remote Pilot, he manages a collection of unmanned aerial systems and sensors including thermal, hyperspectral, and LiDAR capabilities.
