Last updated: June 10, 2024
Article
Water Resources Monitoring in the Lamar River near Tower Ranger Station, Wyoming, 2022
The Greater Yellowstone Inventory and Monitoring Network monitors water quality and analyzes river discharge (flow) in the Lamar River each year. Water quality is high in the Lamar River; about three quarters of its watershed is contained within Yellowstone National Park.
NPS
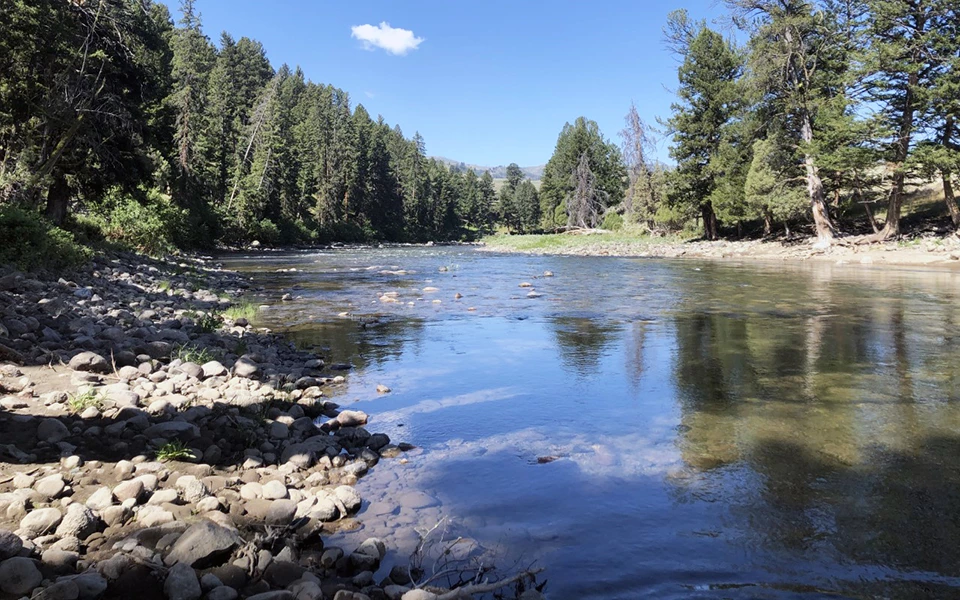
The Lamar River Site
The Lamar River has a drainage area of 668 mi2 (1730 km2) and is the largest tributary to the Yellowstone River inside Yellowstone National Park. The river is named after Lucius Quintus Cincinnatus Lamar, the Secretary of the Interior under President Grover Cleveland from 1885 to 1888.
Originating in the Absaroka-Beartooth Mountains, the Lamar River travels nearly 44 miles (70 km) from its headwaters to the confluence with the Yellowstone River near Tower Junction. Major tributaries include Cache Creek near its headwaters and Soda Butte Creek and Slough Creek closer to its mouth.
We sample the Lamar River above its confluence with the Yellowstone River (Figures 1 and 2). Most of the Lamar River watershed is contained within federally managed lands; 73% of the watershed is encompassed by the boundaries of Yellowstone National Park (1270 km2 of its 1730 km2 area).

NPS

NPS
Water Flow in the Lamar River
The U.S. Geological Survey operates the one gaging station (USGS Gage 06188000) on the Lamar River in cooperation with Yellowstone National Park. The gage is located just above the confluence with the Yellowstone River and has daily flow data dating back to 1923. A portion of the discharge record spanning from Fall 1969 to Summer 1988 is missing.
The Lamar River shows a characteristic snow-driven hydrograph, where peak flows can be two orders of magnitude (100 times) higher than baseflows. The average of annual peak flows between 1924 and 2021 is 8,059 cubic feet per second (cfs), and the average date for peak flow occurred on 4 June (day 155 of the year). Minimum annual daily flows over this same period of record averaged 70 cfs.
In June of 2022, the Yellowstone River and its tributaries, including the Lamar River, experienced a 500-year flooding event. Water flows in the Lamar River in 2022 tracked at or below the long-term mean (1924–2021) until late May. By mid-June, the combination of heavy rainfall and warming overnight temperatures accelerated snow melt on already saturated soils. Flows in the Lamar River peaked at a record 23,800 cfs on 13 June (day 164 of the year), the first day of flooding (Figure 3). The previous record was set in 1995 at 15,600 cfs.
Despite this unprecedented flooding, discharge values for the Lamar River near Tower Ranger Station returned to the historical average (1924–2021) by early July and dropped below this historical average by mid-July 2022. This occurred because of a warm, dry summer in this region of the park. July received 50% less precipitation compared to the 30-year average (1991–2020) while air temperatures at Tower Falls, WY, were recorded at 3°C above the 30-year average (1991–2020; Figure 4). Minimum flow in 2022 was 76 cfs.

NPS

Figure was constructed using www.climateanalyzer.org
NPS
Water Quality in the Lamar River
Water quality is high in the Lamar River and most of the watershed is managed within federal lands. Suspended sediments and total phosphorus are typically at their annual maxima during high flows. Other analytes (e.g., sulfate, total calcium, and total sodium) are at their annual minima during high flows and increase as the river approaches baseflow. Historically, nitrate + nitrite as nitrogen (NO3 + NO2 as N) and ammonia as nitrogen (NH3 as N) are typically below detection levels.
We sampled the Lamar River for water chemistry and core water quality parameters seven times from March to October in 2022. Core water quality parameters include temperature, specific conductance, dissolved oxygen, pH, and turbidity. Results in 2022 were comparable to previous years until the 13 June 2022 flooding event. Phosphorus values, normally low (ranging from below detection to 0.07 mg/L; reporting limit = 0.01 mg/L), ranged from 0.04 to 0.14 mg/L in samples taken after the flooding event. Non-detectable results predominated for ammonia as nitrogen. Nitrate + nitrite as N, usually below detection (reporting limit = 0.01 mg/L), had a range of below detection to 0.07 mg/L. TSS values were also elevated, ranging from 2 to 76 mg/L. TSS values usually peak during the river's return to base flow in the mid to late summer.
The June flooding event disabled the temperature sensor at the Lamar River near Tower Ranger Station monitoring site (USGS 06188000) for two months over the summer. There is a break in the temperature record from 13 June 2022 through 15 August 2022. Recorded water temperatures in 2022 were highest during summer and coincided with summer baseflows. Mid-August temperatures exceeded the average daily temperature by 2 to 3°C (Figure 5). Surface temperatures exceeded Wyoming Department of Environmental Quality water quality guidance (WYDEQ 2018) on maximum water temperature for cold water fisheries (20°C, 68°F) for one day (17 August 2022; Figure 6).

NPS

NPS
2022 Water Quality Results
Table 1 shows water quality lab results and Table 2 shows water quality field results for the Lamar River in calendar year 2022. All Data for current and previous years can be accessed in the NPS Data Store. Data can also be downloaded from the Water Quality Portal using "11NPSWRD_WQX-YELL_LM000.5M" as the SiteID in the "Advanced" menu.
| Water Chemistry Lab Parameters | 23 March Reg | 23 March Rep | 02 May Reg | 02 June Reg | 29 June Reg | 29 June Rep | 01 August Reg | 16 August Reg | 16 August Rep | 04 October Reg | 04 October Rep |
|---|
| Core Water Quality Field Parameter | 23 March | 02 May | 02 June | 29 June | 01 August | 16 August | 04 October |
|---|
NPS
Monitoring Methods
Water Chemistry
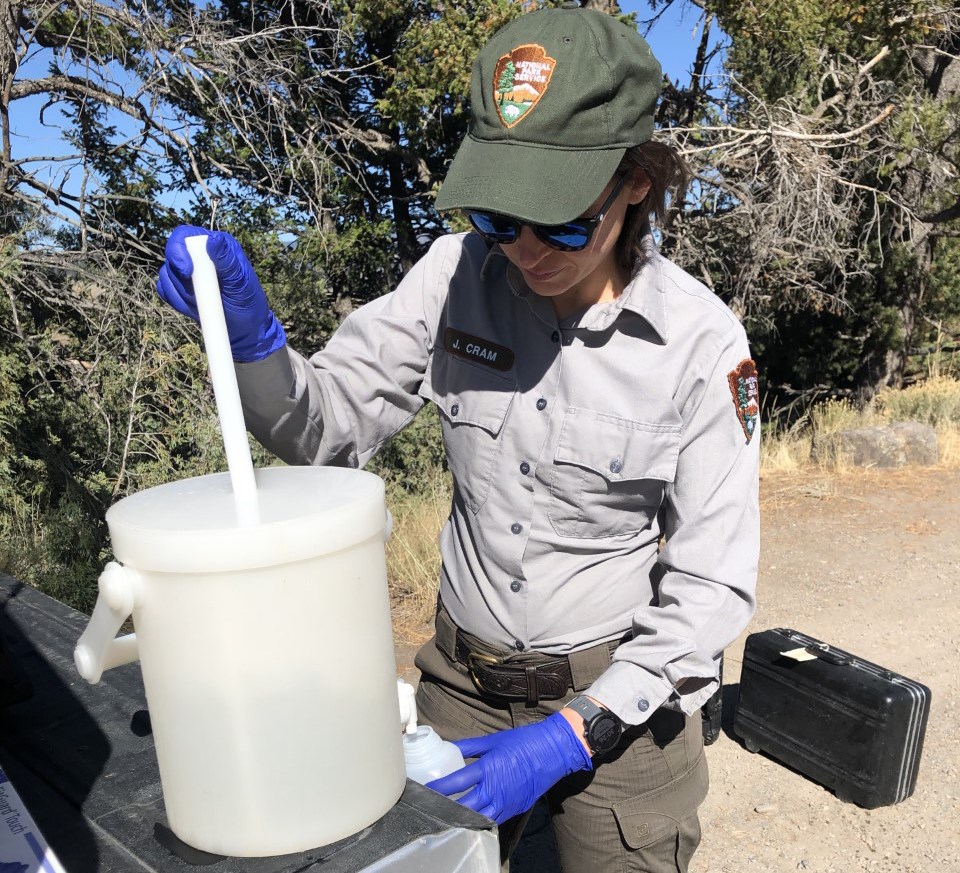
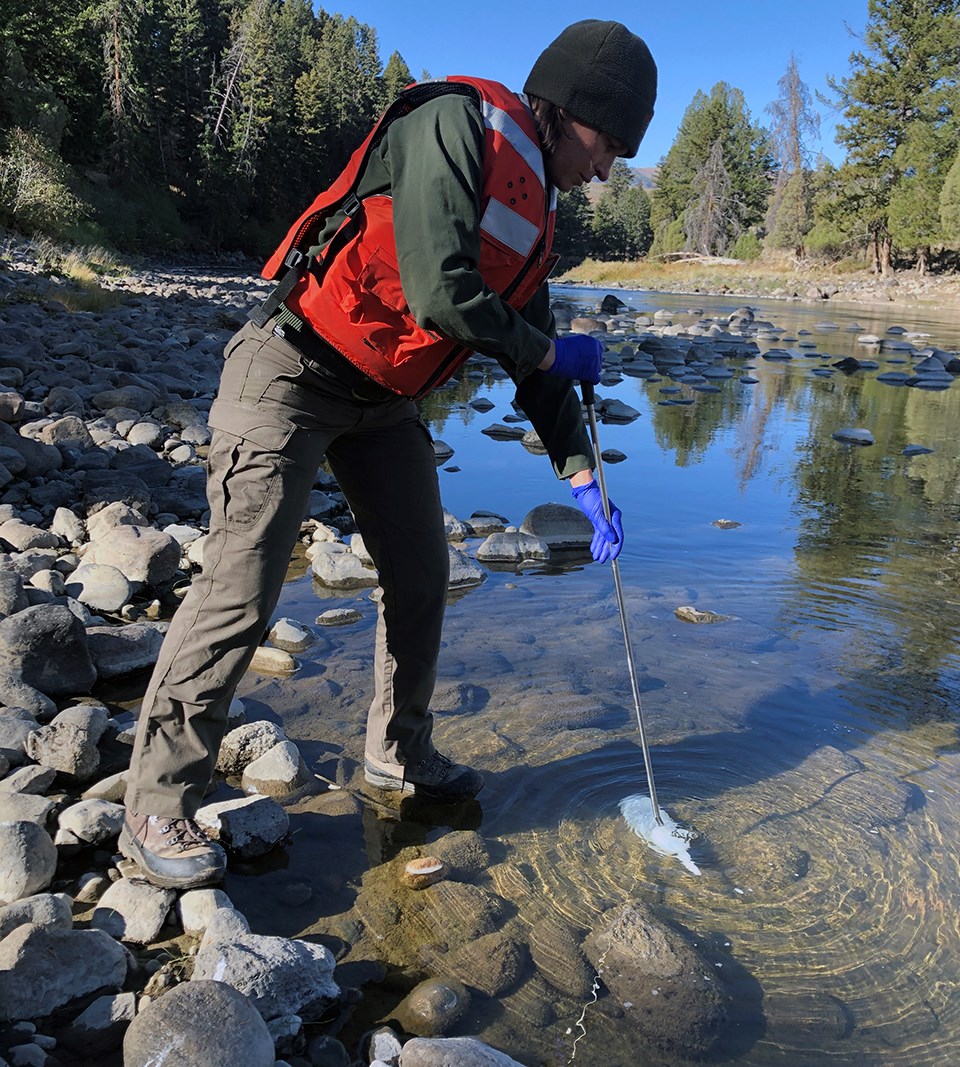
The Greater Yellowstone Inventory and Monitoring Network collects water samples monthly during ice-free periods generally following depth and width-integrated protocols outlined in the U.S. Geological Survey (USGS) National Field Manual for the Collection of Water-Quality Data.
We use a 1-L, hand-held DH-81 sampler affixed to a 1-m wading rod to collect depth and width-integrated water samples. At multiple locations along the river's cross-section, we collect water using vertically integrated sampling techniques. Samples from the 1-L bottle are mixed into an 8-L churn splitter; we use the churn splitter to homogenize and dispense a representative subsample into laboratory-provided bottles. These bottles are then shipped overnight to an EPA-certified commercial lab for processing.
NPS
Core Water Quality Parameters
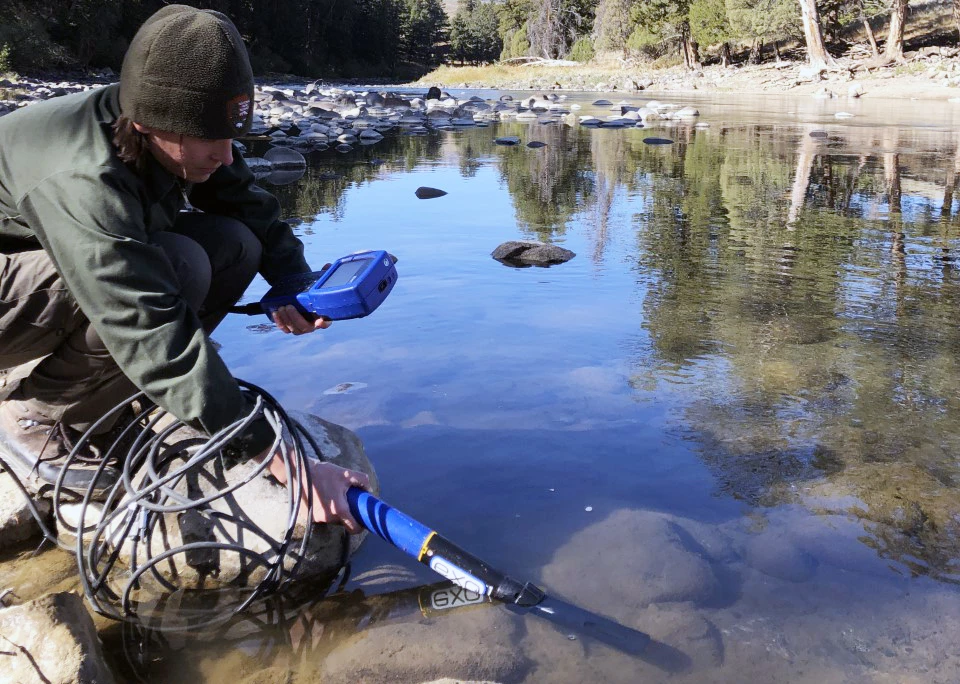
In addition to water samples, water quality parameters (temperature, specific conductance, dissolved oxygen, pH, and turbidity) are collected in situ using a handheld, multi-parameter instrument (e.g., YSI EXO 1 sonde) at four representative locations on the river cross section. Collection of water sample core parameters and rationale for testing nutrients and suspended solids is described in the approved Greater Yellowstone Network Regulatory Water Quality Monitoring Protocol (O'Ney 2006).
River Discharge
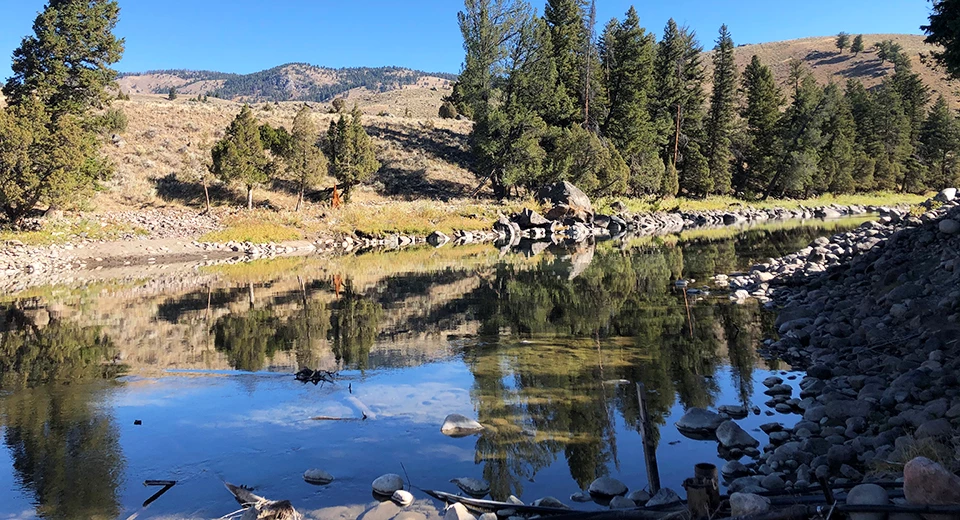
Discharge (river flow estimates) and water temperature data from the Lamar River sampling location are available online from the U.S. Geological Survey's National Water Information System and listed under station USGS 06188000. The station is near Tower Ranger Station, WY.
Greater Yellowstone Network Water Resources Protocols
Read the full protocols and standard operating procedures for water quality and discharge here.Source: NPS DataStore Collection 7853. To search for additional information, visit the NPS DataStore.
NPS
Water Quality Criteria for the Lamar River
Under the Clean Water Act, the surface waters in Yellowstone National Park are classified as Outstanding National Resource Waters. Additionally, these waters, located wholly within national park boundaries, are designated as Outstanding Resource Waters in Montana (Administrative Rules of Montana 17.30.617) or Class 1 Outstanding Natural Resource Waters in Wyoming. In Wyoming, this designation indicates that high quality waters are known to support fish or supply drinking water and no further water quality degradation by point source discharges other than from dams will be allowed.
Lamar River water quality monitoring results are compared to the following federal and state water quality standards.
EPA National Recommended Water Quality Criteria
Environmental Protection Agency (EPA). 1987. Quality criteria for water 1986 [The Gold Book]. EPA440/5-86-001. U.S. EPA, Office of Water Regulations and Standards, Washington D.C.
Wyoming Surface Water Quality Standards, Chapter 1, Water Quality Rules
