Last updated: January 21, 2022
Article
Impacts of Climate Change on the Snake River Headwaters
Content submitted by: Simeon Caskey, Grand Teton National Park
The Snake River begins along the continental divide at the heart of the Greater Yellowstone Area (GYA), one of the last remaining large and nearly intact temperate ecosystems on Earth. The rivers and streams of the Snake Headwaters in Grand Teton National Park drain the Teton Range, Absaroka Mountains, and Yellowstone Plateau. Major tributaries are Pacific Creek, Buffalo Fork, Spread Creek, and the Gros Ventre River feeding into the Snake River from the east. Spring snowmelt released from the surrounding high elevation areas drive annual foods throughout the park. Historically, yearly peak flows can occur anytime from mid-May to mid-June, depending on snowpack and spring temperatures.

NPS/ C. Adams
The fluvial backbone of Grand Teton, the Snake River, as well as several of its tributaries - are managed as a Wild and Scenic Rivers. On March 30, 2009, passage of the Craig Thomas Snake Headwaters Legacy Act of 2008 added 414 miles of rivers and streams of the Snake River Headwaters to the national wild and scenic rivers system. The purpose of this designation is to protect the free-flowing character, water quality, and outstandingly remarkable values for the benefit and enjoyment of present and future generations. The segment of the Snake River below Jackson Lake Dam contains a textbook example of one of the longest continuous and naturally braided river systems in the contiguous United States. This dynamic system transports significant quantities of gravel and has diverse fluvial features such as side channels, logjams, and floodplains that support critical habitat. Although the Snake River and several major tributaries are managed as Wild or Scenic Rivers, climate change and humans continue to impact the aquatic, riparian, and terrestrial systems.
Climate Change
Climate change has already resulted in changing conditions across the GYA and in the Snake River Headwaters basin. The recently released Greater Yellowstone Climate Assessment (Hostetler et al, 2021) identified GYA wide trends from 1950-present, specifically: mean annual temperature increase of 2.3°F; mean annual snowfall decline of 24 inches; and earlier timing of peak streamflow by 8 days. At a more granular level, in the Snake Headwaters, temperature and snowfall change was less severe only increasing by 1.1°F, and decreasing by 17 inches, respectively. In contrast to the GYA, average annual total precipitation increased by 4.1 inches. Decreasing snowfall, yet overall increased precipitation, means that more water is falling as rain, in part because of changing seasonal distribution of precipitation, with increase in spring and fall and decrease in summer and winter.

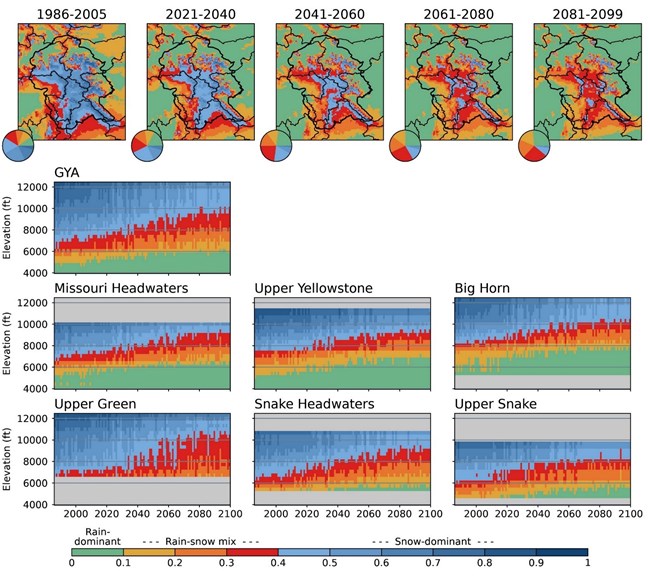
Figure 7-1 (From Hostetler et al 2021): The 1986-2099 annual snow regime for the Greater Yellowstone Area and Hydrologic Unit Code 6 (HUC6) watersheds under Representative Concentration Pathway 4.5 (RCP4.5), as simulated by the water balance model. The five maps across the top display the ratio of maximum snow water equivalent (SWE) to total cold-season (Oct-Apr) precipitation (P) SWE:P for the indicated time periods (see appendix to this chapter for details on the ratio). The pie charts inset in the maps show the fraction of GYA area within each SWE:P category. The time-elevation plots for the HUC6 watersheds in the bottom two rows display the trend in SWE:P ratio from 1986-2099 averaged over 330 ft (100 m) elevation bands. Gray shading indicates elevations not present in the HUCs.

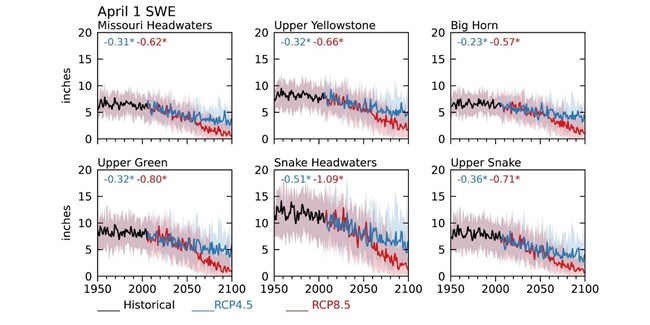
Figure 7-2 (From Hostetler et al 2021): Time-series plots of the 1950-2099 April 1 amount of water stored in the snowpack (snow water equivalent, or SWE), as simulated by the water balance model. The solid lines are the medians of the 20 simulations that used the MACAv2-METDATA data, from 1950-2005 (black line), and 2006-2099 for Representative Concentration Pathway 4.5 (RCP4.5, blue line) and RCP8.5 (red line). The shaded bands around the lines are the 10th (lower) and 90th (upper) percentiles of the models. The first number in the inset in each panel is the trend (in inches/decade) for RCP4.5 and the second number is the trend for RCP8.5. An asterisk indicates that the trend is statistically significant at a 95% confidence level.
Looking to the future, we anticipate these past trends from 1950-present to continue and have additional impacts. Most of the GYA watershed, including the Snake Headwaters, are primarily influenced by snowfall and snowmelt, and forecast models predict the total area dominated by winter snowfall decreases from 59% to 11% by the end of the century. Water storage, often measured by April 1st snow water equivalent (SWE), is expected to decrease at a rate of 0.5 inches/year in the Snake Headwaters. Runoff timing is also predicted to continue to occur earlier, driven by declining snowfall, and earlier melt, extending the low-flow season further.
Human Influence and Impacts
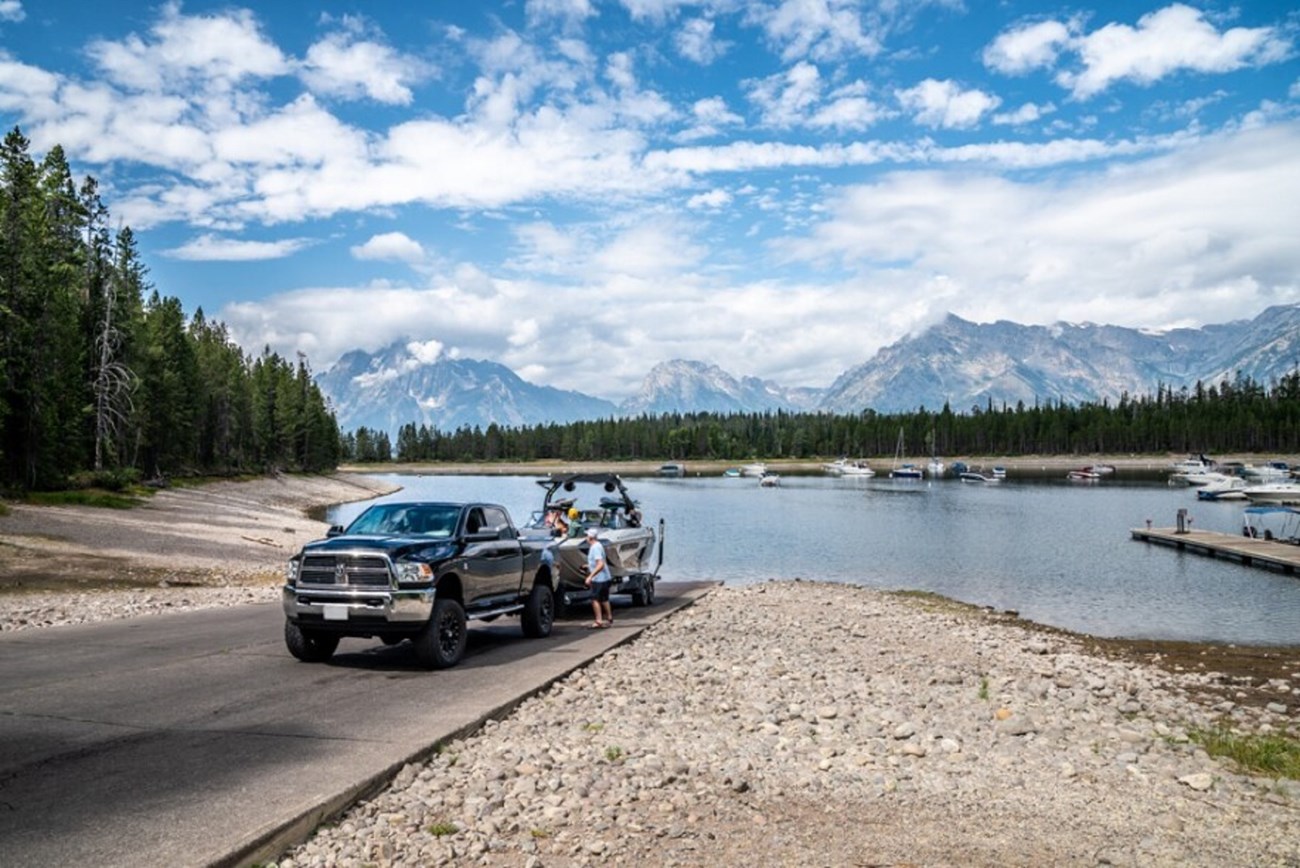
Jackson Lake Dam, originally built in 1906–07 and reconstructed in 1916 to supply water to Idaho for agriculture, raised the height of the natural lake by 38 feet. Dam operations completely dictate the flow of the Snake River until the Pacific Creek confluence 4.5 miles downstream. In 2020, the dam released a daily peak flow of 5,520 cfs, about ½ of the estimated peak unregulated flow, 10,776 cfs. This prevents an important part of the peak runoff which scours the riverbed and transports material including downed trees. These factors affect the ecology of river plants, animals, insects, and fish in ways we do not yet fully understand. Like other large reservoirs, Jackson Lake is a recreational draw known for boating, fishing, and scenery, but the severe drought in the headwaters and downstream throughout the Snake River Plain in 2021 led to historically low lake levels because of decreased precipitation and soil moisture combined with increased irrigation demand in Idaho. As a result, marinas were closed earlier than normal, access opportunities for boating and swimming became more limited, and the northern end of the lake – the historic Snake River floodplain and delta – became a dry, cracked mudflat.

Grand Teton National Park
Climate change and drought are also impacting how humans interact with the Snake River and its ecosystem. Recreationists that come to enjoy world class fishing opportunities because of the free-flowing condition and excellent water quality, encountered a rare occurrence this year when water temperatures in the mainstem Snake approached 70°F, the level at which trout become stressed due to low oxygen levels. In July of 2021, the near-threshold water temperatures led the Wyoming Game and Fish department to recommend anglers avoid fishing past 2pm, with Grand Teton supporting this and added anglers should stop fishing at when water reaches 68°F. Yellowstone went further by closing their waters from 2pm to sunrise due to high temps combined with unprecedented low stream flows. Although this is rare now, the climate forecasts will likely lead to meeting or exceeding temperature thresholds more frequently.
Like many other parks and public lands across the west, visitation is changing in Grand Teton on its trails, rivers, streams, and lakes. In 2021 the park exceeded record visitation well before the year ended, and while records are not comprehensive for private boaters on the Snake River, anecdotal evidence and boat inspection data suggest the river use trend was consistent with overall visitation increases. The management plan for the Wild and Scenic segments in the park call for use numbers to stay consistent with baseline as of 2009, and while we have a means to regulate this with the thousands of use days allocated to commercial operations. Meanwhile, our parking lots continue to grow, with no way to regulate or even count use on the horizon.
The headwaters of the Snake River are nationally significant resources that flow through an iconic landscape of stunning canyons, open meadows, broad vistas, striking mountains, glacial lakes, and sage flats. These landscapes and settings offer world-class recreational opportunities, but these experiences and the ecosystem services provided are being impacted by increasing air temperatures, decreasing snowpack, earlier snowmelt, and the resulting higher water temperatures. Moving forward, land managers, stewards, and citizens will need to be bold, and make hard decisions to resist, adapt, and direct as appropriate to balance visitor enjoyment, resource protection, and impacts from climate change.
References:
Hostetler S, Whitlock C, Shuman B, Liefert D, Drimal C, Bischke S. 2021. Greater Yellowstone climate assessment: past, present, and future climate change in greater Yellowstone watersheds. Bozeman MT: Montana State University, Institute on Ecosystems. 260 p.
https://doi.org/10.15788/GYCA2021.
Infographic title reads "HELP OUR NATIVE TROUT"
Subtitle reads "OUR FISH ARE IN HOT WATER"
Subtext reads "High water temperatures are more stressful for fish in rivers and streams. Know what temperature the water is before you fish."
Green Portion of Temperature Curve reads "45 degrees F, Optimal Temperatures, Fish on, these temperatures are prime fishing conditions"
Yellow portion of temperature curve reads "60 degree F, Warm Temperatures, Use heavier line and release fish quickly after catching it. Fish may be prone to stress."
Red portion of the temperature curve reads "65 degrees F, High Temperatures, Often, these high water temperatures occur when the highs are forecasted to reach 85 degrees. Stress caused by catch and release can be fatal to fish."
