Last updated: March 31, 2025
Article
Historical and Future Climate Patterns at Rocky Mountain National Park: Some Biological Implications
NPS
Summary
Introduction
Climate change has the potential to profoundly alter national parks, affecting plants, animals, and cultural resources (Monahan and Fisichelli 2014, Tercek et al. 2021). During this time of unusually rapid change (Portner et al. 2022), proactive management—planning ahead—has a better chance of success than reacting to crises after they arise. Proactive management requires understanding what we might expect in the future. This article compares historical climate patterns at Rocky Mountain National Park to the range of conditions anticipated for the late 21st Century to help park managers proactively plan for climate change.
Projecting Future Climate Conditions
Our discussion of the future is based on climate “projections.” Unlike weather “forecasts,” which typically extend only a few days to a few months in the future, climate projections extend decades into the future. Projections are based on complex computer models of the earth’s atmosphere and geological systems. These models integrate the effects of greenhouse gases, ocean currents, clouds and other processes on future temperature and precipitation. Climate projections are not meant to predict the temperature or rainfall on a particular day or month in the future, but they capture long-term—decades to centuries—trends in the average annual and seasonal patterns that we might expect. Many other climate variables, like number of growing days or soil moisture, are then usefully derived from temperature and precipitation.
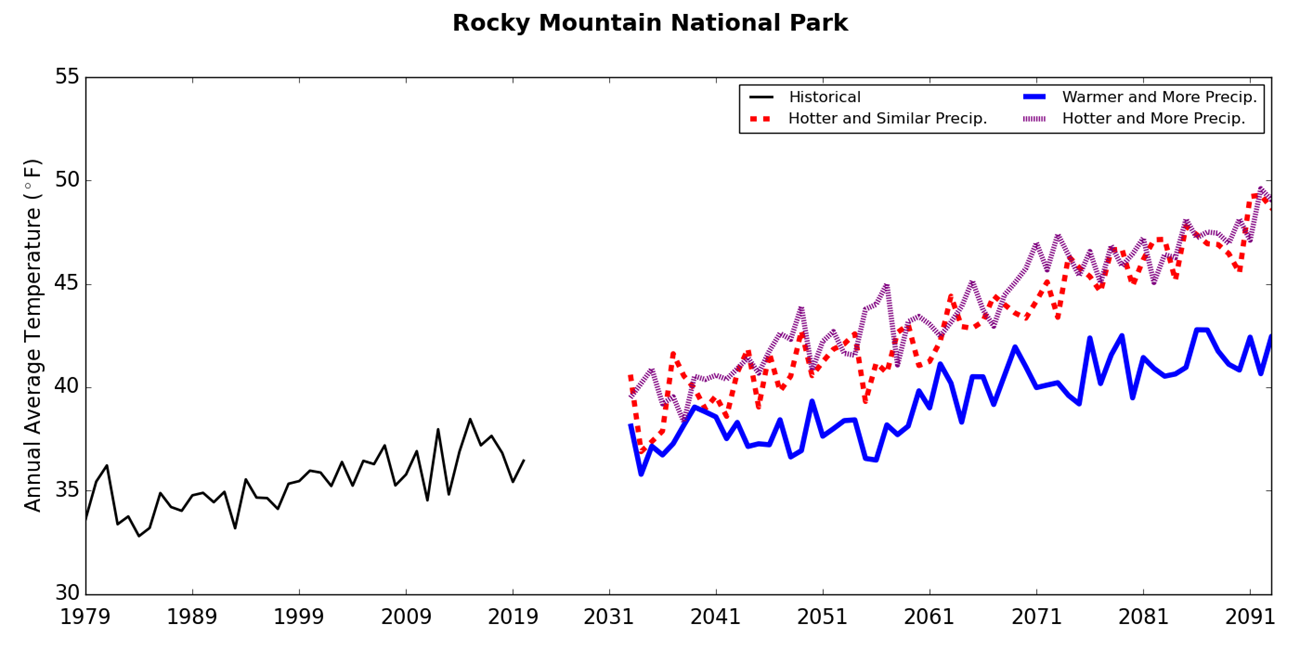
Over 40 climate projections are available for Rocky Mountain National Park from a variety of universities and agencies around the world. All of them point to future warming for the park. They disagree, however, about whether precipitation will increase or stay near historical levels. Consequently, we focus on three alternative projections that bracket the range of conditions projected for 2070 to 2099. They include precipitation at historical or increased levels and varying amounts of warming (Table 1).
| Projection Name | Temperature Increase | Precipitation Increase | GCM (Model Name) |
| Warmer + More Precipitation |
6 °F | 6 inches | MRI-CGCM3RCP 8.5 |
| Hotter + Similar Precipitation |
11 °F | 1 inch | IPSL-CM5A-LR RCP85 |
| Hotter + More Precipitation |
12 °F | 12 inches | MIROC-ESM-CHEM RCP85 |
Warmer Temperatures Mean Fewer Days below Freezing
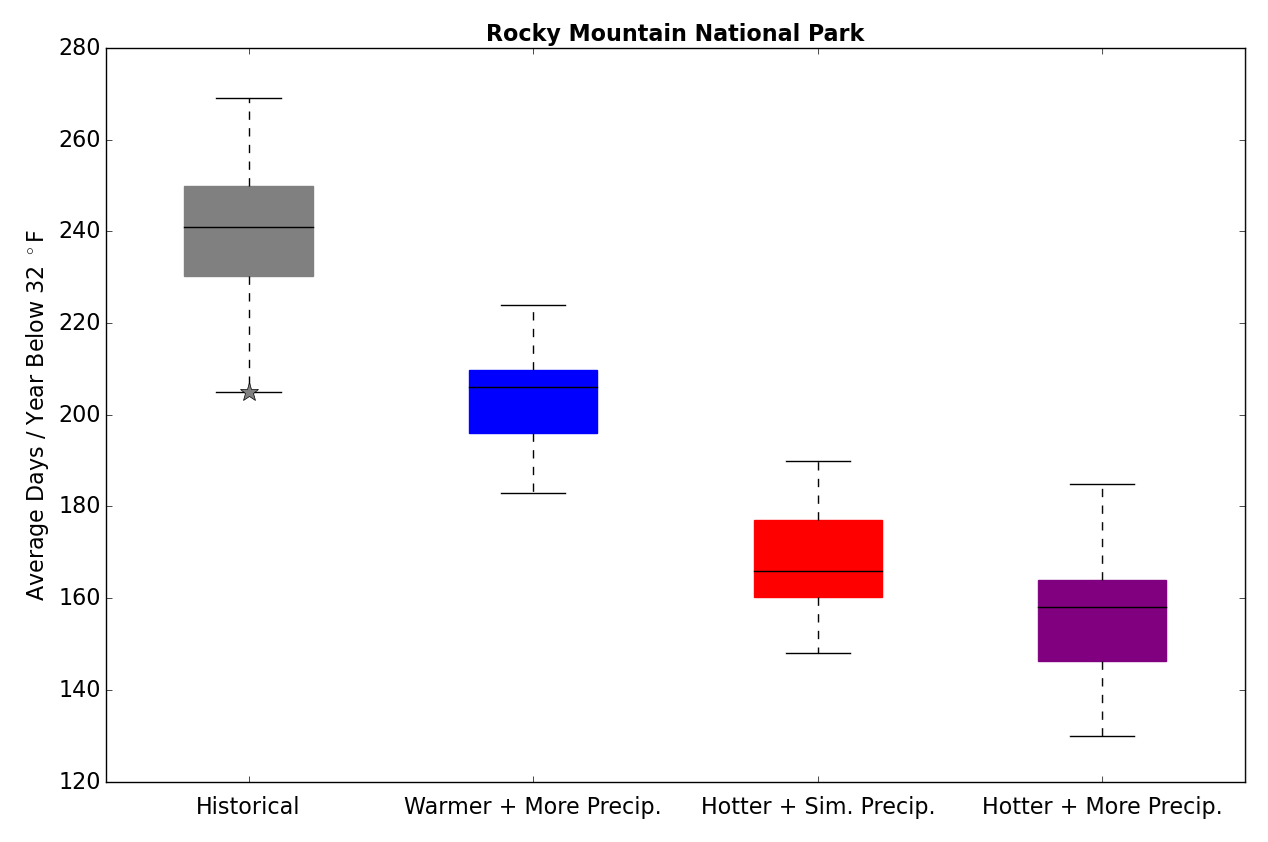
Days below freezing is one useful indicator of snow pack conditions during the winter. The “Warmer + More Precipitation” projection (Table 1, Figure 1) has only a moderate amount of warming, but nevertheless calls for a sharp drop, roughly six weeks, in the number of days per year below freezing (Figure 2). Notably, the Warmer + More Precipitation projection shows that the median number of freezing days is about the same as the lowest historical count of freezing days—205 days in 2015 (Figure 2). The two hotter projections show median days below freezing to be roughly 2/3 of the historical median (Figure 2)—again many fewer than occurred in the past. As a result, the season with snow cover will quite likely be months shorter and have shallower snow pack.
NPS
NPS
Changes to the Growing Season
Evaporation, Transpiration and Plant Growth
Actual Evapotranspiration (AET) is the amount of water evaporated from the Earth’s surface and transpired by plants each day. The length of the growing season can be estimated by AET (Tercek et al. 2023). This is because AET, which accounts for temperature and precipitation conditions, is greater than zero only when it is relatively warm (generally above 40 °F) and water is available in the soil. These are the same conditions needed for plants to grow. By looking at changes in the seasonal patterns of when AET is greater than zero, we can see how warming changes, in relation to precipitation changes, will affect the length of the growing season.
Warmer Temperatures Drive a Longer Growing Season
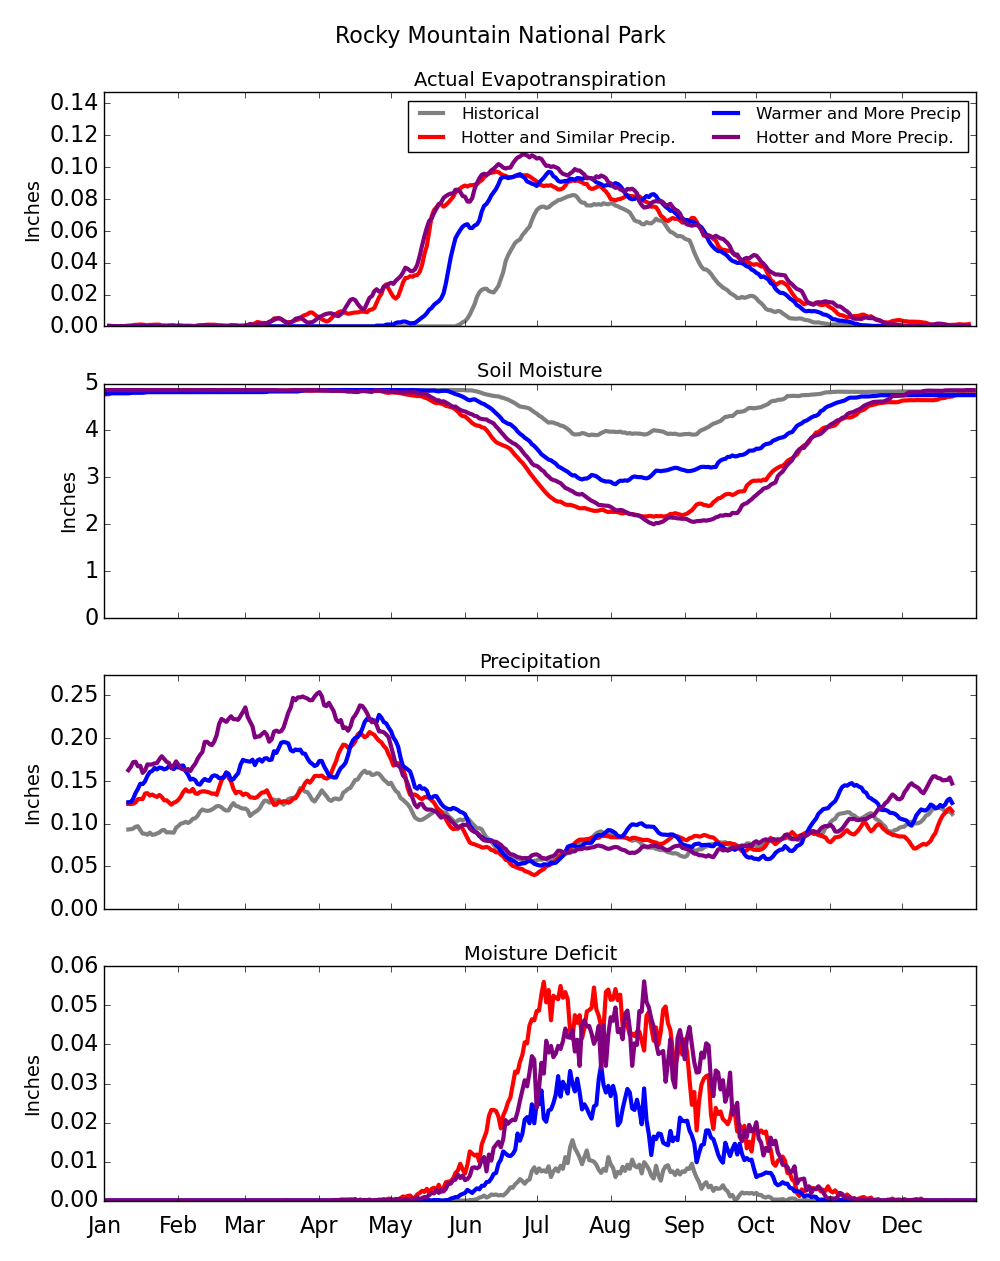
By the late 21st Century, the two “Hotter” climate projections show a growing season that begins as much as two months earlier—in April rather than June (time when AET > 0, top panel in Figure 3). Remember that Rocky Mountain National Park is a high elevation landscape where moisture is more plentiful than warmth—it is a temperature limited growth environment. Consequently, warmer temperatures, and not more precipitation, are driving a longer growing season. For example, notice that the growing season in the “Warmer + More Precipitation” projection only increases by one month in the spring, compared with an increase of two months for the two hotter projections. This is despite precipitation being the same or greater for the Warmer + More Precipitation projection (Table 1). Put simply, more warming will create a longer growing season regardless of whether precipitation changes. Since water supply was already abundant in the park historically, adding more moisture to the system will not increase plant growth, but warming will diminish the limits of temperature on growth.
NPS
Figure 3. Historical (1981–2010) seasonal patterns in Actual Evapotranspiration, soil moisture, precipitation, and moisture deficit compared to Late 21st Century (2070–2099) seasonal patterns in Rocky Mountain National Park. Actual Evapotranspiration combines evaporation and transpiration/plant water use. In the top panel, notice that the growing season (AET > 0) starts one to two months earlier in the year than it did historically. Soil moisture is the amount of water stored in the top 25 inch (1 meter) layer of soil. Moisture deficit is the amount of unmet water need—water that would be used (transpired by plants or evaporated) if it were available in the soil. These data are for the park centroid, near Bear Lake (40.356, -105.698), but the patterns are similar for other locations at a variety of elevations in the park.
Warmer Temperatures Drive Drier Soils, Despite Precipitation
Interestingly, even though all the climate projections in Figure 3 have similar or more precipitation than historical conditions, average soil moisture is projected to be lower in the future (Figure 3, middle panel). This is because warmer temperatures increase evaporation and transpiration. Even though the soil never becomes dry enough to limit plant growth, moisture deficit, which is associated with plant wilting stress, increases slightly during the warm months in all future projections (Figure 3, bottom panel).
NPS
Biological Implications
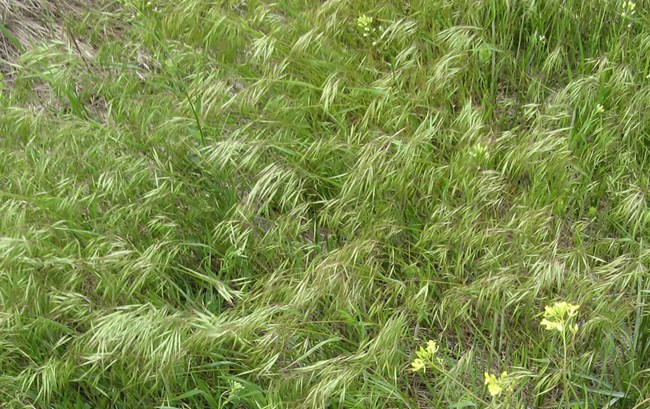
As with much of the western United States, the future for Rocky Mountain National Park will be warmer. Despite any potential increases in precipitation, soils will be drier in the summer. These changes, along with the projected months-longer warm season and shorter duration of snow cover have biological implications for park ecosystems. One of these is a significantly longer growing season for plants, driven by warmer spring temperatures. This is not necessarily good news for all plants. Cold-adapted species could be outcompeted by lower elevation plants that use the extended growing season to monopolize space. Some of these new species will probably be nonnative or weedy, like cheatgrass (Bromus tectorum). Drier summertime soils would also put shallower-rooted plants, such as wild strawberries (Fragaria virginiana), at a disadvantage against deeper-rooted shrubs and trees, like wild roses (Rosa woodsii) and Ponderosa pines (Pinus ponderosa). While the cascading biological effects of these climate changes are hard to predict, plant and animal communities will likely be dramatically different by the end of the century.
Literature Cited
Abatzoglou, J.T. 2013. Development of gridded surface meteorological data for ecological applications and modeling. International Journal of Climatology 33:121–131.Abatzoglou, J.T., and T.J. Brown. 2012. A comparison of statistical downscaling methods suited for wildfire applications. International Journal of Climatology 32:772–780.
Monahan, W.B., and N.A. Fisichelli. 2014. Climate exposure of US national parks in a new era of change. PLoS ONE 9(7):e101302.
Pörtner, H.-O., D.C. Roberts, M. Tignor, E.S. Poloczanska, K. Mintenbeck, A. Alegría, M. Craig, S. Langsdorf, S. Löschke, V. Möller, A. Okem, and B. Rama. 2022. Climate change 2022: Impacts, adaptation, and vulnerability. Contribution of Working Group II to the Sixth Assessment Report of the Intergovernmental Panel on Climate Change. Cambridge, U.K.: Cambridge University Press. https://doi:10.1017/9781009325844.
Tercek, M.T., J.E. Gross, and D.P. Thoma. 2023. Robust projections and consequences of an expanding bimodal growing season in the western United States. Ecosphere 14(5):e4530. https://doi.org/10.1002/ecs2.4530.
Tercek, M.T., D. Thoma, J.E. Gross, K. Sherrill, S. Kagone, and G. Senay. 2021. Historical changes in plant water use and need in the continental United States. PLoS ONE 16(9): e0256586. https://doi.org/10.1371/journal.pone.0256586.
