Last updated: May 2, 2025
Article
Coastal Dynamics Monitoring at Padre Island National Seashore, Texas: 2017-2023
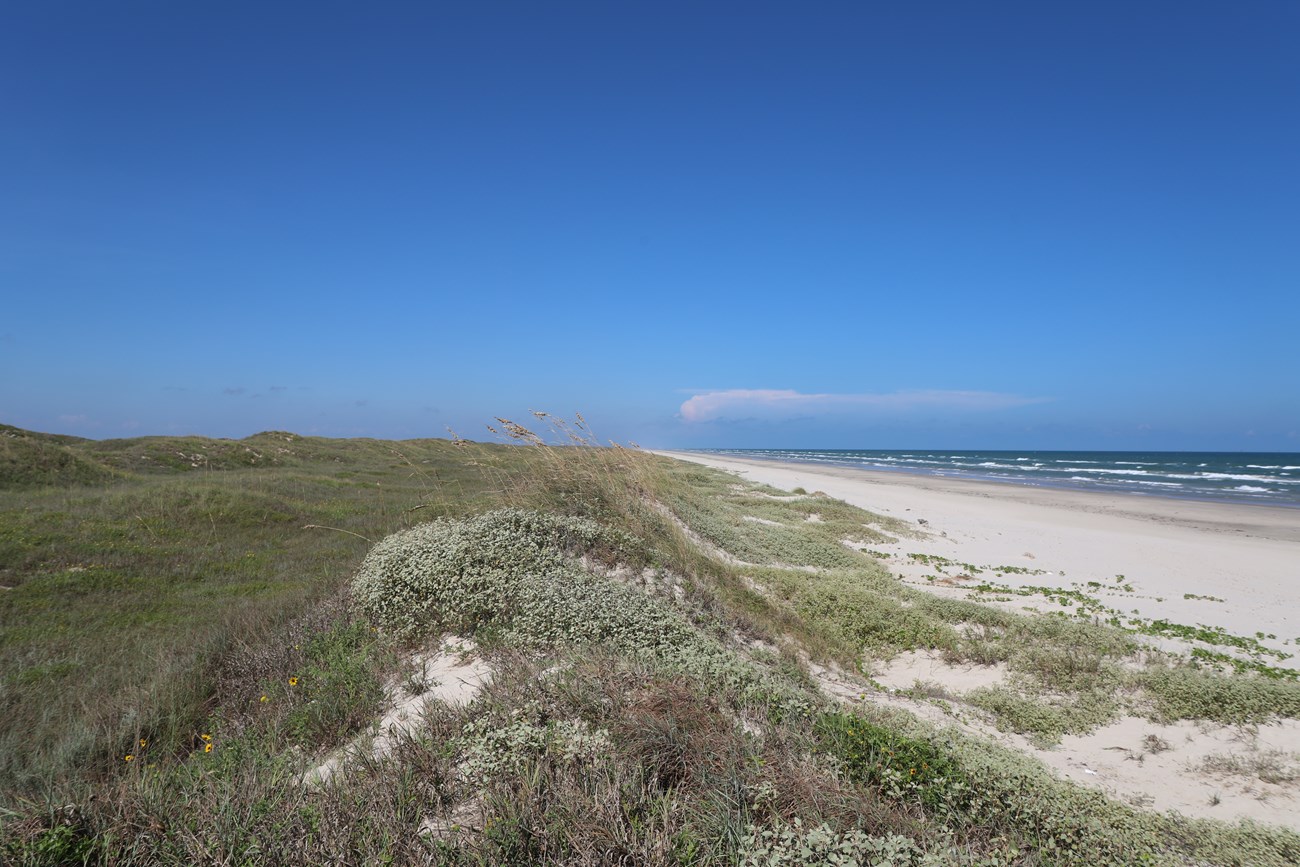
Jeff Bracewell/ NPS
Summary and Key Findings
In the spring of every other year, the Gulf Coast Network (GULN) conducts geomorphology monitoring at Padre Island National Seashore (PAIS) as a part of the NPS Vital Signs Monitoring Program.
Highlights
- Since the 2021 survey, there has been an overall seaward advance in shoreline position accompanied by an increase in dune profile area.
- Short-term accumulation of sediment in the foredune and beach complex since 2021 is coincident with regionally mild tropical storm seasons and fewer storm surge occurrences.
Monitoring is conducted following methods detailed in the Protocol Implementation Plans for Coastal Topography (Bracewell 2017a) and Shoreline Position (Bracewell 2017b). This report presents results for the 2023 season and compares change over time. In 2023, a shoreline position survey was completed for the entire length of the park's gulf shore, and a fixed set of 23 topographic transects distributed along the Gulf shore were surveyed for elevations.
Key findings from this effort are as follows:
- Shoreline position has advanced seaward over the project’s full duration (2023 versus 2017) as well as between the two most recent surveys (2023 versus 2021).
- Mean dune profile area increased from 2021 to 2023, indicating short-term accumulation of sediment in the foredune and beach complex.
- Shoreline seaward-advance and an increase in dune profile area since 2021 are coincident with regionally mild tropical storm seasons and fewer storm surge occurrences.
This project is in the early phases of implementation and will benefit from future surveys to better understand the influence of slight changes in survey timing and other environmental variations.
Introduction
Coastal barrier islands are dynamic physical foundations for ecosystems. Winds, tides, and currents shape island landforms continuously, and island geomorphology is extensively influenced by extreme weather events, sea-level change, and human activities. In coastal regions where change is a constant, resource management and protection requires an understanding of geomorphic change rates, severities, and potential causes. To address this need, the Gulf Coast I&M Network (GULN) conducts coastal geomorphology monitoring at two National Seashore parks, based on methods established by the Northeast Coastal and Barrier Network (Psuty et al. 2010, 2012). The Gulf Coast Network records coastal topography –i.e., the beach/dune elevation profile– and shoreline position using the Global Navigation Satellite System (GNSS) during surveys conducted in the spring of alternate years (Bracewell 2017a,b). The purpose of this document is to report the GULN’s most recently collected geomorphology data for Padre Island National Seashore, within the context of the long-term shoreline position and topographic change datasets for the park. Data and findings from previous surveys are available at the Gulf Coast Network Shoreline and Coastal Topography Monitoring Projects on the Integrated Resource Management Applications (IRMA) Portal.
Study Area
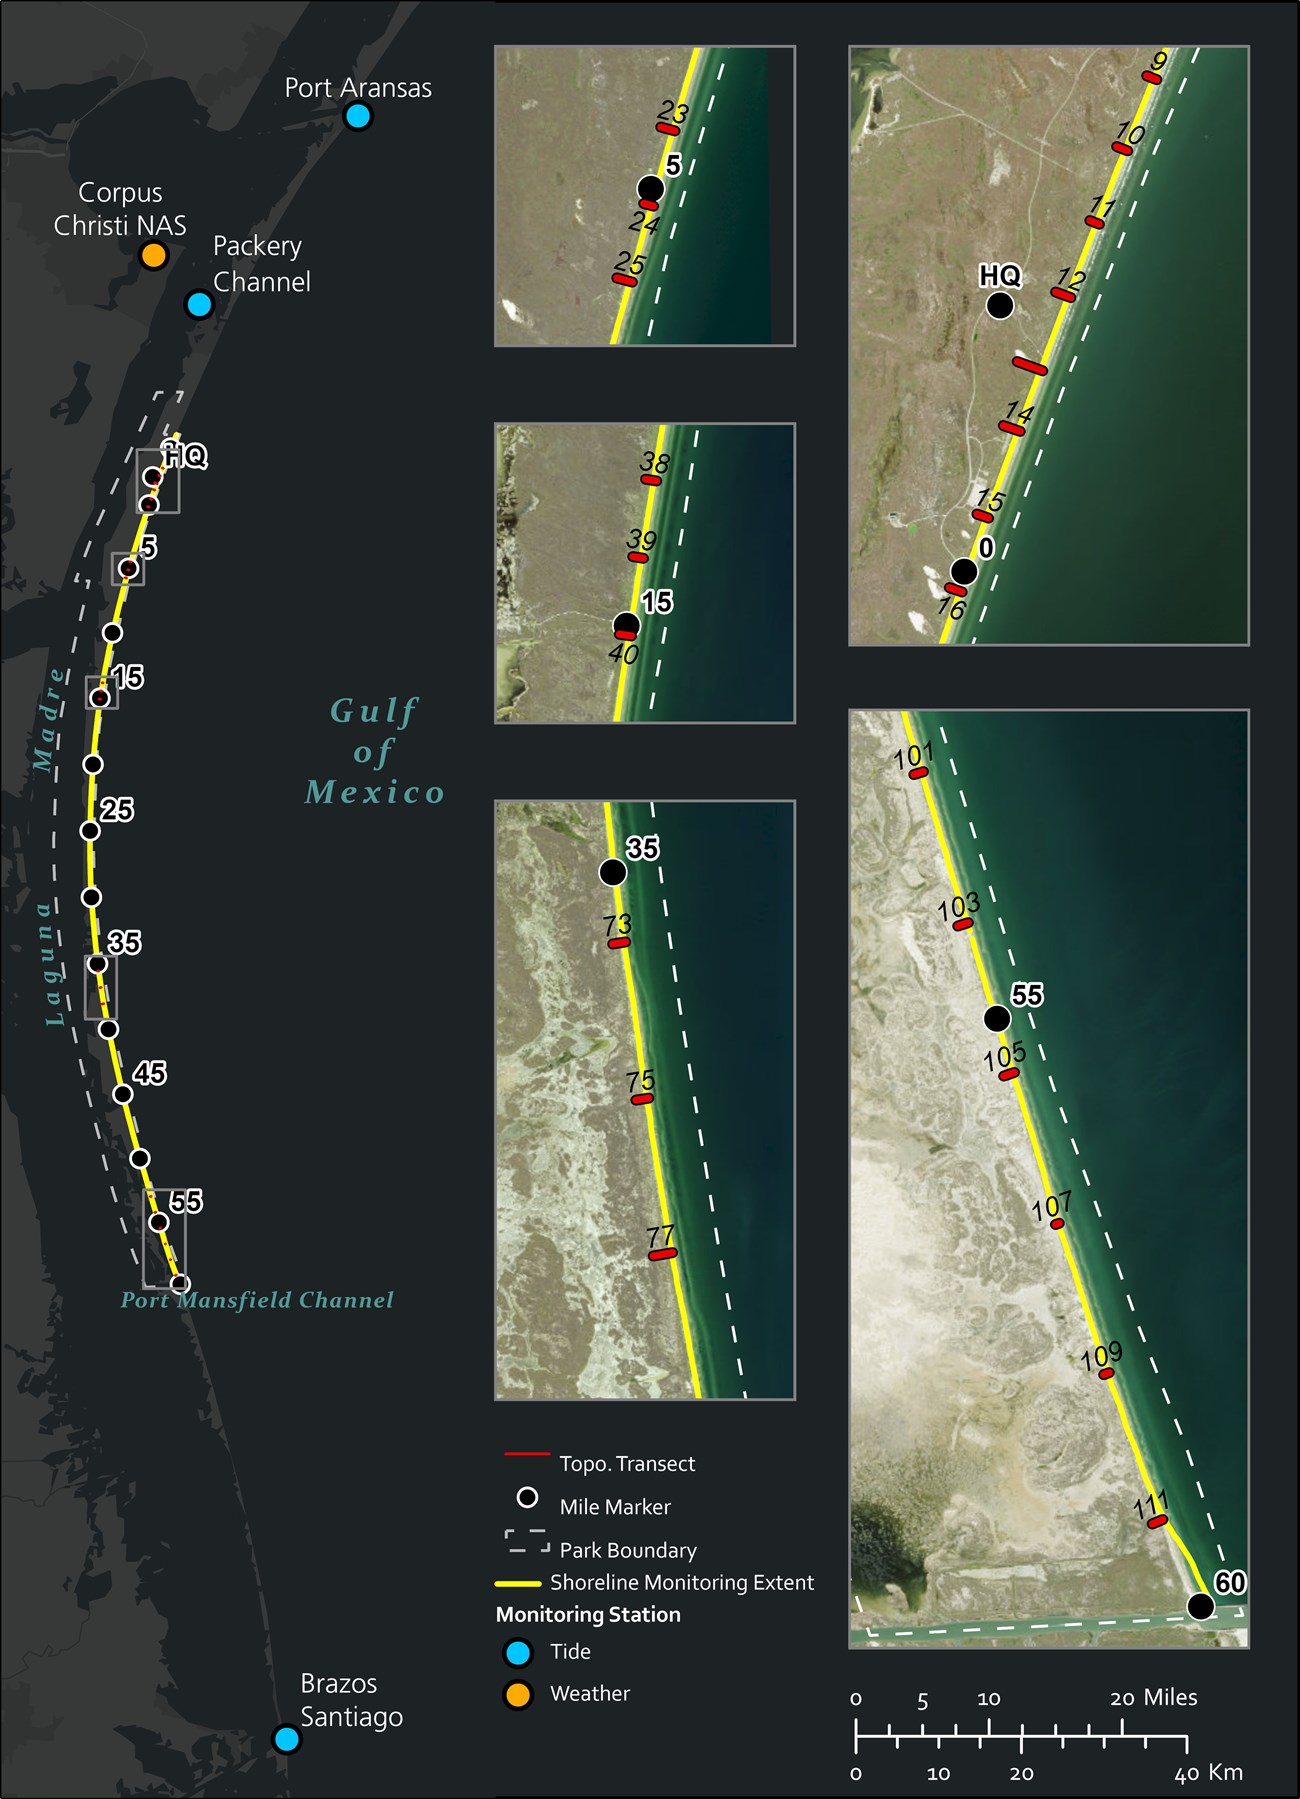
Padre Island National Seashore (PAIS) was established in 1962 and consists of approximately 52,609 hectares [130,000 acres] of land and water. The National Seashore encompasses most of north Padre Island, which is separated from south Padre Island by Port Mansfield Channel. At 113 kilometers [70 mi] in length, the National Seashore is the longest stretch of undeveloped barrier island in the world, and ranges in width from 0.8 to 4.8 kilometers (Cooper et al. 2005). With the exception of Malaquite Beach, about 4.5 miles long, the beaches of PAIS are open to vehicular traffic. North Padre Island contains nearly half of Texas’s total sediment volume in beach and foredune systems above 1 m elevation (Paine 2021). The authorized boundary of the seashore includes not only the barrier island itself, but also portions of the Gulf of Mexico and the Laguna Madre. Figure 1 shows the extent of the GULN’s shoreline monitoring effort at PAIS, which begins at the northern Gulf-side boundary at North Beach and ends at Port Mansfield Channel, as well as locations of topographic transect survey locations.There are several aquatic and terrestrial ecosystems in PAIS. Beginning on the Gulf-side and going west to the Gulf Intracoastal Waterway, the park includes the nearshore waters, the foreshore (swash zone) and backshore (from high-tide line to dunes) on the beach, foredunes, vegetated flats behind the dunes with shallow fresh- or brackish-water ponds and marshes, back-island dunes in some areas, wind-tidal flats, and shallow, hypersaline seagrass beds in the lagoon. The interplay of climate, physiography, and geomorphology results in a landscape that is largely shaped by wind (Withers et al. 2004).
Weather and Water Levels
Shoreline position and dune topography are influenced by regular weather and tidal events, in addition to the more extreme conditions brought by hurricanes or other storms. To track tidal events, GULN uses data from the tide station at Port Aransas, which is relatively close to most park facilities and the most heavily visited northern parts of the park. The station is also in unsheltered Gulf waters and more representative of Gulf shore water levels than the inshore station at Packery Channel. Although the Port Aransas station is a logical primary choice for reporting, Figure 2 illustrates that high-water level occurrences vary across the park's geography. Notably, the Brazos Santiago station, south of PAIS, has substantially fewer high tide occurrences than stations north of the park.
Along with geomorphic change related to storm strength and frequency, park leaders must consider sea level rise in long-term management planning. Table 1 presents 2022 estimates of relative sea level trends assembled from NOAA (2023a) for three stations closest to the park. In all cases, the values are positive, indicating that water levels are rising, the land surface is subsiding, or some combination of those variables that cause land to become increasingly inundated. Across the three stations, mean sea level rise estimates average to 4.5 mm/year for the seashore. At a beach with a four percent slope, like Malaquite Beach, this rate of inundation would yield about 1.1 meters of horizontal shoreline change in the span of ten years.
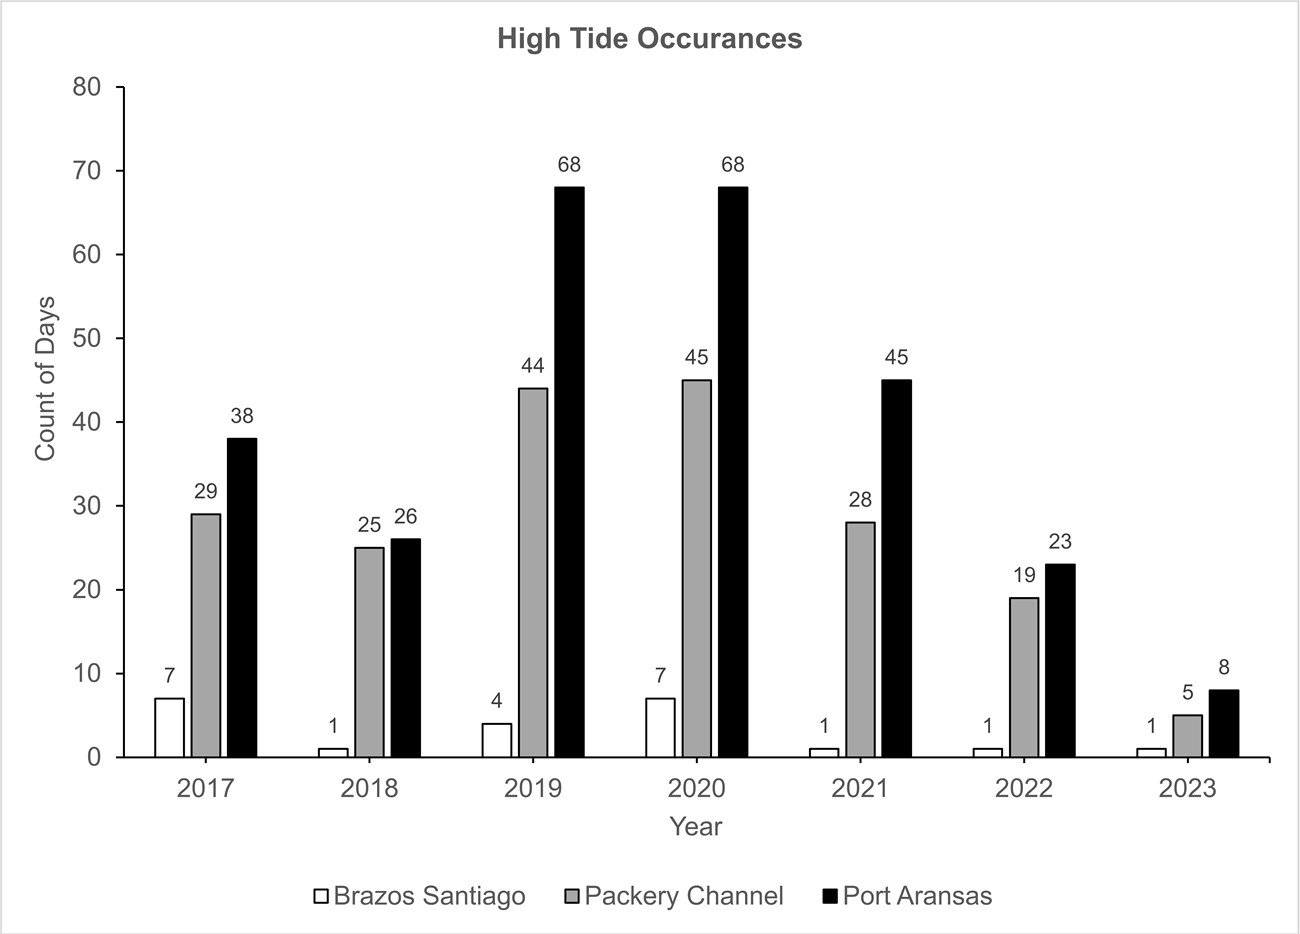
Table 1. Relative sea level trends at three stations near PAIS from NOAA (2023b). Mean Sea Level (MSL) is presented as gain in mm/year with 95% confidence interval
| Station ID | Station Name | Last Year | Year Range | % Complete | MSL Trends (mm/yr.) |
| 8775870 | Corpus Christi | 2022 | 40 | 97 | 5.48 (+/- 0.98) |
| 8778490 | Port Mansfield | 2022 | 60 | 90 | 3.69 (+/- 0.66) |
| 8779748 | South Padre Island | 2022 | 65 | 54 | 4.23 (+/- 0.51) |
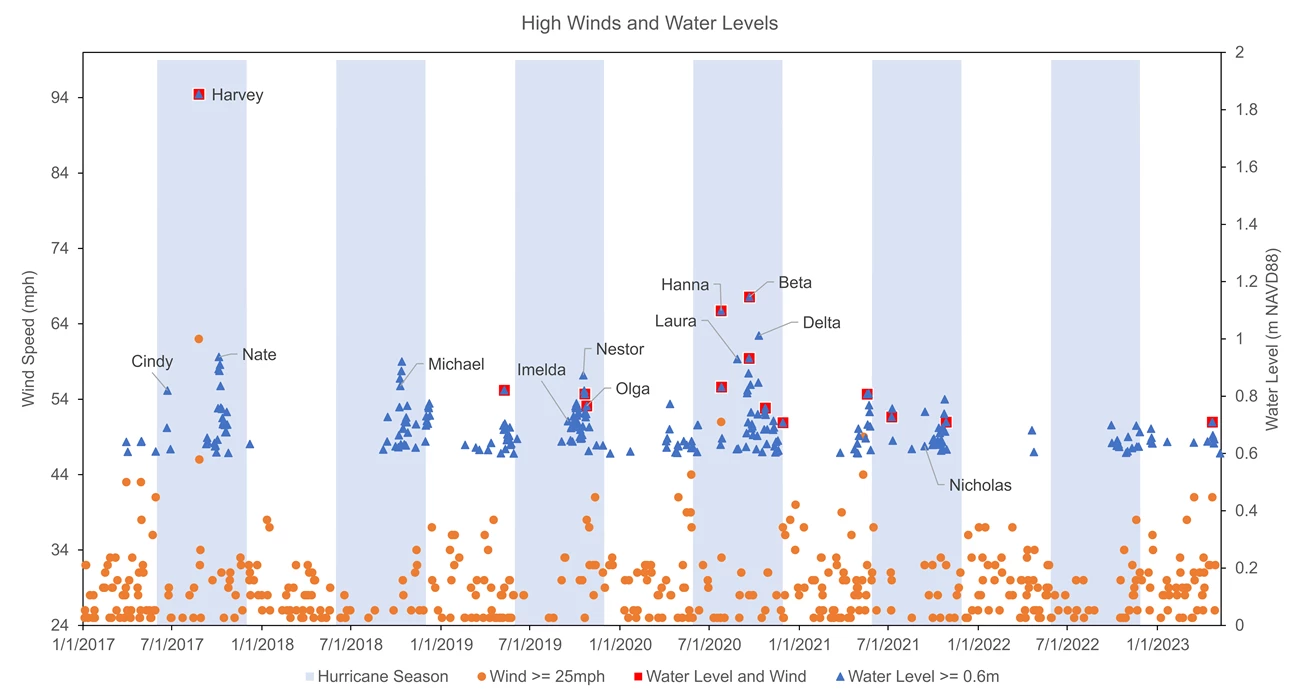
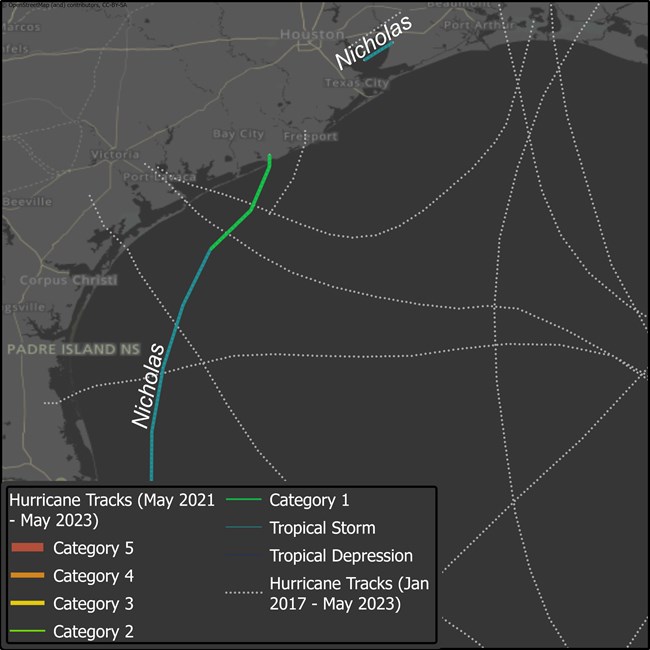
A record of high wind and high-water level events starting in 2017 is presented in Figure 3. A noticeable peak in tropical storm activity occurred in 2019 and 2020, followed by diminishing storm occurrences through spring 2023 surveys (NOAA 2023b, NOAA 2023a). Between the 2023 and 2021 GULN geomorphology monitoring surveys, only Hurricane Nicholas skirted the Park, about 50 miles offshore, in mid-September 2021 (Figure 4). Impacts from Nicholas were minimal, with winds just over 30mph and water levels between 0.6m and 0.7m NAVD88. Details about previous weather and high tide events dating back to 2017 are available in Bracewell (2021) and Bracewell (2022).
Human Impacts on Geomorphology
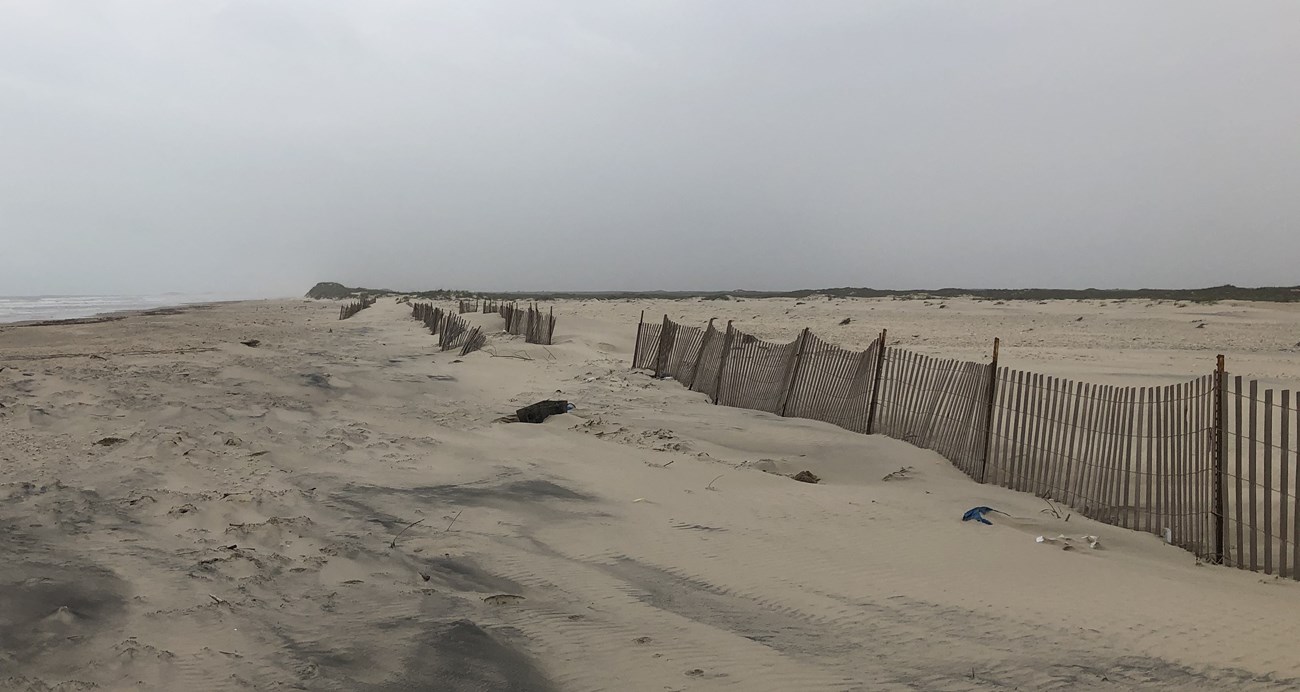
National seashore landforms are protected from most forms of human modification, but there are exceptions. For example, the park regularly undertakes projects to modify landforms in beneficial ways, such as beach building with dredge material and restoration fencing or planting. The last dredging project at Port Mansfield Channel was completed in early 2021; see Bracewell (2022) for details on how the dredge material resulted in an immediate and substantial increase in the surrounding beach area, as reflected in the 2021 shoreline position data. Around the same time, the park began dune restoration work at washover zones on the southern end of the park near Port Mansfield Channel. In the late summer of 2020 and spring and summer of 2021, fencing and bollards were placed at six locations, two of which are near transects 107 and 109 (Figure 5).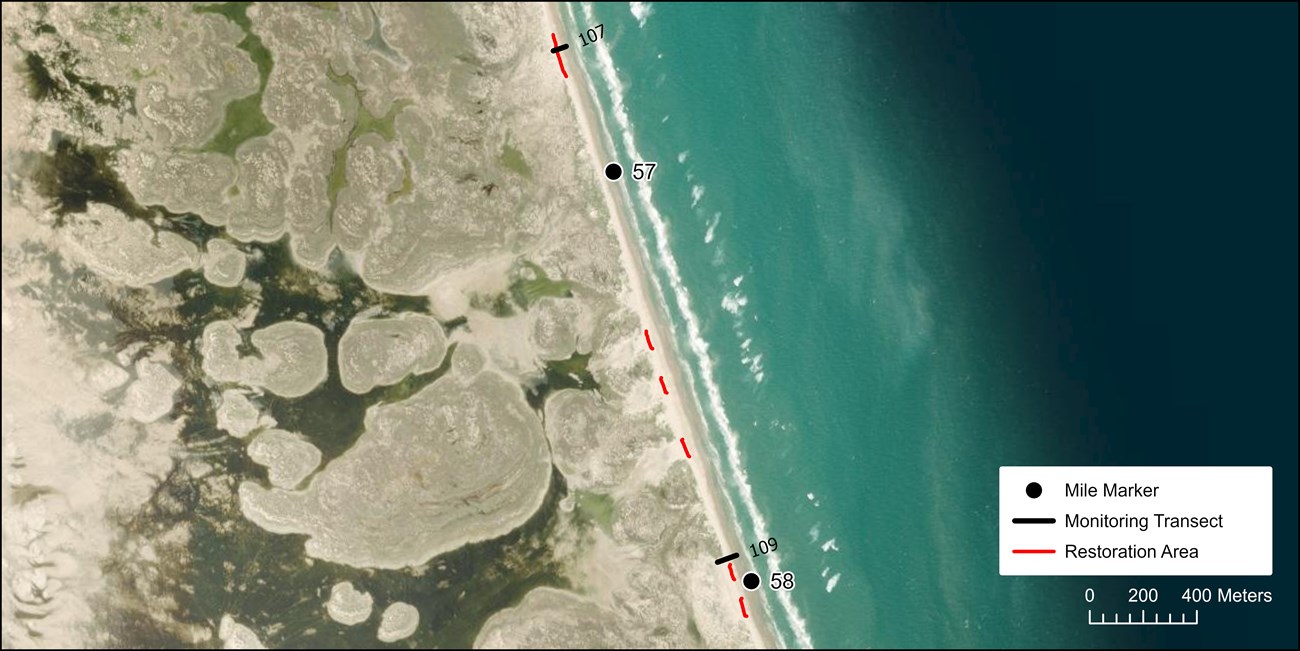
Methods
Sampling Schedule and Field Methods
All GULN coastal geomorphology surveys, including the most recent event, follow the sampling schedule and methods as published in Bracewell (2017a,b). To summarize, all fieldwork is scheduled to coincide with neap tide periods in April and May of every other year. Neap tides are the two periods per month when high and low tides are the least different. For a given survey season, these periods are determined based on predicted water levels using the closest NOAA monitoring station at Port Aransas (NOAA 2019). Although lower water levels make surveying lower beach elevations easier, the topographic survey is not dependent on neap tides to produce comparable results.To measure topography, groups of cross-shore virtual transects are projected along the seashore at areas of high park management interest or are coincident with other GULN monitoring projects. A crew member walks along each transect and records elevation, longitude, and latitude on precision GNSS equipment at topographic inflections in the beach and primary dune complex. These x, y, and z coordinates are plotted as profiles for documentation and comparison (Bracewell 2017a). To record shoreline position, a crew member walks or drives the high tide swash line with a handheld or utility task vehicle (UTV)-mounted GNSS unit. A wet/dry border in the sand, shell hash, or other debris generally marks the swash line. Positional data are differentially corrected during post-processing, and results are exported into a standard GIS format. As for topographic data, these positional data are also compared across time to determine change (Bracewell 2017b). The coastal geomorphology fieldwork for 2023 was completed on April 17-April 20 for topography and May 1 for shoreline position (1:45pm -5:30pm). For the shoreline position survey, the previous high tide occurred at 1:00pm on the same day. Pre and Post survey horizontal accuracies for the shoreline survey were 0.026m and 0.046m. For the topography survey, the horizontal and vertical accuracies were equal to or better than 0.055m and 0.039m, respectively.Shoreline Change Rate Calculations
To calculate shoreline position change, GULN uses the Digital Shoreline Analysis System (DSAS; Theiler et al. 2008). This approach compares shoreline position over time at spatially fixed cross-shore transects distributed every 50 meters. Annual shoreline change rates are calculated using the End Point Rate (EPR) method. The EPR method calculates the movement between the oldest and most recent shorelines and divides distance by the time between the surveys. Five-mile-long sections are averaged to help communicate regional changes in shoreline position. For the purposes of this report, GULN focuses on change over two temporal scales: longer-term change (2017–2023) and recent-change (2021–2023). Mean shoreline position values for each 5-mile section are also presented unmodified by year of data collection (2017, 2019, 2021 and 2023) to assist in visualizing change over time.Topographic Measurements and Change Calculations
Dune topography profiles are structured to originate at a physical or virtual benchmark (0.0 meters horizontal), which is located behind the foredune complex. Measurements are taken in the active part of the beach/ dune system, and so they do not always extend to the origin. To quantify dune features and measure change, four main metrics are calculated from the profile: Distance to Dune Crest (referring to the foredune crest), Dune Crest Elevation, Distance to 0.0m NAVD 88 and Profile Area (see examples of each metric in Figure 7). Profile area is the two-dimensional area under the profile measured to 0.0 NAVD 88. Of these four metrics, one is not covered in detail in the current report. This metric is distance to ‘0.0 NAVD 88’, which is useful measurement for determining beach width and shoreline position but is redundant in the current report because of the co-presentation of a continuous shoreline position summary. This metric will nevertheless likely be useful in longer-term and more comprehensive trend reports.To estimate change over time in dune topography, metrics from each topographic profile are compared across years. Negative numbers for change represent landward retreat or lower elevations. Change in profile area for each transect is calculated as [(final area-initial area)/initial area], and overall change across all transects in a unit is calculated as [(∑final area- ∑initial area)/∑initial area]. Graphical depictions of each profile in each year are provided in a supplemental materials document.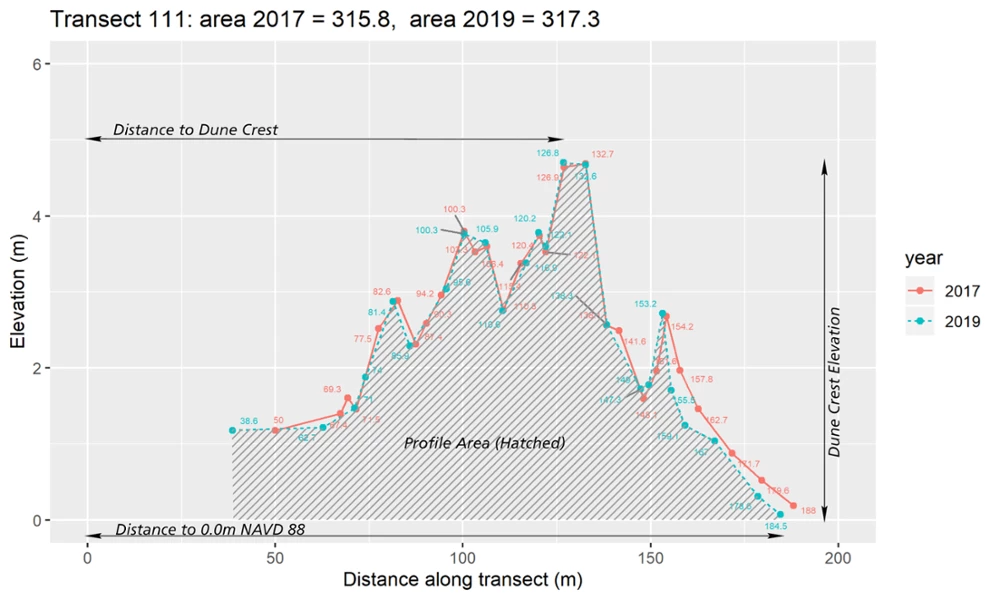
Project Maintenance Activities
High accuracy land surveying requires a framework of established geodetic benchmarks to ensure positional accuracy. A number of these benchmarks exist along the extent of the seashore to aid the GULN in geomorphic surveys. Benchmarks require intermittent long-term observations to ensure that their positions are stable. Benchmark repair or replacement may also occur if they are unstable or damaged. General maintenance by the GULN on the geodetic network at PAIS in 2023 included one long-term static observation on the transect 15 benchmark. Additionally, two benchmarks were moved 100+ meters landward into a more geologically stable environment, in response to damage incurred during hurricane Hanna.Results
Shoreline Change
Over the recent-term at PAIS (2021 and 2023), shoreline advance was estimated at 2.63 m per year (+/- 0.57 m), based on the End Point Rate (EPR) method for shoreline change calculation (see Appx. 1 in Appendices for full EPR output). Only 4% of transects exhibited retreat, whereas 59% exhibited advance and 37% exhibited no change. Except for the MM 55 to 60 section adjacent to Port Mansfield Channel, all other sections report shoreline advance from 2021 to 2023. For this same period, shoreline position at North Beach and Closed Beach sections advanced the most at 4 and 6 m/year, respectively (Appx. 2 in Appendices). The slight shoreline retreat of 0.59 m/year at Port Mansfield Channel is likely due to sediment moving upslope following a dredging project completed in early 2021. The account of upslope sand migration is strengthened by substantial gains in topographic area at transects 109 and 111, presented in the next section.Over the longer term (2017 to 2023), shoreline advance was considerably more modest at 0.11 m per year (+/- 0.19 m) according to the EPR method. Beginning at MM 15 through most 5-mile sections further south, 2023 shoreline positions captured more land than they did in 2017, which resulted in a slight, seashore-wide advance in mean shoreline position from 2017 to 2023 (Figure 8A). When considering shoreline position across all four years, it is notable that certain sections of the seashore are more stable than others. Figure 8A shows that the standard deviation ranges across years from just 2.1 m at MM 20-25 to 11.9 m at MM 55-60. The sections from MM 20 to MM 35 stand out for their relative stability over time, with standard deviations ranging from 2.1 to 2.4 m/year. This section occurs about halfway along the length of the seashore where the beach is narrow, as shown in Figure 8B. Narrower Beaches tend to indicate a steeper beach slope and, accordingly, less positional variation. Maps of shoreline change are available in Supplemental Materials (SM 1) and present EPR from 2017 to 2023 for the entire seashore.
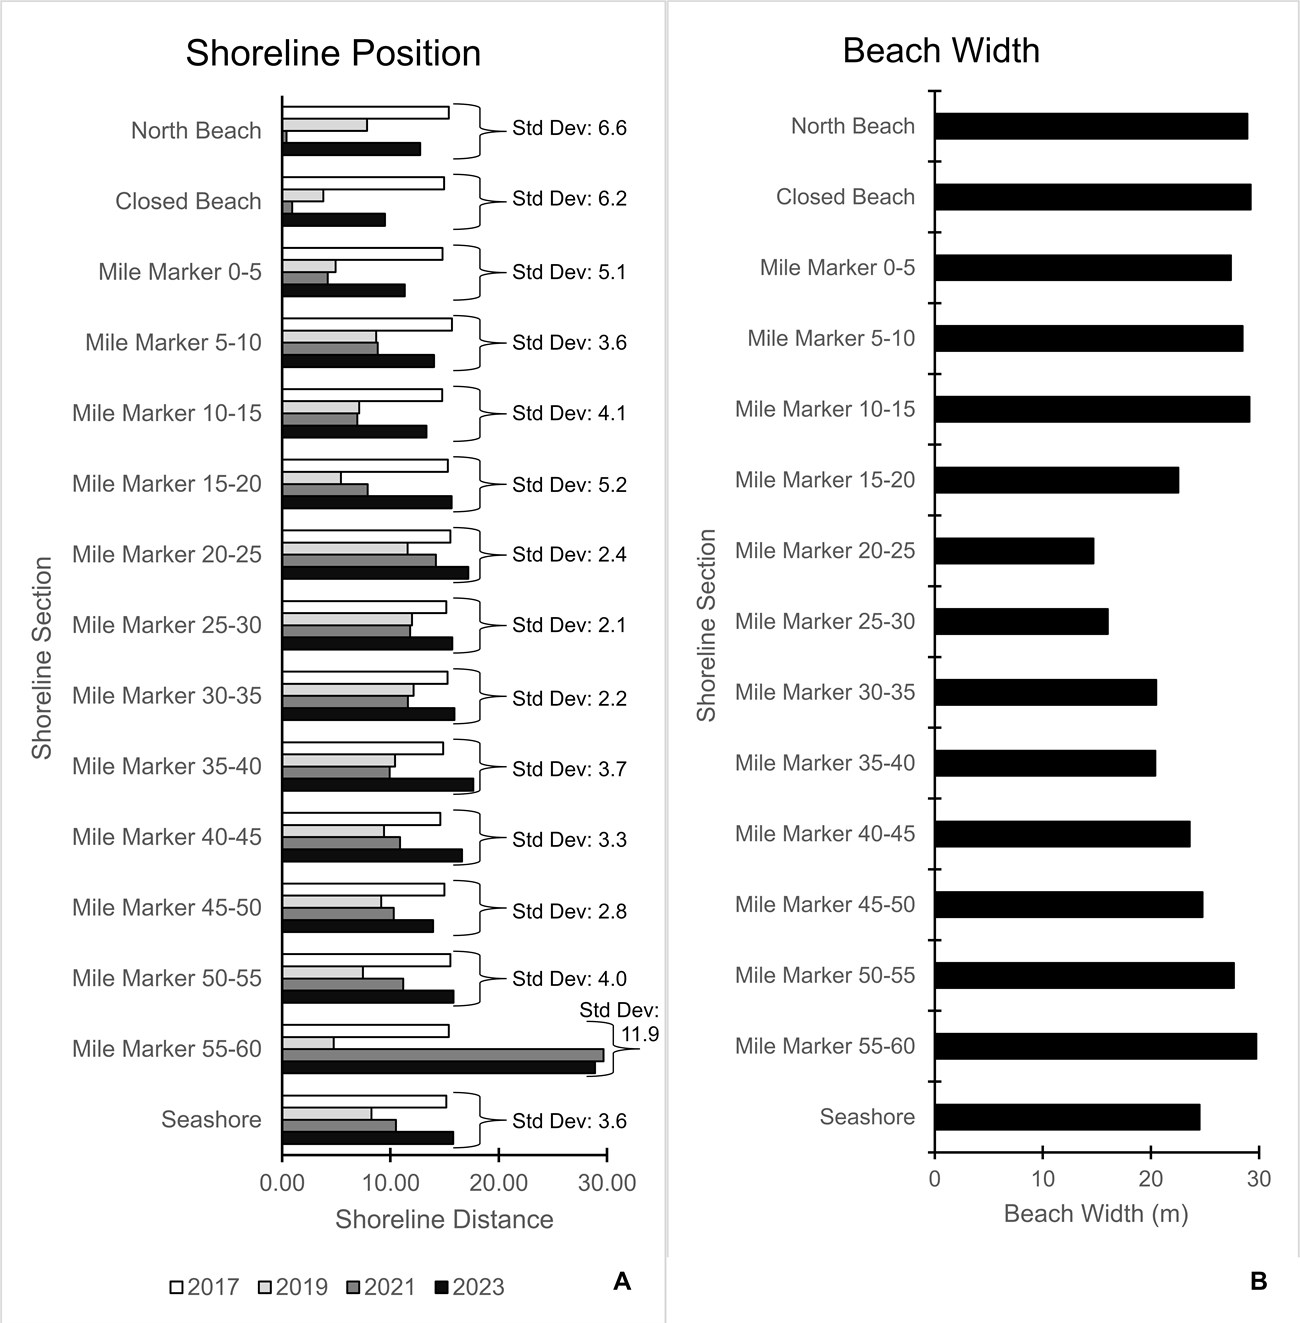
Figure 8. A - Average change in shoreline position, measured in meters, within sections of beach by year. Within a section, the more a bar in the graph extends to the right, the more seaward the shoreline position is. Standard deviation measures between-survey variability. B - Beach width is defined as the horizontal measurement between the 0.0 and 1.3m NAVD 88 elevation contours, derived from a 2018 LiDAR Digital Elevation Model (USGS 2023).
Coastal Topography Change
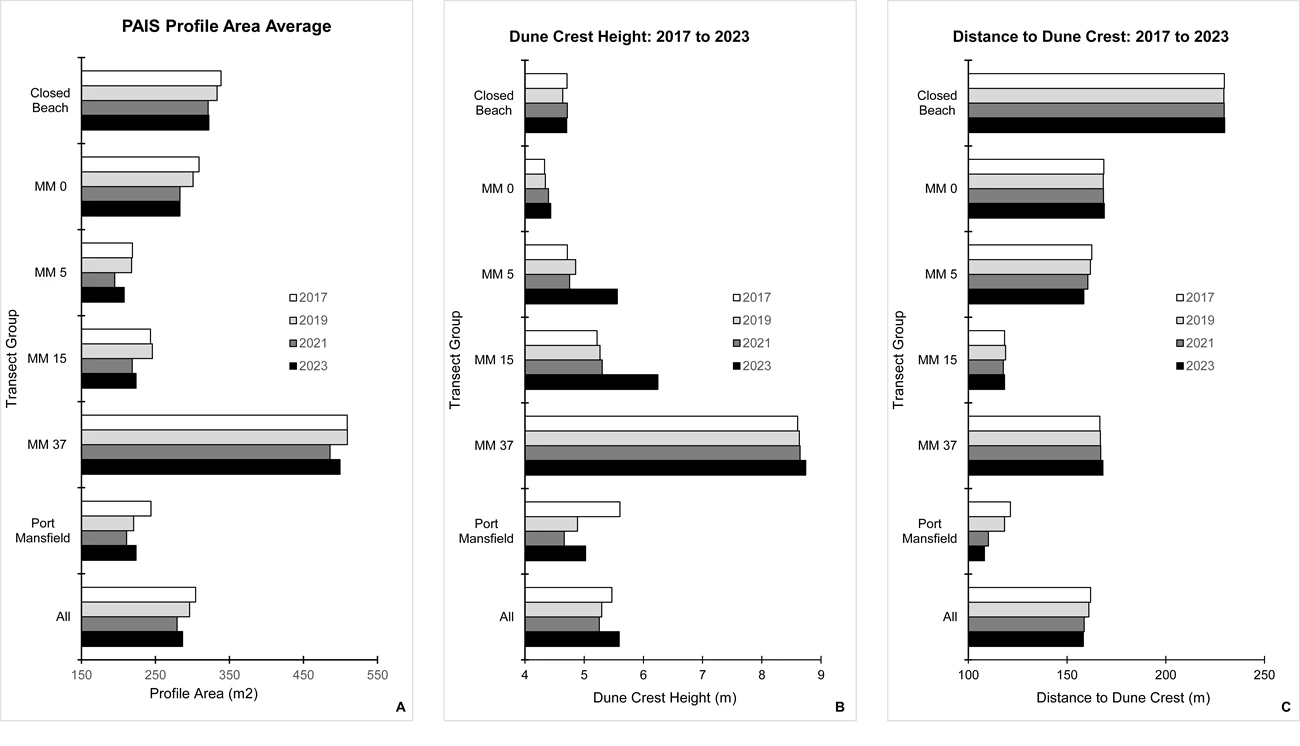
Using profile area as the most comprehensive single assessment of geomorphic change over time, all transect groups lost sediment over the long-term (2017-2023; Figure 9A). This pattern is apparent from the raw annual means (Figure 9), but losses can also be viewed as percent change ([final value-initial value]/initial value) as in table Appx. 3 in Appendices. Although there were losses over the project’s full duration, recent change (2021-2023) indicates stabilization or partial recovery within all groups and at the all-transects scale. Patterns for the two other focal topographic metrics used in this report were generally consistent with the findings for profile area. Dune crest height generally increased in both recent and long-term timescales, but these gains were balanced by a slight retreat of the dune crest’s position (Figure 9B, 9C).Like shoreline position change, there was variation in the degree of topographic change across the length of the seashore. The transect group at MM 37 was the most stable in long-term profile area change, with a loss of only 2%, and it ranked highly in recent change, with a 3% gain. Sensibly, the MM 37 group had the greatest total sediment volume overall, and its average dune crest height was 9.2 m as measured in 2023. The MM 0 group lost the most profile area in the long term and did not show the same recent gains that southern transect groups experienced. It is notable that this group of three transects is heavily influenced by transect 16, which is immediately south of Closed beach and marks the opening to beach driving on South Beach. Profile graphs, available in Supplemental Materials (SM 2), present topographic change from 2017, 2021 and 2023 for each of the 23 GULN monitoring transects at PAIS.
Additional Insights from Coastal Topography Monitoring
A closer examination of a few descriptive dune profiles can shed light on how changes in GULN’s focal metrics relate to overall dune morphology and development processes. Figure 10 presents an example of dune crest elevation gain and positional retreat at transect 38, which is representative of morphological change at several transects within the MM 5 and MM 15 groups. As this example shows, sediment that was stored in incipient dunes has reorganized into taller foredune crests, but with an overall loss of profile area.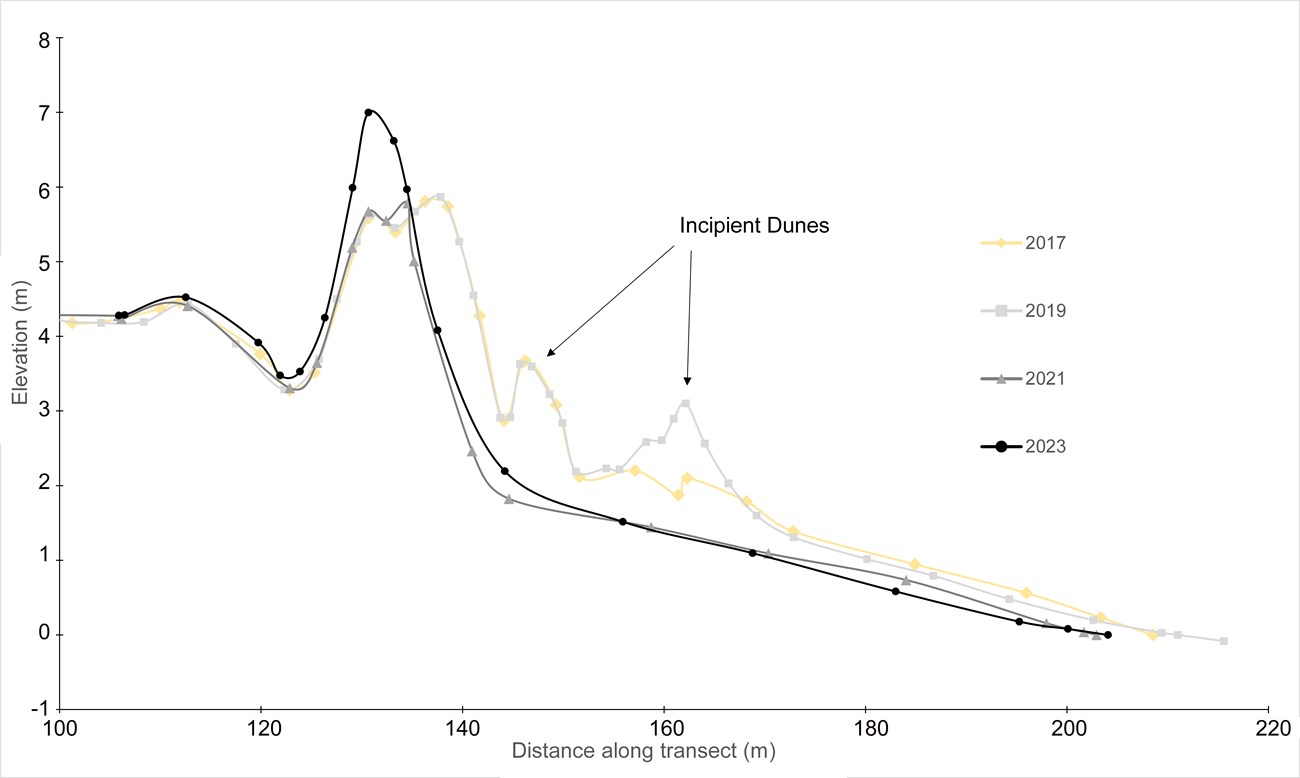
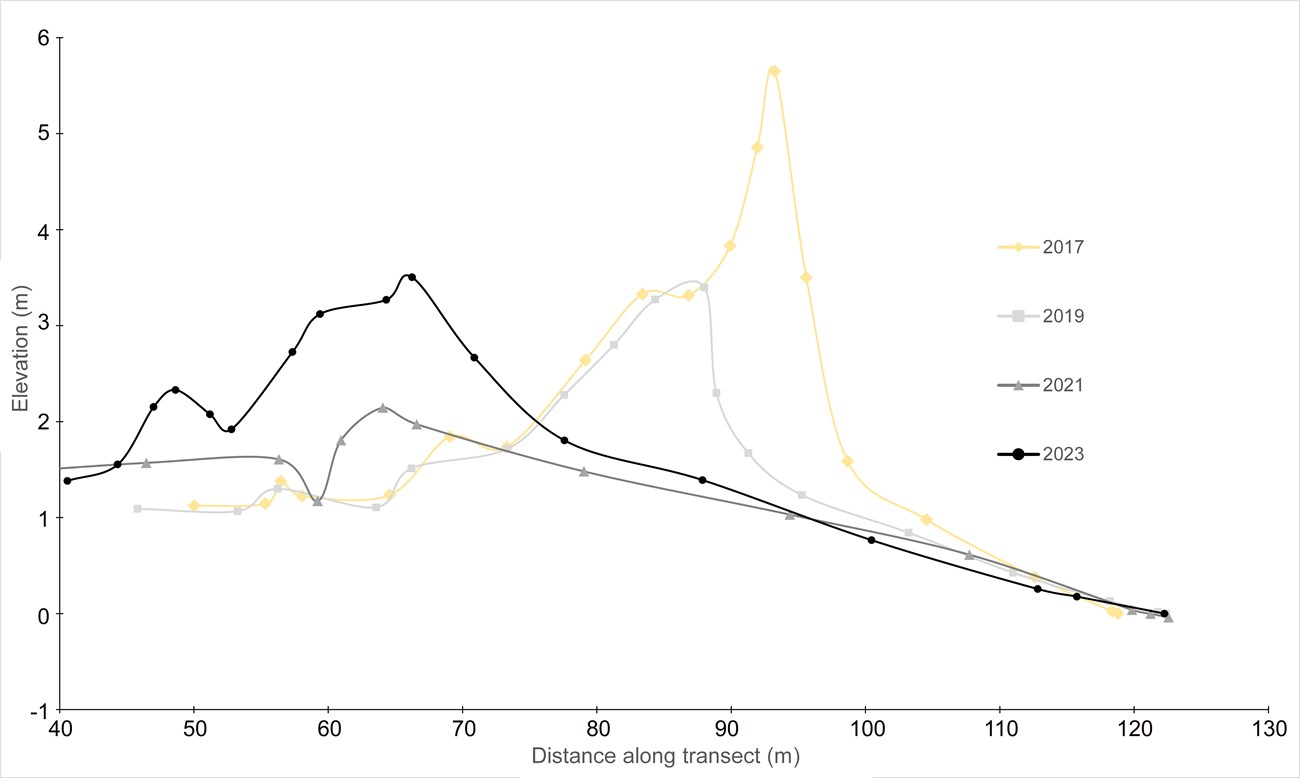
In another example, Figure 11 shows reorganization of a dune along the margin of a washout at transect 109. The rate of recovery there has been increased because of the protection and restoration work highlighted in Figures 5 and 6. Nearby and spatially overlapping with restoration work, transect 107 also saw a gain in dune crest height and profile area from 2021 to 2023. Overall gains in dune crest height and profile area are counterbalanced with net dune crest positional retreat and a loss in profile area for the longer-term 2017 to 2023 period.
Conclusions
Padre Island National Seashore was extensively impacted by active 2017, 2019, and 2020 tropical storm seasons. Since then, the park has had far less exposure to high tide flood events and has accumulated sand in the subaerial beach and foredune zones. Although the positive recent- and longer-term shoreline advance rates suggest a recovering and relatively stable seashore (2.36 m/yr. for 2021-2023 and 0.11 m/yr. for 2017-2023), these findings are slightly at odds with a longer-term retreat rate of 0.77 m/year from the 1930s to 2019, reported in Paine (2021). A potential driver of this recent shoreline advance is related to the overall loss of topographic profile area over the same period. Profile graphs show a slow and often absent recovery of incipient dunes that could be related to wide beaches and shoreline advance; essentially, a flattening and spreading of the beach sediment. While this seems a reasonable explanation, the addition of future surveys will help reveal the temporal regularity of incipient dunes and the relationships between profile area, shape, and shoreline position with more confidence.Although this report’s findings did not show shoreline position and topographic measurements advancing in tandem over the project’s full duration, there was broad agreement in the degree of change across early and late time steps. Specifically, there was a loss in profile area and a retreat in shoreline position between 2017 and 2021, and this was followed by gains in profile area and advance in shoreline position from 2021 to 2023. This recent period of recovery in the beach and foredune is almost certainly related to the calm tropical storm seasons of 2021 and 2022. Aiding in the overall recovery, restoration efforts near Port Mansfield Channel appear to be trapping sediment, and the vegetation there is re-establishing.
This is the third in a continuous series of every-other-year reports related to monitoring shoreline and topographic change at Padre Island National Seashore. Geomorphology surveys and reporting at PAIS will be repeated in 2025. It is expected that future reports will benefit from the accumulation of data sets, allowing for better interpretation of the measurement variation attributed to geomorphic differences (e.g., slope), as well as weather, seasonal and tidal differences.
Literature Cited
Bracewell, J. 2017a. Monitoring coastal topography at Gulf Coast Network parks: Protocol implementation plan. Natural Resource Report NPS/GULN/NRR—2017/1522. National Park Service, Fort Collins, Colorado. Available at: https://irma.nps.gov/DataStore/Reference/Profile/2244086 (last accessed November 2021).
Bracewell, J. 2017b. Monitoring shoreline position at Gulf Coast Network parks: Protocol implementation plan. Natural Resource Report NPS/GULN/NRR—2017/1501. National Park Service, Fort Collins, Colorado. Available at: https://irma.nps.gov/DataStore/Reference/Profile/2243708 (last accessed October 2021).
Bracewell J. 2021. Shoreline change at Padre Island National Seashore, Texas: 2017–2021 data summary. Natural Resource Data Series. NPS/GULN/NRDS—2021/1339. National Park Service. Fort Collins, Colorado. https://doi.org/10.36967/nrr-2289824.
Bracewell J and Carlson J. 2022. Coastal topography change at Padre Island National Seashore, Texas: 2017–2021 data summary. Natural Resource Data Series. NPS/GULN/NRDS—2022/1347. National Park Service. Fort Collins, Colorado. https://doi.org/10.36967/nrds-2293032.
Cooper, R. J., G. Sundin, S. B. Cederbaum, and J. J. Gannon. 2005. Natural resource summary for Padre Island National Seashore (PAIS). Final report to National Park Service Gulf Coast Network. Available at: https://irma.nps.gov/DataStore/Reference/Profile/590835 (last accessed November 2021).
National Park Service (NPS) Geologic Resources Inventory (GRI) program. 2012. Unpublished Digital Geologic Map of Padre Island National Seashore and Vicinity, Texas (NPS, GRD, GRI, PAIS, PAIS digital map) adapted from a Texas Bureau of Economic Geology map and digital data by Gibeaut and Tremblay (2005).
National Oceanic and Atmospheric Administration (NOAA). 2023b. The Center for Operational Oceanographic Products and Services. Available at: tidesandcurrents.noaa.gov (last accessed September 2023).
National Oceanic and Atmospheric Administration (NOAA). 2023a. NOAA National Centers for Environmental Information, Local Climatological Data Station Details. Available at: ncdc.noaa.gov/cdo-web/datasets/LCD/stations/WBAN:12926/detail (last accessed September 2023).
Paine, J., T. Caudle, J. Andrews. 2021. Shoreline Movement and Beach and Dune Volumetrics Along the Texas Gulf Coast, 1930s to 2019. Final Report Prepared for the General Land Office under Contract No. 16-201-000, Work Order No. B428 CEPRA Project No. 1662. Bureau of Economic Geology, University of Texas at Austin.
Psuty, N. P., T. M. Silveira, M. Duffy, J. P. Pace, and D. E. Skidds. 2010. Northeast Coastal and Barrier Network geomorphological monitoring protocol: Part I—ocean shoreline position. National Park Service, Fort Collins, Colorado. Available at: https://irma.nps.gov/DataStore/Reference/Profile/664308 (last accessed November 2021).
Psuty, N. P., T. M. Silveira, A. J. Spahn, and D. Skidds. 2012. Northeast Coastal and Barrier Network geomorphological monitoring protocol: Part II - coastal topography. Natural Resource Report NPS/NCBN/NRR—2012/591. National Park Service, Fort Collins, Colorado. Available at https://irma.nps.gov/DataStore/DownloadFile/604476 (last accessed October 2023).
Segura MR, Woodman R, Meiman J, Granger WJ, Bracewell J. 2007. Gulf Coast Network Vital Signs Monitoring Plan. Natural Resource Report. NPS/GULN/NRR—2007/015. National Park Service. Fort Collins.
U. S. Army Corps of Engineers (USACE). 2014. Fact Sheet as of September 24, 2014; Channel to Port Mansfield, TX. Available at: https://www.swg.usace.army.mil/Portals/26/docs/PAO/Channel%20Mansfield.pdf (last accessed November 2021).
Withers, K., E. H. Smith, O. Gomez, and J. Wood. 2004. Assessment of coastal water resources and watershed conditions at Padre Island National Seashore, Texas. Technical report NPS/NRWRD/NRTR—2004/323. Available at: https://irma.nps.gov/DataStore/Reference/Profile/658056 (last accessed November 2021).
U.S. Geological Survey (USGS). 2023. 1-meter Digital Elevation Models (DEMs) - USGS National Map 3DEP Downloadable Data Collection: U.S. Geological Survey.
Summary Tables
Appx. 1. Digital Shoreline Analysis System (DSAS) report for shoreline position change at Padre Island National Seashore from 2017 to 2023 and 2021 to 2023.
| Park Section | Transect Count | EPR Min : Max 2017-2023 | EPR Average 2017-2023 | EPR Standard Deviation 2017-2023 | EPR Min : Max 2021-2023 | EPR Average 2021-2023 | EPR Standard Deviation 2021-2023 |
|---|---|---|---|---|---|---|---|
| North Beach | 36 | -1.36 : 0.50 | -0.39 | 0.58 | 2.96 : 09.02 | (max) 6.23 | 1.52 |
| Closed Beach | 146 | -2.67 : 1.04 | (min) -0.92 | 0.70 | -1.26 : 10.16 | 4.31 | 2.15 |
| MM 0-5 | 161 | -3.07 : 1.06 | -0.59 | 0.79 | -2.74 : 08.31 | 3.59 | 2.32 |
| MM 5-10 | 161 | -2.56 : 1.50 | -0.28 | 0.78 | -2.04 : 06.92 | 2.61 | 2.00 |
| MM 10-11 | 160 | -2.00 : 1.87 | -0.25 | 0.79 | -0.39 : 08.66 | 3.21 | 1.78 |
| MM 15-20 | 161 | -1.85 : 1.45 | 0.06 | 0.77 | -0.65 : 08.54 | 3.90 | 2.26 |
| MM 20-25 | 160 | -0.76 : 1.77 | 0.28 | 0.45 | -2.09 : 05.89 | 1.50 | 1.43 |
| MM 25-30 | 161 | -1.26 : 1.74 | 0.09 | 0.66 | -2.99 : 06.40 | 1.96 | 2.11 |
| MM 30-35 | *161 | -2.66 : 2.36 | 0.11 | 1.08 | -3.98 : 08.58 | 2.14 | 2.68 |
| MM 35-40 | 160 | -2.12 : 4.29 | 0.47 | 1.30 | -4.68 : 12.71 | 3.88 | 3.19 |
| MM 40-45 | 161 | -2.12 : 3.24 | 0.34 | 1.05 | -4.97 : 10.17 | 2.88 | 3.23 |
| MM 45-50 | 161 | -3.94 : 3.44 | -0.17 | 1.41 | -6.89 : 11.39 | 1.83 | 3.75 |
| MM 50-55 | *161 | -3.04 : 3.34 | 0.05 | 1.52 | -7.28 : 10.89 | 2.27 | 3.35 |
| MM 55-60 | 157 | -3.33 : 26.1 | (max) 2.29 | 5.25 | -42.8 : 19.80 | (min) -0.59 | 12.64 |
| Seashore | **2107 | -3.94 : 26.1 | 0.11 | 1.86 | -42.8 : 19.80 | 2.63 | 4.45 |
Appx. 3. Summary of topographic profile dimensional change between 2017 and 2023, and 2021 and 2023. Negative numbers represent landward retreat, loss of elevation, or profile area loss. The minimum and maximum values for group averages are noted.
| Transect ID | Dune Crest Dist. 2017 - 2023 | Dune Crest Ht. 2017 - 2023 | Distance to '0' 2017 - 2023 | Profile Area 2017 to 2023 | Dune Crest Dist. 2021 to 2023 | Dune Crest Ht. 2021 to 2023 | Distance to '0' 2021 to 2023 | Profile Area 2021 to 2023 |
| Transect 9 | 1.21 | -0.10 | -7.52 | -5.9% | 0.22 | -0.02 | -5.87 | -1.98% |
| Transect 10 | 0.01 | 0.08 | -12.60 | -4.2% | -0.01 | 0.01 | -6.43 | -1.16% |
| Transect 11 | -0.13 | -0.04 | 5.08 | -5.4% | -0.10 | -0.01 | 13.41 | 3.53% |
| Transect 12 | -0.14 | -0.02 | -5.80 | -4.5% | 0.80 | -0.04 | -0.51 | 1.77% |
| Transect 13 | -0.11 | 0.05 | 3.31 | -4.8% | 0.31 | 0.00 | -2.53 | 0.50% |
| Average (Closed Beach) | 0.17 | -0.01 | -3.50 | -4.9% | 0.25 | (min) -0.01 | -0.38 | 0.29% |
| Transect 14 | -0.10 | 0.14 | -8.36 | -13.1% | 0.21 | 0.02 | 3.63 | 0.76% |
| Transect 15 | 0.56 | 0.25 | -9.84 | -7.7% | 2.06 | 0.12 | -4.37 | 0.42% |
| Transect 16 | 0.28 | -0.07 | 0.19 | -7.0% | -0.91 | -0.03 | 5.77 | -0.48% |
| Average (MM 0, GULN Veg. Mon. Panel 8) | 0.25 | 0.11 | (min) -6.00 | (min) -8.4% | 0.46 | 0.04 | (max) 1.68 | (min) -0.02% |
| Transect 23 | -6.92 | 0.27 | -11.21 | -20.2% | -5.17 | 1.04 | -6.83 | -0.95% |
| Transect 24 | -3.41 | 1.74 | 7.24 | -0.8% | -0.94 | 1.28 | 3.80 | 11.42% |
| Transect 25 | -1.87 | 0.53 | 4.79 | 1.1% | -0.12 | 0.11 | 0.73 | 6.28% |
| Average (MM 5, GULN Veg. Mon. Panel 18) | -4.07 | 0.85 | 0.27 | -5.1% | (min) -2.08 | 0.81 | -0.77 | (max) 6.46% |
| Transect 38 | -5.65 | 1.19 | 0.72 | -13.4% | -3.90 | 1.21 | 1.13 | 5.57% |
| Transect 39 | 5.60 | 1.68 | 1.84 | -8.5% | 5.40 | 1.57 | -0.07 | 3.96% |
| Transect 40 | 0.03 | 0.22 | -3.34 | -2.2% | 0.33 | 0.03 | -12.86 | -1.74% |
| Average (MM 15, GULN Veg. Mon. Panel 28 | 0.00 | (max) 1.03 | -0.26 | -8.1% | 0.61 | (max) 0.94 | -3.93 | 2.29% |
| Transect 73 | 2.99 | 0.58 | -0.07 | 7.0% | 2.93 | 0.48 | -21.22 | -0.21% |
| Transect 75 | 1.59 | -0.14 | 6.23 | -3.4% | 0.28 | -0.19 | 12.6 | 4.98% |
| Transect 77 | 0.23 | -0.03 | -17.92 | -7.4% | 0.35 | 0.00 | -8.25 | 2.76% |
| Average (MM 37, GULN Veg. Mon. Panel 38) | (max) 1.60 | 0.14 | -3.92 | (max) -1.9% | (max) 1.19 | 0.10 | (min) -5.62 | 2.77% |
| Transect 101 | -0.49 | -0.21 | 3.51 | -9.2% | -0.81 | 0.12 | 7.55 | 7.86% |
| Transect 103 | -4.20 | 0.09 | 15.93 | -3.8% | -2.20 | -0.15 | -7.51 | -0.79% |
| Transect 105 | -0.14 | 0.47 | -26.24 | -17.1% | -0.25 | 0.35 | -4.06 | -1.39% |
| Transect 107 | -46.50 | -1.71 | -20.75 | -55.2% | -10.89 | 0.50 | 2.09 | 4.26% |
| Transect 109 | -27.01 | -2.15 | 3.89 | -13.8% | 2.17 | 1.36 | 1.04 | 32.10% |
| Transect 111 | -0.13 | 0.03 | 32.96 | 21.8% | -0.12 | -0.02 | 3.60 | 11.25% |
| Average (Port Mansfield) | (min) -13.08 | (min) -0.58 | (max) 1.55 | -8.3% | -2.02 | 0.36 | 0.45 | 6.04% |
| Average (All Transects) | -3.67 | 0.12 | -1.65 | -5.8% | -0.45 | 0.34 | -1.09 | 2.71% |
Supplemental Materials
The full, online reference for this summary includes a pdf of the webpage and supplemental materials such as profile graphs and shoreline change maps.
Other reports in this series:
Coastal topography change at Padre Island National Seashore, Texas: 2017–2021 data summary: https://irma.nps.gov/DataStore/Reference/Profile/2293032
Shoreline change at Padre Island National Seashore, Texas: 2017–2021 data summary: https://irma.nps.gov/DataStore/Reference/Profile/2289824
Coastal topography change at Padre Island National Seashore, Texas: 2017–2019 data summary: https://irma.nps.gov/DataStore/Reference/Profile/2266890
Shoreline change at Padre Island National Seashore, Texas: 2017–2019 data summary: https://irma.nps.gov/DataStore/Reference/Profile/2266899
