Last updated: April 3, 2025
Article
Vegetation Monitoring at Natchez Trace Parkway: Results for 2021

NPS/Jane Carlson
Overview
Throughout the National Park Service, plant communities and other key natural resources are monitored as indicators of environmental health by a nationwide program of 32 Inventory and Monitoring (I&M) Networks. The Gulf Coast I&M Network covers eight National Park Service (NPS) units in the southeastern U.S. and Texas, including the Natchez Trace Parkway in Mississippi, Alabama, and Tennessee. The network's terrestrial vegetation monitoring program is carried out in all eight parks, with the goal of measuring the health and condition of key plant communities repeatedly over time. Specific objectives include documenting status and change in (1) richness of native and non-native species; (2) percent cover and frequency of key species or growth forms (e.g., graminoids or shrubs); and (3) the health and regeneration of forests. The network's vegetation monitoring program follows a published protocol that is largely consistent with other I&M networks in the eastern U.S.
Why Collect Long-Term Data on Plants in National Parks?
Plant communities are essential to much of what we treasure in National Parks, including the breathtaking views and iconic wildlife. In some cases, individual species are central to a park's identity, like joshua trees, saguaro cacti, pitcher plants, towering redwoods, and majestic live oaks. Keeping these and other park plants safe is the work of resource managers, yet their actions may be limited by information gaps. Environmental problems can be hard to detect without knowing the baseline condition and natural fluctuations over time. By collecting detailed vegetation monitoring data once every four years in long-term plots, scientists can learn if and how plant communities are changing and work to identify the causes. These findings, in turn, support park staff in their management decisions, so that these treasured resources remain available for future generations.
The Gulf Coast I&M Network conducts vegetation monitoring fieldwork once every four years in each park. This article presents a brief project overview and key findings from the first round of I&M vegetation monitoring on the Natchez Trace Parkway, conducted in 2021. The full summary for 2021 provides more in-depth descriptions of the study area, methods, species lists, richness summaries, patterns in understory and mid-story percent cover and relative frequency, and results for forest health and regeneration metrics. All current and past reports, as well as raw data exports, can be found through the online project repository.
Study Area and Methods
Thirty-two long-term plots were randomly distributed across five key sites along the Natchez Trace Parkway: Rocky Springs, MS (8 plots); Jeff Busby, MS (5 plots); Chickasaw Village, MS (4 plots); Colbert Ferry, AL (7 plots); and Meriwether Lewis, TN (8 plots). Four of the five focal sites were forested; Chickasaw Village was the only prairie-dominated site. The 32 plots were first visited during the winter months of 2018 and 2019 to install plot markers, tag trees, and assign broad vegetation classes. Crews returned to sample plots during the growing season of 2021, following the methods published by Carlson and others in 2018, in the protocol “Monitoring Terrestrial Vegetation in Gulf Coast Network Parks” and its 11 standard operating procedure documents. In short, all plant species were identified in each 400-meter2 (20 x 20 meter) plot, and their coverages and relative frequencies were recorded in nested sampling frames. Data were also collected on forest health, including tree growth, recruitment, and mortality. The first round of sampling was completed on 25 of the 28 forested plots and all 4 of the prairie plots. The remaining three forested plots were not sampled in 2021 due to logistical constraints, but they still had some data from the initial visit in 2019.
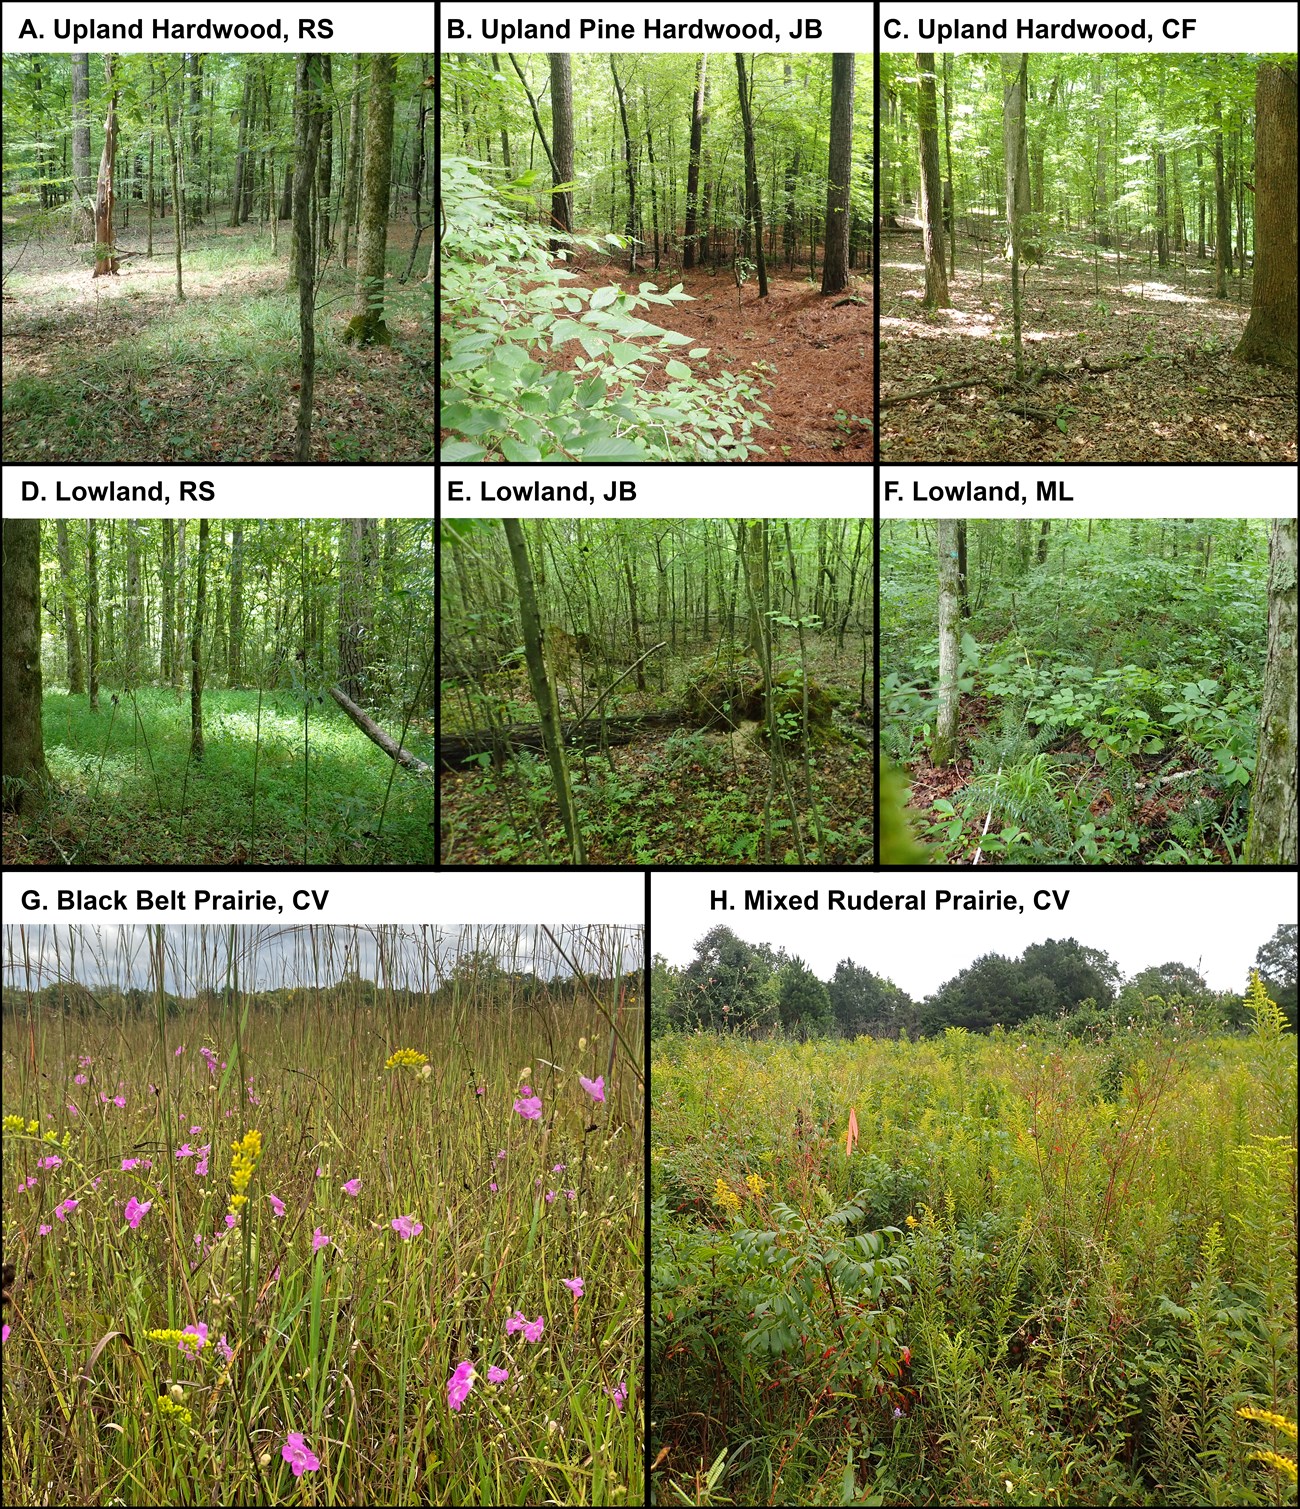
Plots were primarily grouped by site –Rocky Springs (RS), Jeff Busby (JB), Colbert Ferry (CF), Meriwether Lewis (ML), and Chickasaw Village (CV) –, as dictated by the original sampling design. Even so, each site encompassed a variety of plant communities, and all plots were grouped into one of five broad vegetation classes. Forest classes were Mesic Upland Hardwood Forest, Mesic Upland Pine-Hardwood Forest, and Lowland Hardwood Forest (including bottomlands, floodplains and streamsides). Examples of these classes are shown in Figure 1 A-F. The prairie plots were classified as either Black Belt Prairie (Figure 1G) or Ruderal Mixed Prairie (Figure 1H), the former having the Global Conservation Status Rank of critically imperiled.

Key Findings
Vegetation Communities Sampled
Each of the four forested sites targeted by I&M encompassed several different broad community types (Figure 2). The main community type sampled was Mesic Upland Hardwood Forest, represented in 17 of 28 plots. This was followed by Mesic Upland Pine-Hardwood Forest with 6 plots, and Lowland Hardwood Forest with 5 plots. In the prairie plots of Chickasaw Village, there was one plot in Black Belt Prairie and three plots in Ruderal Mixed Prairie. While these broad vegetation classes were a means of unifying plots with similar plant communities and landscape positions, the most informative way to summarize plots was by their study site, due to the large distances between sites.

Species Lists in Forest and Prairie
A total of 391 taxa were recorded during monitoring, and 307 of these were in the forested plots. The four prairie plots had 131 species in total, 36% of which were also recorded in the forested plots. Both forested and prairie plots had a low percentage of non-natives, at only 4% for forest and 6.5% for prairie. These percentages were based only on the 91-93% of taxa for which identifications were sufficiently complete to determine nativity. Appendix C in the full summary for 2021 includes the forest and prairie species lists, grouped by growth form. These lists also provide each species’ relative frequency within sites and across the Parkway as whole.
Most Common Plant Species, Relative Frequency, and Cover
In the forested sites, two native species were extremely widespread –i.e., found in all 25 plots with complete data for 2021. These were poison ivy (Toxicodendron radicans) and roundleaf greenbriar (Smilax rotundifolia). Of the tree species recorded, the three most widespread were also native: black cherry (Prunus serotina), winged elm (Ulmus alata) and sweetgum (Liquidambar styraciflua; see also Figure 3). Each occurred in 22-24 plots. Most of the non-native species on the forested plot list were not particularly widespread or dense, with the exception of Japanese stiltgrass (Microstegium vimineum), which was in 19 of 25 plots and had extensive understory coverage in one plot in Rocky Springs and two plots in Colbert Ferry (>45% mean coverage). The other widespread non-natives were Chinese privet (Ligustrum sinense, 15 plots) and Japanese honeysuckle (Lonicera japonica, 15 plots), but their estimated mean coverage in plots was never greater than 2%. Most native species also had low coverage in the understory and midstory of forested plots. The only two natives with ≥5% average coverage within plots in a given site were longleaf woodoats (Chasmanthium sessiflorum) at 10% cover in Rocky Springs, and slender woodoats (Chasmanthium laxum) at 5% cover in Meriwether Lewis.
For the prairie site, 10% of its recorded species were found in all four plots. The species with the greatest coverage was tall goldenrod (Solidago altissima) at 23%, and this was followed by partridge pea (Chamaecrista fasciculata) at 18% and little bluestem (Schizachyrium scoparium) at 15%. The only non-native in the top 20 for cover was Silky bushclover (Lespedeza cuneata), at 2.9%.
Species Richness Summaries
Across both forested and prairie plots, the Parkway had 64 species per plot on average (Table 1), which was 20-35 species higher than per-plot averages for most other parks monitored by the Gulf Coast I&M Network. Plots were not all uniformly rich, however (Table 1, Figure 2). Plot-level richness ranged from 106 species in a Meriwether Lewis plot to 31 species in a Colbert Ferry plot. Meriwether Lewis –the northernmost and richest site– had 190 species combined across plots, with more forbs and graminoids than the other forested sites. The next most species-rich site was Rocky Springs, at 153 species, followed by Jeff Busby at 134 species, Chickasaw Village at 131 species, and finally Colbert Ferry, at 99 species. Low richness at Colbert Ferry was associated with having fewer forb and grass species than other sites.
The species list for Chickasaw Village plots represented a distinct, graminoid-rich flora. As mentioned previously, only 36% of Chickasaw Village species were also found in forested plots. The three Ruderal Mixed Prairie plots were species rich and relatively similar to each other, with 62-67 species per plot (Table 1, Figure 2) and 24-26% of each plot’s species list unique to that plot. The Black Belt Prairie plot, in contrast, was relatively species poor and had less in common with other plots at the site. It had only 46 species, of which 50% were unique to that plot.
Table 1. Plant species richness averaged by plot or summed across each I&M targeted site on the Natchez Trace Parkway.
| Park Unit | Total Plots Assigned (Sampled in 2021) | Mean Species Richness (Min-Max) | Mean Non-Native Species Richness (Min-Max) | Total Richness per Site, All Plots Combined |
| Rocky Springs(RS) | 8 (8) | 73.5 (68 - 78) | 2.9 (2-4) | 153 |
| Jeff Busby(JB) | 5 (5) | 64.6 (55-81) | 2.4 (0-5) | 134 |
| Colbert Ferry(CF) | 7 (6) | 41.7 (31-53) | 3.2 (2-4) | 99 |
| Meriwether Lewis (ML) | 8 (6) | 74.1 (32-106) | 2.0 (0-4) | 190 |
| Chickasaw Village (CV) | 4 (4) | 59.5 (46-67) | 3.8 (2-6) | 131 |
| All plots | 29 (32) | 63.5 (31-106) | 2.8 (0-6) | 391 |
Tree and Regeneration Metrics
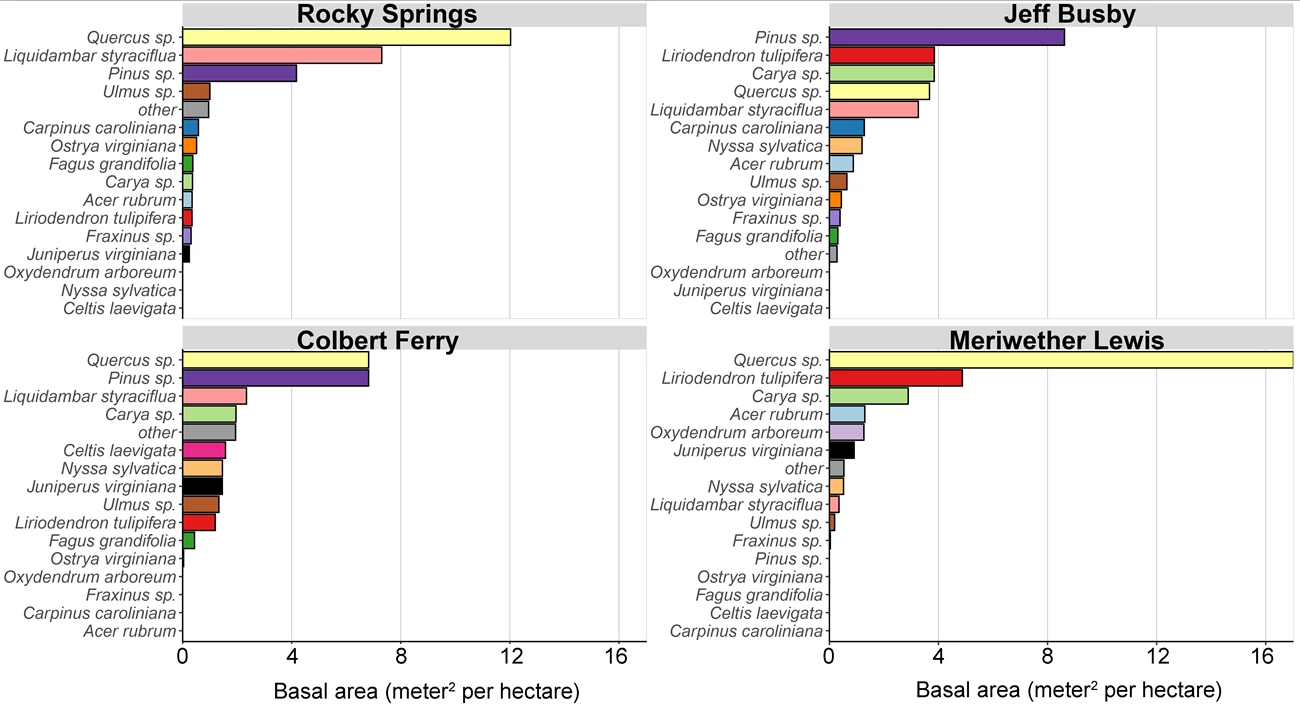
Forest health metrics were recorded in 25 forested plots in 2021; the 3 remaining forested plots had partial data available from 2019. Each plot had between 8 and 32 trees -also called stems- and between 15 and 304 seedlings and saplings. Tree size, density and composition varied widely among plots, with only a few patterns apparent within and across sites. Meriwether Lewis was the most oak-dominated site, in terms of both basal area (Figure 3) and stem density (data not shown). The site's most common oak species were white oak (Quercus alba, 24 tagged stems) and black oak (Quercus velutina,12 tagged stems). Sourwood (Oxydendrum arboreum) was also more abundant there than anywhere else, especially in terms of stem density (17 tagged stems). Oaks were also the top contributors to basal area in Rocky Springs (Figure 3), with the top species of water oak (Quercus nigra, 7 tagged stems) and cherry-bark oak (Quercus pagoda, 7 tagged stems). In all three southern sites, pine species were among the top three contributors for basal area (mainly loblolly, Pinus taeda; Figure 3), and sweetgum was the dominant or co-dominant tree species for stem density (13-37 tagged stems per site).

Overall, Parkway trees were not particularly large (maximum diameter at breast height = 108 centimeters), nor basal area very high, which reflects a history of timber harvest and/or farming in each site prior to NPS acquisition in the 1950s and 1960s. All sites nevertheless had rich assemblages of juvenile trees, generally reflecting a positive regeneration status. The highest seedling densities were at Rocky Springs, and the highest sapling densities were at Meriwether Lewis. Colbert Ferry had the fewest seedlings and saplings, and this site also had more standing dead trees and fewer live adult trees than the other sites.
Conclusions
Overall, the five monitored sites on the Natchez Trace Parkway were species rich, heterogeneous, and presented a compelling picture of naturally vegetated landscapes of the southeastern United States. As this is the first round of data collection in a long-term study, in-depth interpretation of patterns will benefit from additional rounds of sampling. The next vegetation monitoring event on the Parkway is scheduled for summer 2025, and subsequent events will continue once every four years.
Other Reports, Briefs and Summaries in this Series
Carlson JE. 2022. Vegetation Monitoring at Barataria Preserve, Louisiana: 2021 Trip Report and Brief. Gulf Coast I&M Network, Lafayette, LA
Carlson JE. 2020. Trip Report for Vegetation Monitoring at Padre Island NS 2019. Gulf Coast I&M Network, Lafayette, LA
Carlson JE. 2020. Trip Report for Vegetation Monitoring at Palo Alto Battlefield NHP 2019. Gulf Coast I&M Network, Lafayette, LA
Carlson JE. 2020. Trip Report for Vegetation Monitoring at San Antonio Missions NHP 2019. Gulf Coast I&M Network, Lafayette, LA
Full 2021 Summary Report
The full summary for 2021 expands on the information here, providing in-depth descriptions of the study area, methods, and results. Appendices A-C include maps of soils and elevation at each site, land use and fire history details per plot, and I&M species lists for forest and prairie.
