Last updated: March 8, 2022
Article
Oceanography 2020
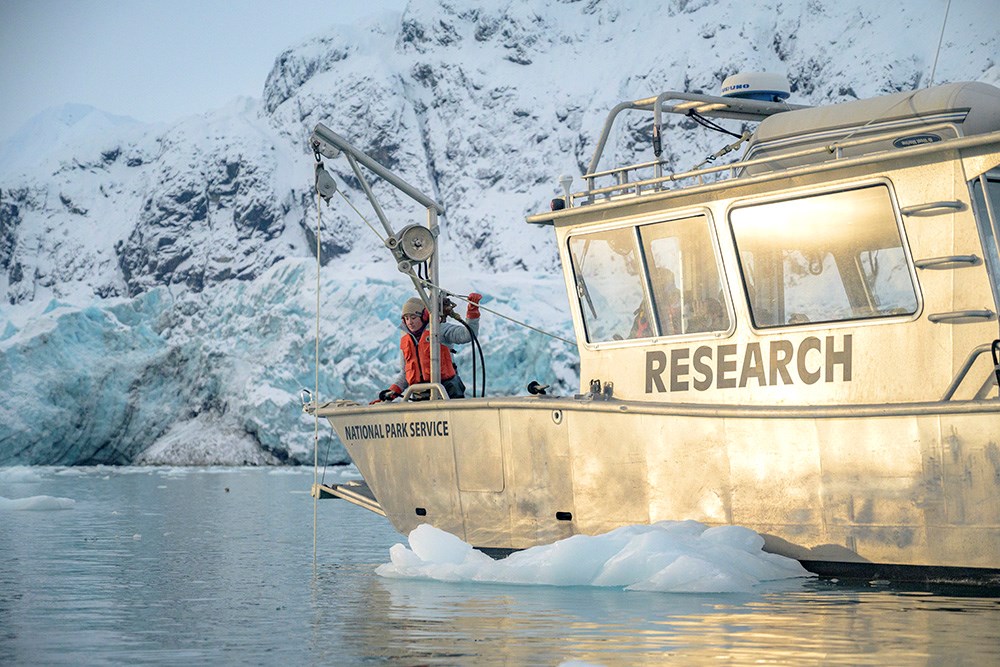
Once filled with ice, the glacially carved fjords of Glacier Bay National Park and Preserve are now inundated with cold, nutrient-rich seawater fueling extraordinary biological productivity. Many of the park’s animals, including humpback whales, brown bears, salmon, and puffins, rely upon and are influenced by the ocean. Understanding how local marine and terrestrial environments interact and change over time is critical for stewardship of Glacier Bay, one of the most pristine coastal areas in the world.
Oceanographic research has occurred in the park annually since 1993, providing data that informs conservation and management efforts. In 2009, oceanography became a “vital sign” for the Southeast Alaska Inventory & Monitoring Network. National Park Service scientists measure physical, chemical, and biological conditions for a broad understanding of how Glacier Bay functions. This monitoring program has built an extensive dataset that can be explored in a variety of ways, from tracking seasonal dynamics to detecting long-term change. From the East Arm to the West Arm, and from the far northern reaches of Glacier Bay to where park waters meet the open Pacific Ocean, the marine ecosystem varies in both subtle and dramatic ways. Core oceanographic indicators of environmental health also influence patterns in abundance and distribution of the wildlife that thrive in Glacier Bay and draw thousands of visitors each year.
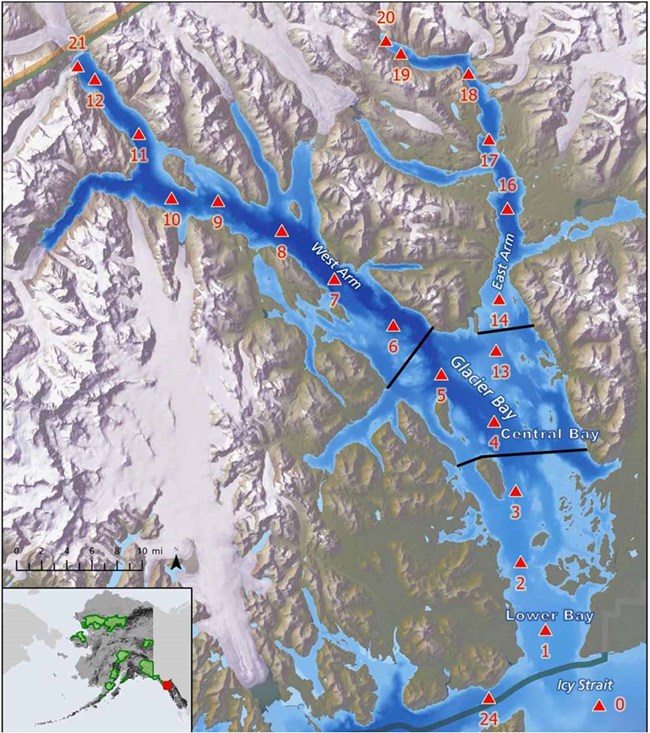
Black lines differentiate regions: Lower Bay, Central Bay, and East/West Arms. Seafloor bathymetry in shades of blue. Glacier coverage in white.
Survey Methods
The oceanography program samples at 22 stations (Figure 1) that span the entirety of Glacier Bay, from just outside the mouth at Icy Strait to the far reaches of the East and West Arms. Mid-channel and evenly spaced, these stations compare shallow sills to deep basins, and cover the gradient from tidewater glaciers and outwash streams in the north to the open waters of the Pacific Ocean. Eight sites are sampled March through October to describe seasonal dynamics while all 22 are sampled mid-summer and mid-winter to capture more nuanced geographic and interannual variation.
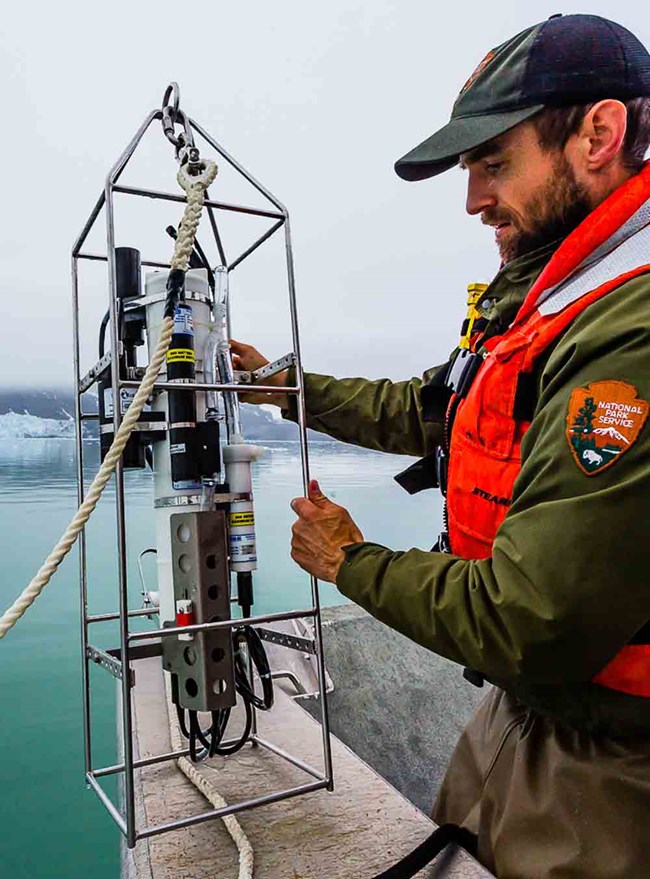
At each station, a metal frame holding a suite of standard oceanographic instruments is lowered from the park’s research vessel. Each sensor measures continuously from the surface to the seafloor, painting a picture of conditions otherwise invisible beneath the sea surface. Key variables include water temperature, salinity (how salty the water is), light intensity, turbidity (the amount of sediment in the water), dissolved oxygen concentration, and chlorophyll fluorescence (an indicator of phytoplankton biomass). Monitoring program details are in Johnson and Sharman’s (2014) protocol. All data presented in this report have been quality controlled and published.
Regional Variability
Glacier Bay’s complex geography and bathymetry (seafloor depth and shape) drive oceanographic conditions in three distinct regions: the Lower Bay, Central Bay, and East/West Arms. The Lower Bay is directly connected to the Gulf of Alaska via Icy Strait and Cross Sound. Comparatively warm and salty Pacific Ocean waters are powerfully mixed as they enter the bay on roiling tidal currents, traveling over rocky sills left by the Glacier Bay ice sheet near the narrow, shallow opening.
In contrast, the narrow and deep West and East Arms at the head of Glacier Bay are strongly influenced by their neighboring glaciers. From spring to fall, snow and ice melt feed these areas with vast quantities of cold, fresh, sediment-laden water. The resulting freshwater layer creates stark temperature and salinity gradients in the upper water column, while high turbidity blocks sunlight and reduces biological productivity. Glacier signals extend approximately 40 miles to the third region, the Central Bay. Broad and moderately deep, ocean conditions here integrate the well-mixed Lower Bay with the strongly stratified Upper Bay, leading to prolific and sustained phytoplankton blooms.
2020 oceanography surveys (Figure 2) found the upper East (5.5°C mean) and West (6.2°C mean) Arms were much cooler in July than the Central or Lower Bay (10.1°C mean), reflecting tidewater glacier influences. Surface (0-5 m) temperatures during summer and fall 2020 in the West Arm and Central Bay were 0.5-2°C above normal. Interestingly, the East Arm remained near the 1993-2019 temperature average all year.
Surface salinity values were close to the long-term average in the summer throughout the Bay. However, with over 20 inches of rain during June-August, the freshwater layer extended 30-60 inches deeper than usual across the East and West Arms and reached nearly to the Central Bay. An ocean-source signature was visible year-round in the Lower Bay’s high salinity readings. In July 2020, plumes carrying tremendous quantities of glacially derived, fine sediment (high turbidity) that typically stretch to the Central Bay were noted only in the far northern East and West Arms.
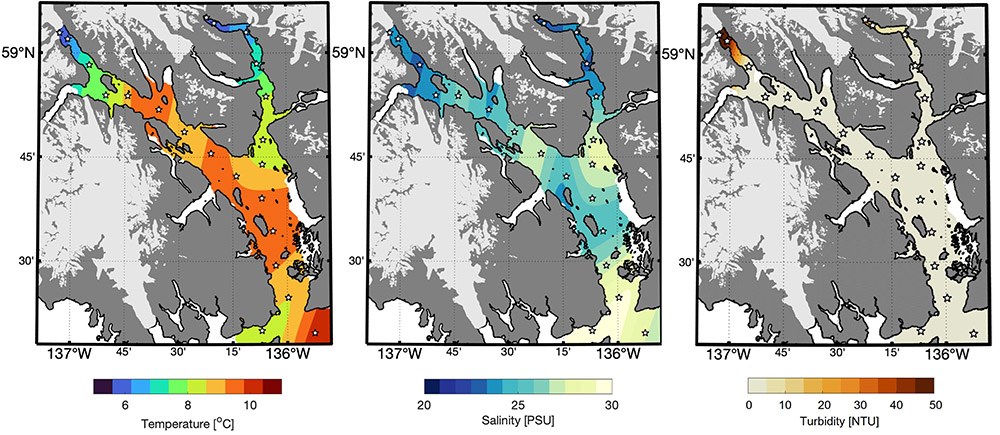
Maps show 0-5 m conditions from the upper water column, the most dynamic zone directly influenced by precipitation, river inputs, glaciers, and other processes. Glacier Bay’s regional differences are most distinct in the summer.
Seasonal Dynamics
Marine scientists explore seawater chemistry, how water flows and mixes, and ultimately how these processes impact the plants and animals that live in the ocean. This research explains why multitudes of creatures choose to spend the summer in Glacier Bay National Park and Preserve. It’s all about food!
For many marine mammals and seabirds, small schooling fishes are their favorite prey. In turn, these forage fish eat tiny drifting animals (zooplankton, such as krill), which themselves feed on microscopic algae (phytoplankton) living near the surface where sunlight for photosynthesis is abundant. At each level of this food web, seasonal change impacts productivity and food availability.
During the long Alaskan winter, Glacier Bay becomes very cold, salty, and well-mixed from surface to bottom (Figure 3). The days are short, sunlight is limited, and stormy weather is common. The ecosystem is relatively dormant.
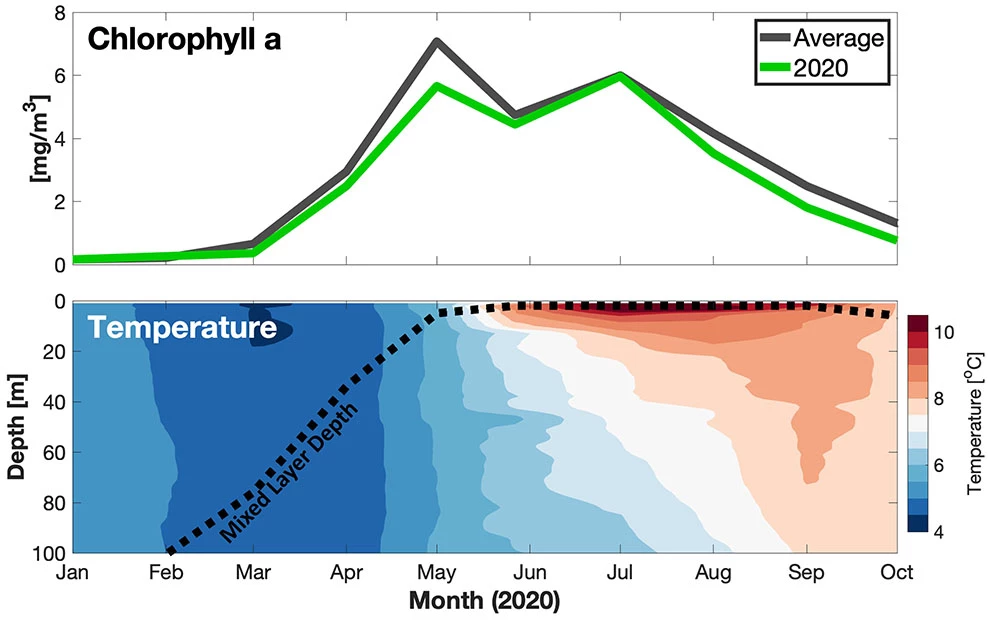
Dotted line shows the mixed layer depth (m). With a deep mixed layer, conditions are consistent everywhere, whereas shallow mixing (Apr-Oct) creates a layered water column and traps plankton at the surface where sunlight driving photosynthesis is abundant
Through the spring, sunlight increases as the days lengthen. With the onset of snow melt, the water column starts to stratify, or develop distinct stable layers. Less dense freshwater forms a layer on top of the salty, dense ocean water, trapping phytoplankton at the surface where they capitalize on abundant nutrients and light. Phytoplankton bloom in April and May, leading to spring zooplankton and forage fish increases.
By summer’s peak, most surface waters in Glacier Bay are comparatively warm, fresh, stratified, and teeming with life. Phytoplankton thrive all summer with nearly 18 hours of sunlight a day and continually replenished nutrients, fueling the entire food web. 2020 data show slightly lower (~15%) and less prolonged phytoplankton concentrations from May to October compared to the past. The East Arm was an exception, with an unusually strong spring bloom. Opportunistic observations suggest zooplankton and forage fish were more available as prey over recent marine heatwave years.
Long-term Trends
With nearly 30 years of measurements, Glacier Bay’s oceanography dataset provides insight to gradual long-term physical and chemical changes to the marine environment. Only about 25% of variability in the park’s long-term record is explained by regional (Alaska and the North Pacific Ocean) climate patterns, with 75% attributed to local weather conditions (Danielson, in review). Except for a few months in 2017-2018, Glacier Bay temperatures have been above average since 2014 (Figure 4). Park waters are warming (0.1°C/decade), mirroring Gulf of Alaska trends (0.2°C/decade; surface waters warming faster than deep; Ferriss and Zador 2020) consistent with global climate change.
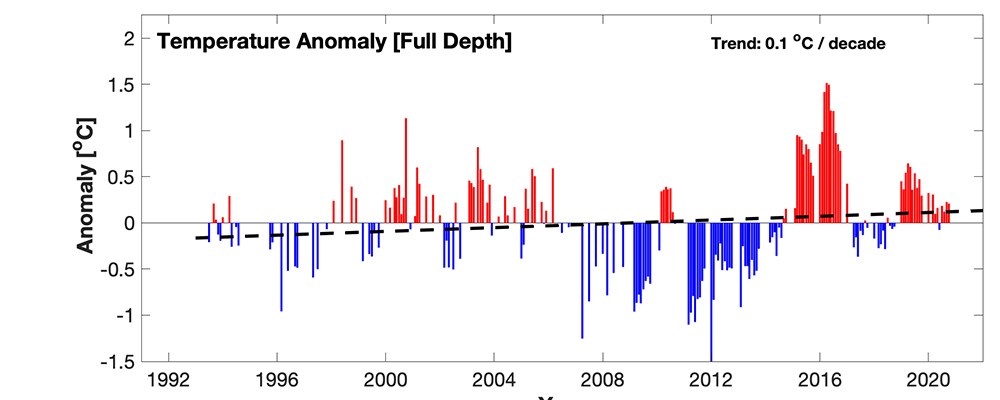
Dashed line shows the long-term trend.
Monitoring also captures intermittent yet ecologically impactful extreme events (e.g., El Niño). In particular, 2020 conditions occurred in the context of the widespread, intense 2014-2016 Pacific marine heatwave during which park waters reached 1.5°C above normal. Heatwave consequences included declines in humpback whale abundance and calving rate (Gabriele et al. in press), seabird die offs, and reduced populations of important commercial fish species (Suryan et al. 2021). This event foretells effects of future climate-driven warming.
Glacier Bay surface salinity observations show a long-term freshening trend (-0.28 psu/decade; Figure 5) stronger than changes ongoing in the Gulf of Alaska (-0.06 psu/decade; Ferriss and Zador 2020). Winter snowpack, glacier ice melt, rainfall, and water column mixing all influence salinity values. The 2018/19 southeast Alaska drought years show positive deviations due to reduced precipitation; in contrast, 2020 was the 5th wettest summer on record, driving a very negative salinity anomaly (Alaska Climate Research Center 2021).
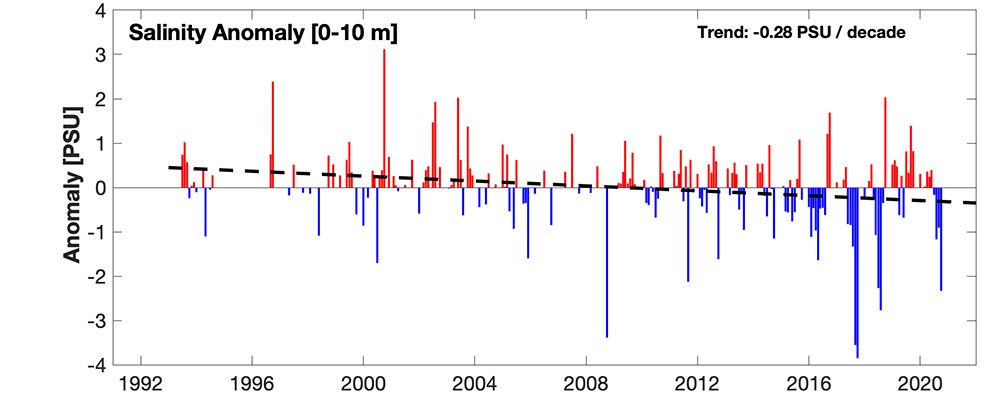
Summer salinity extremes drive the freshening trend shown by the dashed line.
Conclusions
Ice has shaped Glacier Bay’s landscapes and seascapes for millions of years. Today, only seven tidewater glaciers remain, and all but one are actively retreating or thinning; the rate and degree to which their influence on the park waters changes in the future is of critical interest to this monitoring program. Despite extreme summer rainfall and slightly warmer than average water temperatures, 2020 ocean conditions in the bay were close to normal in all seasons.
Oceanography surveys allow park scientists to observe and measure all corners of Glacier Bay on a monthly basis, providing first-hand insight into seasonal and interannual dynamics, geographic patterns, and unusual ecological events. Each exploration of the rich dataset inspires curiosity and new questions while linking the marine environment of this unique glacially influenced fjord to other research efforts at the park and across Alaska.
Acknowledgements
Glacier Bay National Park’s oceanography program is supported by monthly cruise volunteers from the park community. Thanks to S. Danielson and T. Hennon (University of Alaska Fairbanks) for analyses, visualizations, and technical guidance. The Southeast Alaska Network provides data management. Glacier Bay National Park and Preserve mechanics graciously keep us on the water.
Literature Cited
Alaska Climate Research Center. 2021. Annual report 2020. Alaska State Climate Center, University of Alaska Fairbanks.
Danielson, S. In review. Glacier Bay oceanographic monitoring program analysis of observations, 1993-2016. Natural Resource Technical Report, National Park Service, Fort Collins, Colorado.
Ferriss, B. and S. Zador, editors. 2020. Gulf of Alaska ecosystem status report 2020. North Pacific Fishery Management Council, Anchorage, Alaska.
Johnson, W. and L. Sharman. 2014. Glacier Bay National Park and Preserve oceanographic monitoring protocol: Version OC-2014.1. Natural Resource Report NPS/SEAN/NRR—2014/851. National Park Service, Fort Collins, Colorado.
Gabriele, C., J. Neilson, C. Amundson, J. Straley, C. Baker, and S. Danielson. In press. Sharp decline in humpback whale (Megaptera novaeangliae) survival and reproductive success in southeastern Alaska during and after the 2014-2016 Northeast Pacific marine heatwave. Mammalian Biology.
Suryan, R., M. Arimitsu, H. Coletti, R. Hopcroft, M. Lindeberg, S. Barbeaux, S. Batten, W. Burt, M. Bishop, J. Bodkin, and R. Brenner. 2021. Ecosystem response persists after a prolonged marine heatwave. Scientific Reports 11: 6235.
Contact
Craig Murdoch
(Craig_Murdoch@nps.gov)
Fisheries Biologist
Oceanography Monitoring Project Leader
Glacier Bay National Park and Preserve
