Last updated: August 7, 2025
Article
Climate and Water Monitoring at Fort Davis National Historic Site: Water Year 2023
NPS
Overview
Together, climate and hydrology shape ecosystems and the services they provide, particularly in arid and semi-arid ecosystems. Understanding changes in climate, groundwater, and surface water is key to assessing the condition of park natural resources—and often, cultural resources.
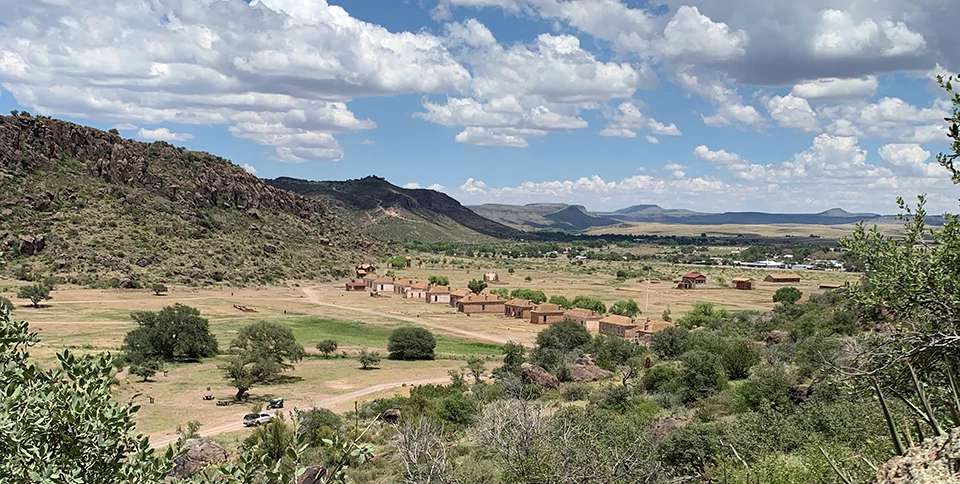
At Fort Davis National Historic Site (Figure 1), Chihuahuan Desert Inventory and Monitoring Network scientists study how ecosystems may be changing by taking measurements of key resources, or “vital signs,” year after year—much as a doctor keeps track of a patient’s vital signs. This long-term ecological monitoring provides early warning of potential problems, allowing managers to mitigate them before they become worse. At Fort Davis National Historic Site, we monitor climate and groundwater, among other vital signs.
Groundwater conditions are closely related to climate conditions. Because they are better understood together, we report on climate in conjunction with water resources. Reporting is by water year (WY), which begins in October of the previous calendar year and goes through September of the water year (e.g., WY2023 runs from October 2022 through September 2023). This web report presents the results of climate and water monitoring at Fort Davis National Historic Site in WY2023.
NPS
Climate and Weather
There is often confusion over the terms “weather” and “climate.” In short, weather describes instantaneous meteorological conditions (e.g., it’s currently raining or snowing, it’s a hot or frigid day), and climate reflects patterns of weather at a given place over longer periods of time (seasons to years). Climate is the primary driver of ecological processes on Earth. Climate and weather information provide context for understanding the status or condition of other park resources.
Methods
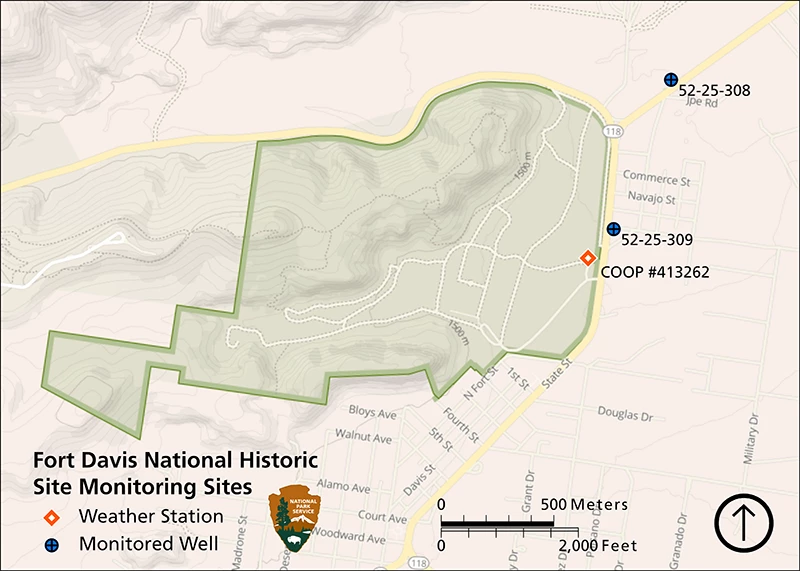
A National Oceanic and Atmospheric Administration Cooperative Observer Program (NOAA COOP) weather station (Fort Davis #413262) has been operational at Fort Davis National Historic Site since 1902 (Figure 1). This station provides a reliable, long-term climate dataset used for analyses in this climate and water report. Data from this station are accessible through Climate Analyzer.
NPS
Results
Precipitation
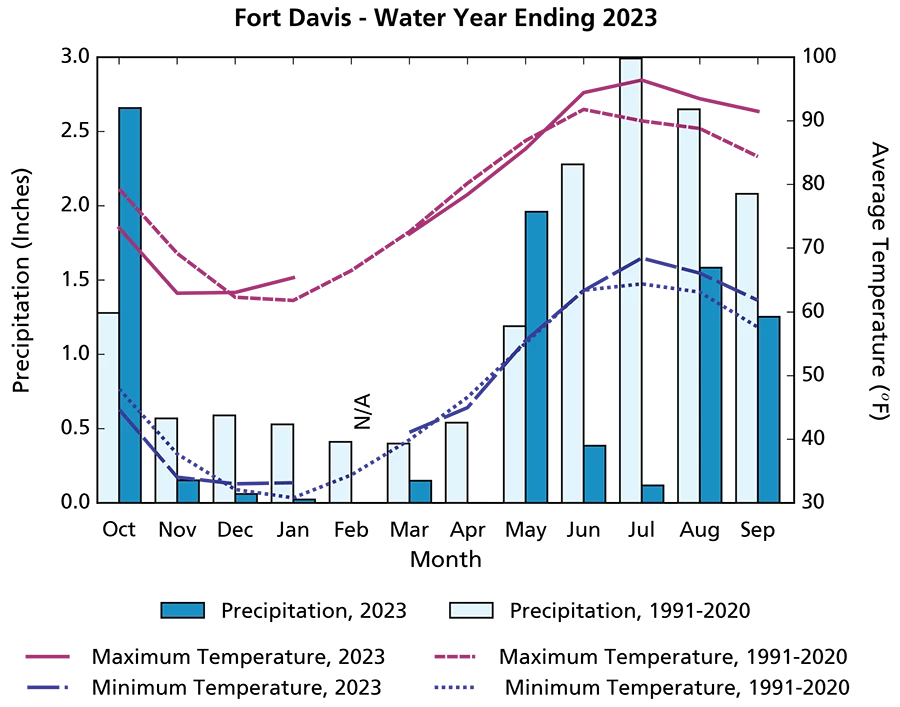
Annual precipitation at Fort Davis National Historic Site in WY2023 was 9.00″ (22.9 cm), 6.51″ (16.5 cm) less than the 1991–2020 annual average. Only 3 months in WY2023 received more than the 1991–2020 averages: October, February, and May (Figure 2). All other months had below average precipitation ranging from no rainfall to 60% of average. Extreme daily rainfall events (≥ 1.00″; 2.54 cm) occurred on 3 days, more than the average annual frequency of 2.2 days. Extreme rainfall events occurred on 11 October 2022 (1.16″; 2.9 cm), 27 May 2023 (1.02″; 2.6 cm), and 16 September 2023 (1.11″; 2.8 cm). February totals may be underestimated because of missing data on 6 days.
Air Temperature
The mean annual maximum temperature at Fort Davis National Historical Site in WY2023 was 78.8°F (26.0°C), 0.9°F (0.5°C) above the 1991–2020 average. The mean annual minimum temperature in WY2023 was 48.6°F (9.2°C), 0.8°F (0.5°C) above the 1991–2020 average. Mean monthly maximum and minimum temperatures in WY2023 differed by as much as 7.1°F (3.9°C; see September as an example) relative to the 1991–2020 monthly averages (Figure 2). Mean monthly maximum and minimum temperatures were generally cooler than the 1991–2020 averages in fall, were close to averages in winter and spring, and were substantially warmer than averages in the summer. Extremely hot temperatures (≥ 95.0°F; 35.0°C) occurred on 57 days in WY2023, over twice the average frequency of 25.7 days. Extremely cold temperatures (≤ 22.0°F; −5.6°C) occurred on 6 days, only one-third of the average frequency of 18.3 days.
NPS
Drought
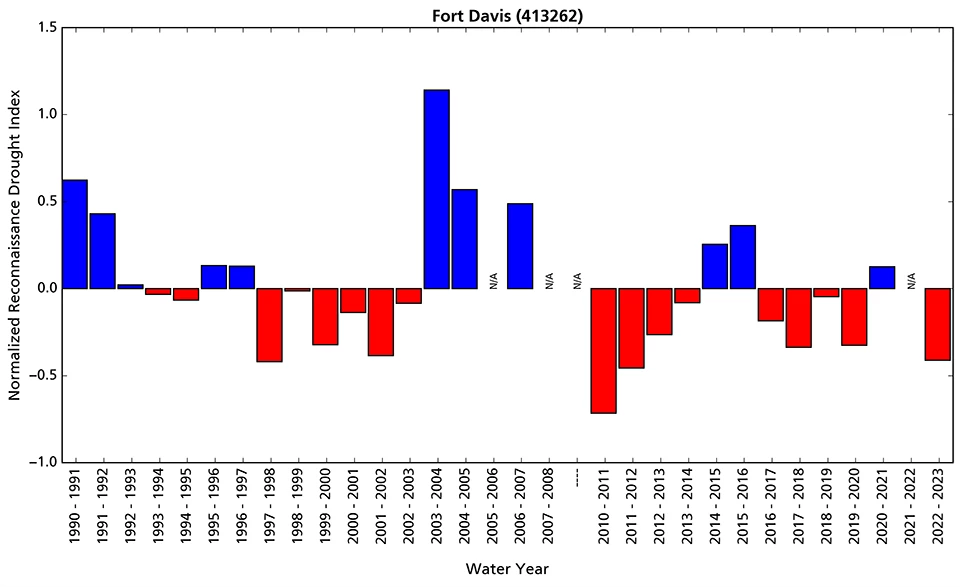
Reconnaissance drought index (Tsakiris and Vangelis 2005) provides a measure of drought severity and extent relative to the long-term climate. It is based on the ratio of average precipitation to average potential evapotranspiration (the amount of water loss that would occur from evaporation and plant transpiration if the water supply was unlimited) over short periods of time (seasons to years). The reconnaissance drought index for Fort Davis National Historic Site indicates that WY2023 was drier than the 1991–2023 average from the perspective of both precipitation and potential evapotranspiration (Figure 3).
Reference: Tsakiris G., and H. Vangelis. 2005. Establishing a drought index incorporating evapotranspiration. European Water 9: 3–11.
NPS
NPS
Groundwater
Groundwater is one of the most critical natural resources of the American Southwest. It provides drinking water, irrigates crops, and sustains rivers, streams, and springs throughout the region.
Methods
Fort Davis National Historic Site groundwater is monitored using two wells near the park (Figure 1). Each well is monitored annually by the Texas Water Development Board (TWDB) and the data are available at the TWDB Database.
Results
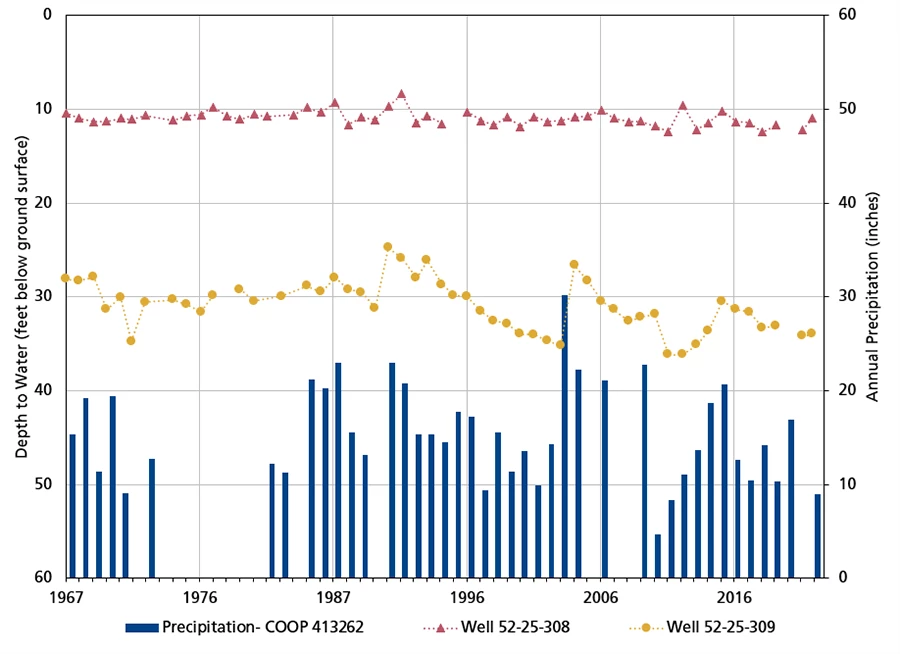
Groundwater near Fort Davis National Historic Site was monitored by TWDB on 15 November 2023. Water levels in the two monitored wells increased slightly between WY2022 and WY2023 (Figure 4 and Table 1). Water level in well 52-25-309 appears to be driven by precipitation and has varied by 11.36 ft (3.46 m) over the monitoring record. Groundwater at well 52-25-308 has been stable and shallow, varying only by 4.01 ft (1.22 m). This well does not appear to be strongly influenced by precipitation. Its proximity to Limpia Creek likely buffers well 52-25-308 from the larger water level fluctuations observed at well 52-25-309.
| TWDB Well Number | Location | Wellhead Elevation (ft amsl) |
Depth to Water (ft bgs) |
Water Level Elevation (ft amsl) |
Change in Elevation from WY2022 (± ft) | Change in Elevation from Earliest Recorded Water Level (± ft and year of first record) |
|---|---|---|---|---|---|---|
| 52-25-308 | 1,100 ft NE of the park adjacent to Limpia Creek | 4,827.00 | 10.99 | 4,816.01 | +1.17 | −0.59 (1967) |
| 52-25-309 | 144 ft E of the park | 4,860.00 | 33.97 | 4,826.03 | +0.21 | −5.87 (1967) |
NPS
Report Citation
Authors: Kara Raymond
Raymond, K. 2025. Climate and Water Monitoring at Fort Davis National Historic Site: Water Year 2023. Chihuahuan Desert Network, National Park Service, Las Cruces, New Mexico.
