Last updated: August 4, 2023
Article
Monitoring Dust Palliative Use Along the Denali Park Road

NPS Photo / Rob Parenti

NPS Photo / Tamás Szerényi
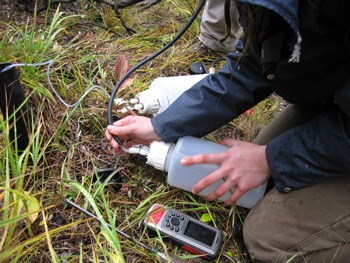
Botany program staff has thus developed a plan to assess and monitor the possible effects of CaCl2 applications on roadside soils, water, and vegetation. In 2005, staff installed 15 pairs of soil lysimeters (instruments designed to sample water from within the topsoil) – for each pair, one lysimeter was buried near the road and one 10 meters away. Water samples are collected annually from lysimeters (Figure 2) and nearby water bodies to assess whether potentially toxic levels of chloride in solution are being reached and determine how far from the road effects of CaCl2 application can be detected. Maintenance staff record the application rate and mileage of each CaCl2 application event, allowing for comparison of application rate and measured concentrations.
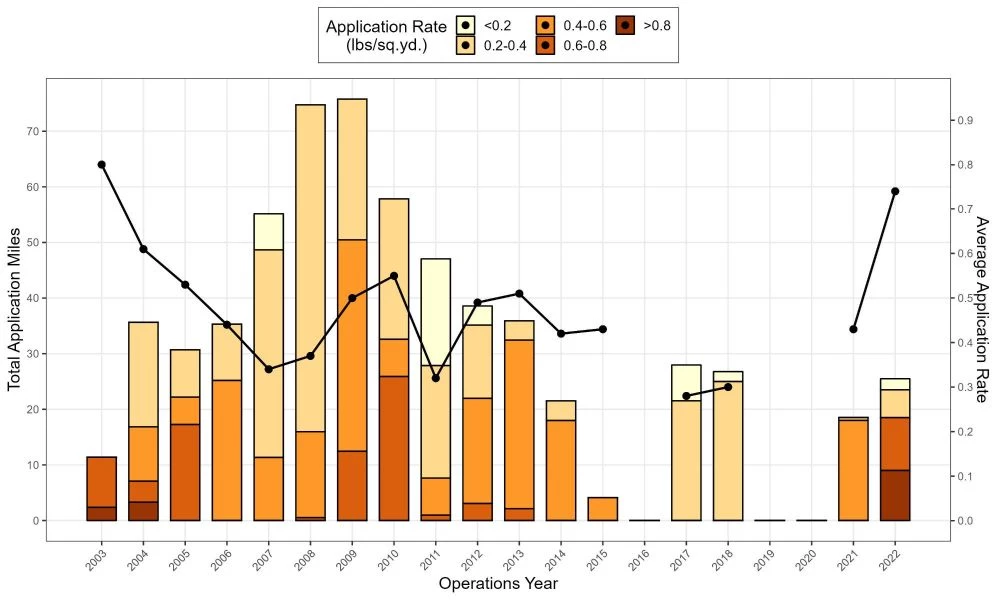
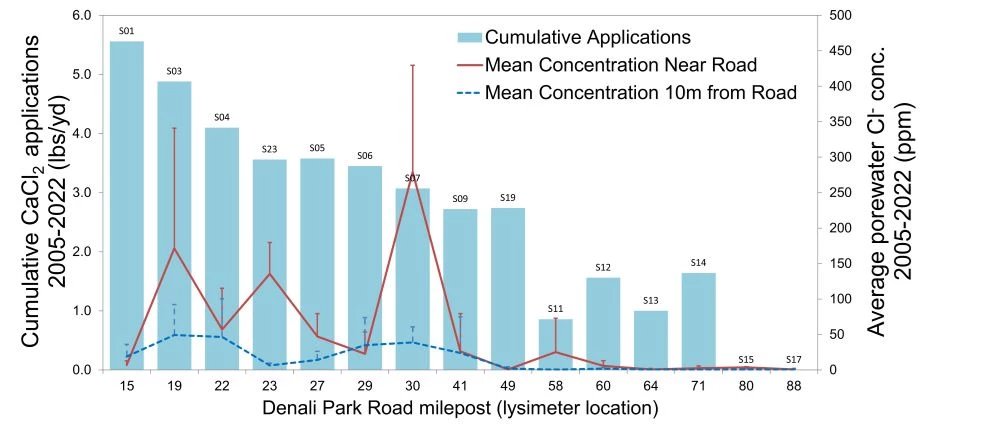
The need for CaCl2 application varies by year based on weather and road conditions, but overall application, both in terms of total mileage and concentration, has decreased over time, as maintenance personnel have learned the most effective times and concentrations at which to apply the compound (Figure 3). In general, water gathered from soil lysimeters at road mileages with high application rates returned higher chloride concentrations both 1m and 10m from the road (Figure 4), suggesting that chloride does indeed move away from the roadbed and into the native vegetation. Because an accumulation of CaCl2 over many years may be what affects the roadside biota the most, monitoring will continue as long as applications do.


Monitoring for Long-Term Effects
The dust palliative monitoring dataset now includes two decades of information about chloride accumulation in soil and surface waters, and periodic measures of chloride accumulated in soils and plant tissues. In general, the spatial and temporal patterns of chloride in soil solution reflect patterns of palliative application, with high concentrations occurring where applications of dust palliative are high.
Collection of this data helped define the unique background levels of 2 ppm chloride in soil pore water, 5 ppm in surface water, 40 ppm in soils, and 2000 ppm in spruce needle tissue in our subarctic study area. Importantly, monitoring data also indicates that there is a 2-4 year lag time between when applications occur, and when sampling detects it (Stehn and Roland 2018).
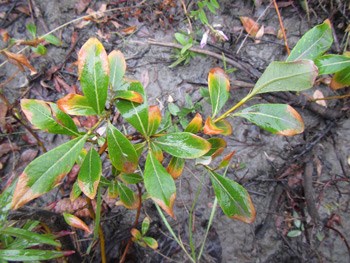
Observations of dust palliative effects on the roadside environment warrant a continued program of monitoring. Records of application events supplied by roads staff are critical to effective monitoring, such that Park managers can estimate when more application may cause segments of the roadside environment to exhibit symptoms of chloride toxicity.
For more information:
Stehn, S. E. and C. A. Roland. 2018. Effects of dust palliative use on roadside soils, vegetation, and water resources (2003–2016): Denali Park Road, Denali National Park, Alaska. Natural Resource Report NPS/DENA/NRR—2018/1580. National Park Service, Fort Collins, Colorado.
