Last updated: February 2, 2025
Article
Shrinking Glaciers in Denali National Park and Preserve
Alaska is one of the most heavily glaciated areas in the world outside of the polar regions. Approximately 21,835 square miles of the state are covered in glaciers—an area nearly the size of West Virginia. Glaciers have shaped much of Alaska’s landscape and continue to influence its lands, waters, and ecosystems. Because of their importance, National Park Service (NPS) scientists and partners measure glacier change. They have found that glaciers are shrinking in area and volume over nearly all the state. From 1985 to 2020, glacier-covered area in Alaska decreased by 13%. Over the same period, Denali National Park and Preserve saw a 14% reduction in glacier-covered area. As our climate continues to warm, these changes will continue to occur and likely accelerate, profoundly impacting the landscape of Alaska and our parks for generations to come.

Glaciers in Denali
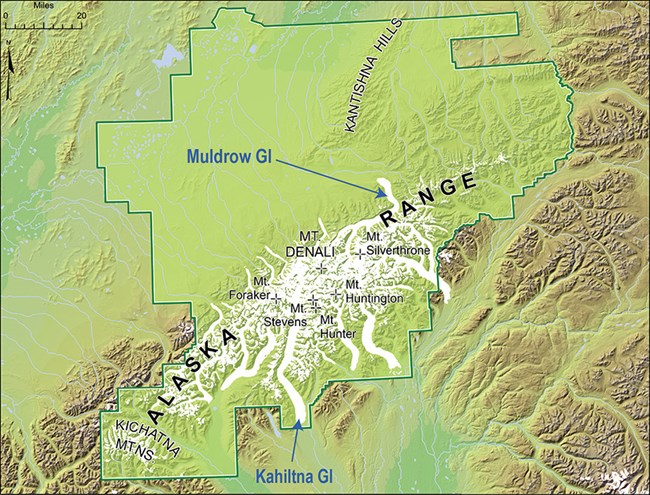
Denali National Park and Preserve is one of nine national parks in Alaska with glaciers. The southern portion of Denali is dominated by the Alaska Range. Glaciers covered 1,339 square miles (3,468 km2) of Denali in 2020 (Figure 1), which was 14% less than in 1985. This rate of loss was greater than the 8% loss estimated for the period from the 1950s to 2000.
Denali has some of the most iconic glaciers in Alaska. Two of the largest, Kahiltna Glacier and Muldrow Glacier, flow south and north (respectively) off Mount McKinley, the highest mountain in North America. On paper, the two big glaciers are similar—both are very long (Kahiltna Glacier is 45 miles long, Muldrow is 39), both have significant debris cover, and both serve as important climbing routes for mountaineers trying to climb to the summit of Mount McKinley.

There is one big difference between the Kahiltna and Muldrow glaciers: the Muldrow is a surging glacier. Surging is an uncommon characteristic of certain glaciers that leads them to periodically speed up, flowing much, much faster than they normally do during the longer, quiescent (non-surging) intervals. Muldrow Glacier surges every 50 years or so, and the most recent surge started in early 2021. During the surge, the glacier flowed at speeds as much as 90 feet/day—very fast compared with the more typical speeds of <3 feet/day (Figure 2; learn more about the surge).
In comparison, the non-surging Kahiltna Glacier shows a much more typical pattern of thinning and terminus retreat. Climate change-induced thinning on the Kahiltna Glacier is beginning to impact visitors by causing earlier melt-out of the makeshift runway used by mountaineers and flightseers. Ski-equipped charter planes land on the runway in spring and early summer, but are finding the runway becoming unusable as the melt season progresses because snowmelt exposes crevasses that makes it impossible to land.
Why does the Muldrow surge and the Kahiltna doesn’t? It’s a tricky question, and scientists continue to try to explain why certain glaciers surge while most don’t. One common finding, however, is that glaciers flowing over weak, broken bedrock are more likely to surge. This almost certainly plays a part at the Muldrow, which makes a severe left-hand turn as it flows across the Denali Fault, a major earthquake-prone fracture on the north side of the Alaska Range. Over time, that fault breaks and shears the rocks on either side, contributing to a preponderance of surging glaciers along the length of the fault.
Statewide Glacier Change
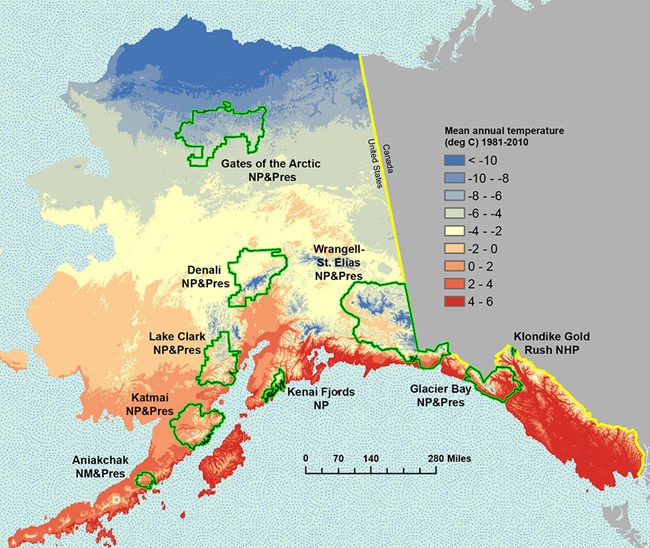
Alaska’s high-latitude and high-elevation mountain ranges have historically had average annual temperatures cold enough to sustain glaciers. However, global air temperatures are increasing, and Alaska and other high-latitude regions are warming faster than the average global rate. Data from NOAA’s National Centers for Environmental Information indicate Alaska’s statewide average annual temperature has been increasing by 0.6°F per decade since 1950. As temperatures warm, the elevation at which snow and ice remain frozen is getting higher, with more rain and less snow at lower elevations. The effects are most visible at a glacier’s lowest elevations, where most glacier termini are rapidly retreating.

Glaciers within national parks in the state (parks shown in Figure 3, along with average annual temperatures) decreased by 8% from the 1950s to the early 2000s. From 1985 to 2020, glacier-covered area in Alaska decreased by 13%, or 3,253 square miles (8,425 km2). During that later interval, the largest changes in glacier-covered area in Alaska occurred at elevations of 2,625–7,218 feet (800–2,200 m) and in southern Alaska—the region that encompasses the greatest glacier-covered area. Little change was seen in the relatively small glaciers of the Brooks Range in northern Alaska.
Because of the importance of Alaska’s glaciers and the implications of glacier loss, including for how we manage parks, glacier monitoring and assessment will continue to be a critical, ongoing activity of the NPS and its partners.
