Last updated: April 7, 2025
Article
Creating a Repeatable Method for Viewshed Analysis Using Lidar Data in Carlsbad Caverns
National Park Service
National Center for Preservation Technology and Training
This presentation, transcript, and video are of the Texas Cultural Landscape Symposium, February 23-26, 2020, Waco, TX. Watch a non-audio described version of this presentation on YouTube.
Claire Gorman: As Julie said, my name is Claire Gorman, and I study computer science and architecture at Yale University, where I'm excited to be skipping class today, to be here with you and share this work. I'm new to the field of cultural landscapes, but I'd like to thank Julie (McGilvrey) for her incredible mentorship during my internship this summer, and I think that my background might offer some interesting perspective to this exciting field. So thank you, Malcolm (Williamson), for the clear technical description, and Kimball (Erdman) for the useful practical context.
I will build on their insights with a brief outline and some takeaways from my work over this past summer, which involved experimentation in creative ways to apply the Lidar data to the field of cultural landscapes.
So, the assignment for my National Center for Preservation Education (NCPE) internship was to create a repeatable method for viewshed analysis within Carlsbad Caverns. It's an auxiliary contribution to the much larger cultural landscape inventory initiative that Kimball introduced.
Claire Gorman, Yale University
Implicit in that project was the challenge of resolving this exciting and unconventional Lidar point cloud data with the existing structure of a cultural landscape viewshed study. To me, the meta objective implied by that challenge is the purpose to explore ways of resolving various technologies and representations of data, and resolve them under the cultural landscape thought process.
This was experimental work, and I took a multidisciplinary approach to it. My intention was to position the Lidar semantically within a broader ecosystem of datasets, in order to capture design information from multiple sides at once.
To structure this project, I aimed to explain and define the simultaneously natural and designed character of Carlsbad Caverns as a geological formation, modified and adapted for human use. Both the paved path and the lighting system that make the cave accessible to visitors are responses to its existing geometry, serving to navigate and highlight, but also to interpret the cave's extensive passages. Thus, the cave viewed by a visitor is a natural environment, but through the necessary revision, and in some cases, distortion of two layers of design.
My intent was to parse through this symbiosis of nature and design, in terms of the delta between what actually exists in the caverns, their true geometry, their nature, so to speak, and what the visitor perceives there, by virtue of the design choices at play. This difference quantifies, characterizes the impact of the design elements and indicates their effect. I use a variety of data types and forms of information to access this latent space.
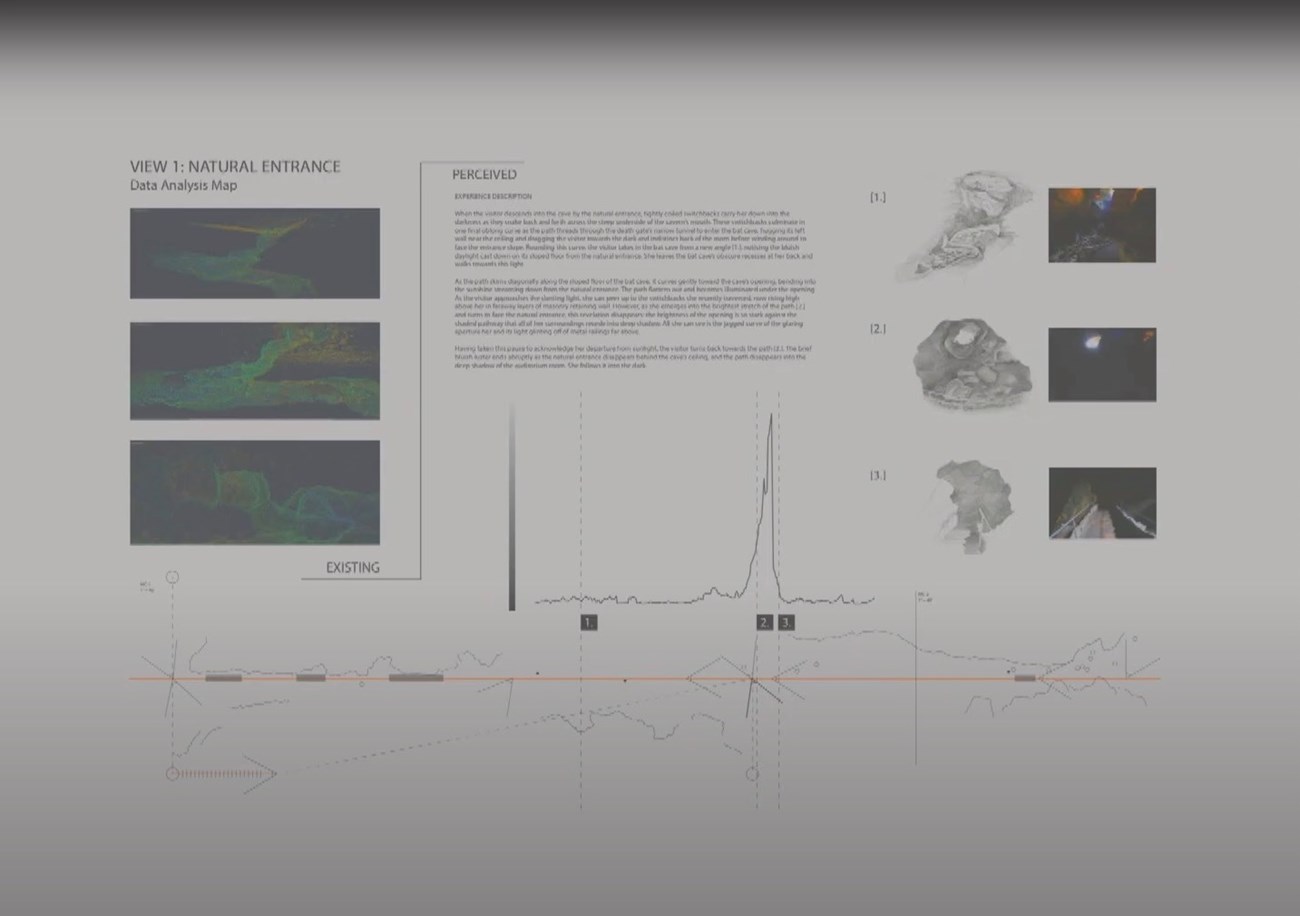
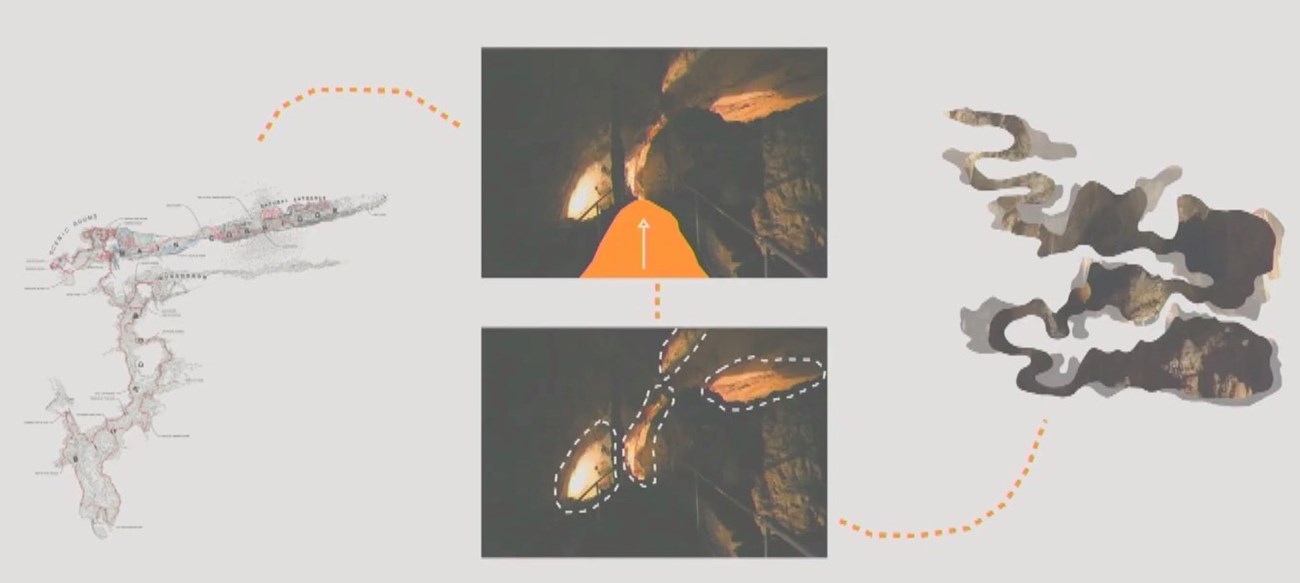
So here I'm expressing, this is the Lidar point cloud. These are maps that Kimball created, and I am trying to access this designed perception of the cave that a visitor gets, which is actually quite different from what is visible in the point cloud.
So, the bulk of the work that I produced was the result of a multivalent approach to capturing an opposite end of the spectrum from the Lidar, which captures what is actually there in the cave. It is the most detailed objective possible mapping of the cave from the path. So it's still the product of the path's design placement, but the point cloud furnishes this objective ground truth resource for my analysis. And on the other hand, my work is intended to show what the visitor perceives in the cave.
That subjective information is shown on the bottom and right sides of the graphic reports that I created. They demonstrate the variety of data sets I used to holistically capture the cave's visual and spatial profile, and how these different observations are related to one another.
I'll briefly discuss each component of this analysis, and finish with some examples of how this multilateral approach enabled me to access insights only possible through the combination of multiple data types.
I'll start with the text, which grounds all the other data types in a written narrative. After walking the cave trail several times, I realized that the viewsheds inside of the caverns are not single points in space, but instead, dynamic sequences of visual phenomena that are perceived over time. This text is a short description of the progression of each viewshed as experienced by a visitor. It's annotated with key moments that are numbered and reappear in the other datasets, linking them to one another.
With that overall written description to orient this analysis, I was interested in how I might employ more linear logic to this process. I wanted to develop a discrete dataset to capture the actual physical phenomena that created the visual narrative I was experiencing. I feel generally that a description is stronger when you can ground it in empirical data.
To accomplish that, I created the perceptual path diagrams that here are shown in hand-sketched form, and unfortunately are almost entirely illegible. But the idea is there. They reorient the cave's geometry around the path, mapping my idea of subjective geometry of the cave, as determined by the trail design. This technique seeks to map the cave around a moving visitor, capturing an embodied spatial experience, rather than an objective cartography.
Claire Gorman, Yale University
These maps allowed me to track patterns and how the physical features of the cave corresponded to viewsheds. You can also see the three key points from the textual description noted in black, that are notated on the path diagram as well. To augment these representations with some visual data, I created hand drawings and took photographs of these same key moments. These visual data points illustrated the visitor perception that I outlined diagrammatically in the path diagrams, and verbally in the journal text. They give two different grades of visitor perception.
At the most subjective level, the drawings show what I actually understood in the environment and could relay in my sketchbook. The photographs supplement them from a slightly less personal perspective. And to supplement these visuals and path analysis with a lighting focus strategy, I took a GoPro video of the walk through the areas of the cave that I was focused on.
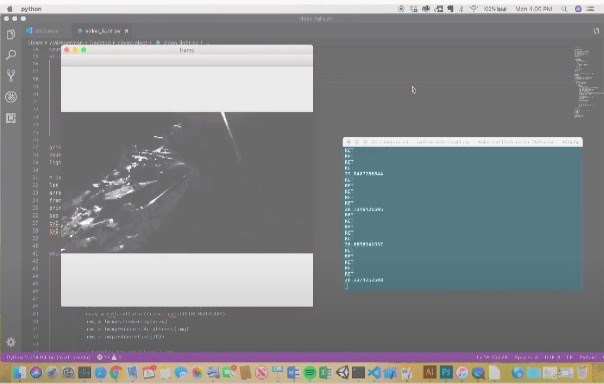
This video captured, at a very crude level, fluctuating light levels in the cave. And I've further solidified that representation by writing a short program to analyze that video, simplifying each frame of it, to fully expose black and white images, then calculating an average light level every five frames, to create a chart of the light increasing and decreasing through each viewshed sequence.
And this video is showing that frame analysis. You can see the video is slightly choppy because it's only using every fifth frame. But you can see the different points of light that are starting to appear in these overexposed high contrast images. And for each of these frames, a single figure is calculated, which is an average value for every pixel in each frame.
Claire Gorman, Yale University
And conveniently, you may recognize this geometry actually, because the viewshed that I'm using as an example is the same one that we saw in Malcolm's fly through. So here we are approaching this spot of light that is coming in through the natural entrance, and suddenly there's this huge flare right there. And then things get dark again, as we move into the auditorium space. And this exaggeration proves the importance of these fluctuating light levels to the way that a visitor perceives the cave. And once this finishes its calculations, it will produce a graph that shows the varying light levels in linear form. So it is simply a change in light over time. And there it is. So that's what this program is able to produce from my GoPro data.
So, I was able to map these light graphs onto my existing path diagrams, in order to create a tandem representation of the cave's double layer design in each location. You'll note that because this is based on a visitor walking down a path, both spatial and temporal data can be mapped onto the same axis. And that is why it's helpful to linearize the path diagrams, and then that enables me to map them onto the line graph of light, increasing and decreasing over time.
You'll note that the key points called out from the text and images also extend to this light graph. In this way, my data demonstrates how different factors converge at the site of a viewshed. You can see that the moment where the cave walls fall away, maybe you can see it, yeah you can, where the cave walls fall away, and the visitor is suddenly in the middle of a space, is the same moment where the light level spikes. In this way, these two data types are able to explain the presence of the viewshed, in terms of measurable phenomena.
Altogether, this conglomeration of data that I created gives a portrait of how the cave is perceived. In the boards, as I just showed, it's presented in contrast with screenshots of the Lidar point cloud of the cave, at each location of the viewshed. And here we return to its original purpose.
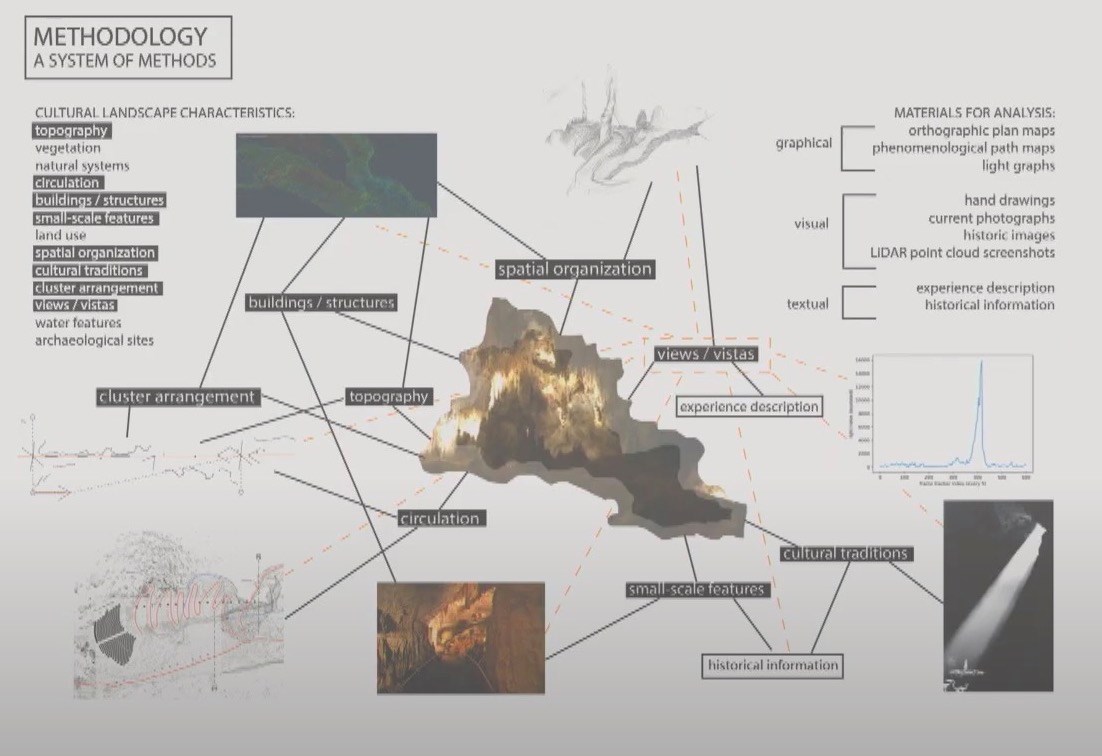
All of the information that I created collectively weighs against the Lidar, to give a portrait of the designed cave, and demonstrate that it portrays a very particular interpretation of the objective hole that's visible in the point cloud. With these boards, I returned to the National Park Service's traditional method of cultural landscape analysis, which involves a checklist of key categories called characteristics, as many of you know.
I had approached this project with an intention to experiment and innovate, and I'm lucky that Julie gave me a great deal of freedom in interpreting this project. We wanted to see how fresh eyes might bring something new to this process. But the intent was not to abandon the existing practice altogether. So to unify these results, I mobilized the traditional cultural landscape characteristics actively, applying them as a transformative function to negotiate between these various types of data, and relate them back to the Lidar.
Claire Gorman, Yale University
That strategy brought forth some interesting observations. For instance, in considering the spatial organization characteristic, I noticed that the Lidar makes clear how far back the bat cave section of the cave recedes. That would be this linear horizontal portion extending to your left. The visitor can't perceive that, because the path only extends through a fraction of its length, as we see here, and because the rest of the room is hidden in deep shadow.
I also noticed, when I was looking at typography, how much longer and narrower a pipe the natural entrance is, than it appears from inside. The geometry of that area is hard to understand in the first person, because the entrance switchbacks give a very lateral reading of it, given their sideways orientation, and because from below, it's nearly impossible to see any context for the brightly glaring sunlight coming in from outside.
So, in both of these examples, the Lidar offers this extraordinary perspective of the ability to see the cave's geometry from outside, which has until now, not been possible. And it contextualizes the distinction between what we see when we are there in the first person, interpreting this landscape from the ground, and what we can see from without, from a more removed and objective perspective.
In both of these examples, the elements of the path placement and light level in the cave, as I said, serve not only to stylize, but in effect, to mask the natural geometry of the cavern. In these cases, my perceptual data tells a very different story from the Lidar. And this difference is key to understanding the cave's design.
This conclusion is possible to demonstrate, because the cultural landscape characteristics offer a forum for translating between the Lidar and these other datasets. In herein, I think, lies the potential of meshing unconventional methods with traditional frameworks, and of using quantitative data sources to expose the underpinnings of qualitative and even subjective observations.
Clearly this project leaves a great deal of room for adaptation and augmentation, and it has a long way to go before fully conversing with the state of the art and cultural landscape analysis. However, it ultimately became more than a viewshed analysis for a single study, and grew to involve a thought process considering the application of interdisciplinary information and methods, to the study of cultural landscapes overall. And in that context, I think it delivers some contributions.
The most important of those takeaways, which might apply to every field as much as this one, is that new media bring new messages. The Lidar opened a whole new way of seeing the cave that had never been possible before. And every time I introduced a new data type in response to it, I discovered new insights, new connections, and new nuances to my understanding of the environment, and to the dynamic story that I was able to tell about it.
The technologies that I used and invented, to achieve this multimedia composition were inexpert, and in some cases very limited. I lacked the computing power to do anything more with the Lidar than take screenshots. My maps were approximations drawn while walking the cave on foot. And the code I wrote gave a very reductive, in general, reading of an extremely complex system, whose theatrical design intent I would have loved to more fully understand. But even these quick adaptations and barefoot cartographies offer exciting new avenues for study. The creative misuse or conversion of technology, I find, is often as rich in meaning as its proper implementation.
So for these reasons, the conclusion that I have to offer, is that a diversity of data types, especially crossovers between qualitative and quantitative observation, have the power to enrich cultural landscape studies, not only through the new insights that they themselves provide, but through the synergy of relationships among them.
Thank you.
Speaker Biography
Claire Gorman is an Architecture and Computer Science student at Yale University.
Tags
- carlsbad caverns national park
- ncptt
- historic landscapes
- cultural resources
- cultural landscapes
- texas
- texas cultural landscapes symposium
- carlsbad caverns
- tls
- terrestrial laser scanning
- carlsbad caverns np
- viewshed
- viewshed analysis
- 3d
- digital documentation
- claire gorman
- yale university
- computer science
- architecture
