Last updated: September 11, 2024
Article
Change Along the St. Croix Riverway: 1990–2020

NPS photo/T. Gostomski
We monitor landscape disturbances such as forest harvest, blowdowns, fire, and development activities in and around parks using an automated, satellite-based change detection program called LandTrendr.
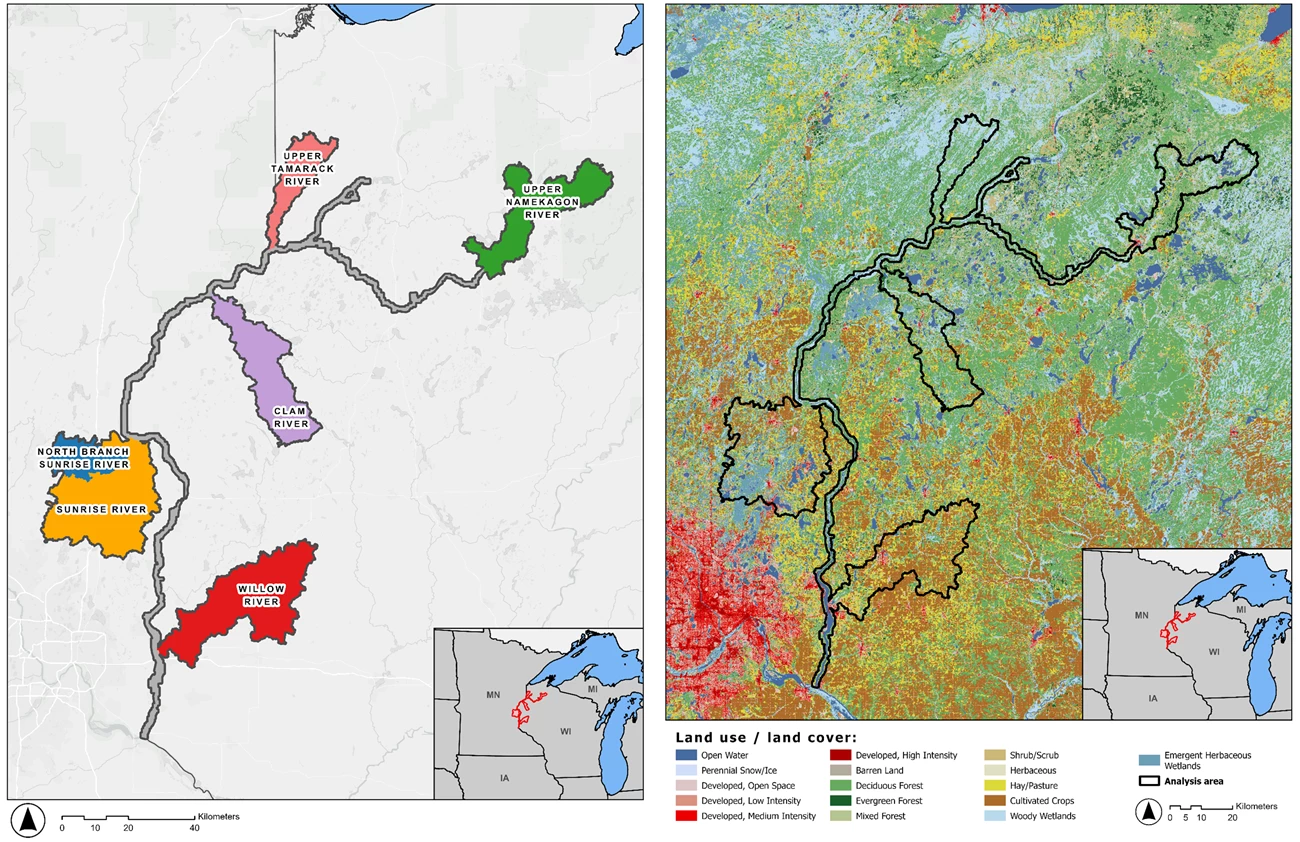
For this second look at the St. Croix National Scenic Riverway (SACN), we analyzed 31 years (1990–2020) of satellite imagery to identify and quantify landscape changes in and around SACN, including six sub-watersheds: the Upper Namekagon River, the Upper Tamarack River, the Clam River, the Sunrise River and North Branch of the Sunrise River, and the Willow River (Map 1). The sub-watersheds were chosen to represent the gradient in land cover types and ownerships within the St. Croix River watershed (Map 2). Monitoring encompassed 347,055 hectares (ha) of land (857,591 acres), of which 31,983 ha/7,903 ac was inside the riverway boundary.

Cutting Trees and Raising Roofs
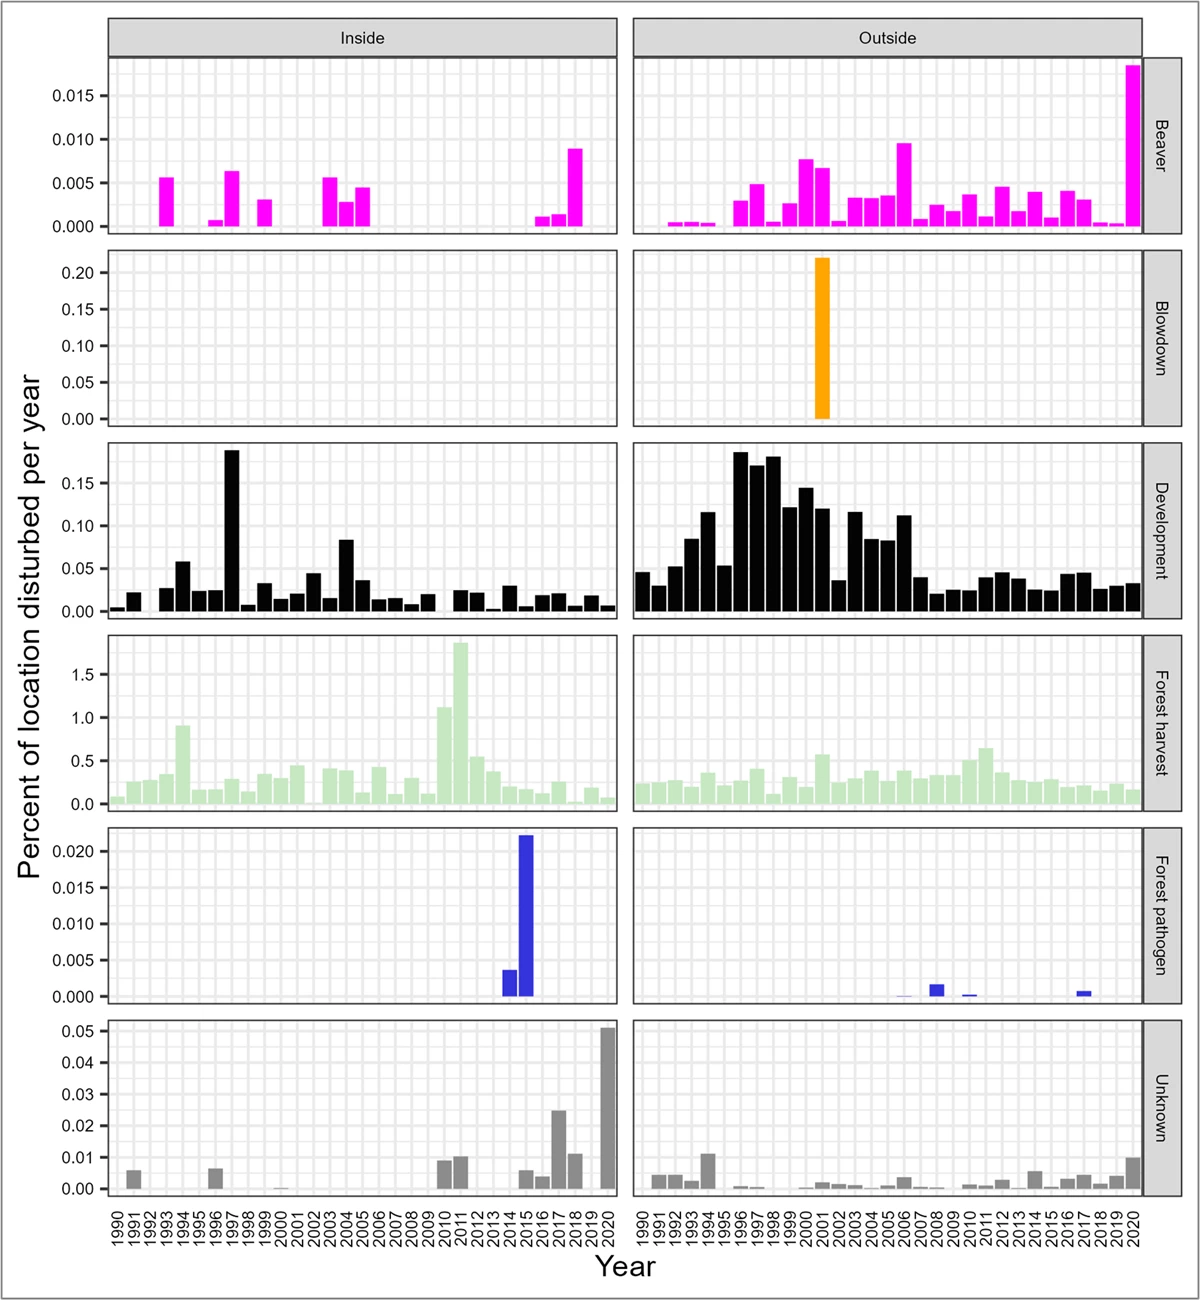
Forest harvest accounted for the most widespread and ubiquitous change both inside and outside the riverway boundary. It was most prominent in the northern sub-watersheds (Figure 1, top), two of which—the Upper Tamarack River and the Upper Namekagon River—contain the largest percentages of county-owned lands. Inside the park boundary, forest harvest activities affected 10.60% of the total land area (3,389.29 ha/8,375 ac), with the greatest amount of activity occurring in 2010 and 2011. Meanwhile, outside the riverway boundary, forest harvest occurred every year of the 31-year analysis period, averaging 940.27 ha/2,323 ac per year (Figure 2).
Development was the most common disturbance in the southern half of the study area (Figure 1, bottom), with most development occurring in the three watersheds closest to the Minneapolis area. Overall, the watersheds closer to the metro area experience lower amounts of disturbance, but because the prevalent disturbance agent is development, changes there could have a greater impact on ecosystem function.


Managing “Downstream Effects”
The disturbance regime at SACN, both inside and outside the riverway boundary, is unique among the nine network parks because of the latitudinal gradient from suburban/agricultural lands in the south to extensive forests in the north. Half of the watersheds are dominated by development and the other half are experiencing steady rates of forest harvest on public and private lands. With little land under federal ownership, this type of monitoring can help riverway managers to know what is happening around them, predict what could happen to the rivers themselves, and work to mitigate the worst of the effects.
