Part of a series of articles titled The Midden – Great Basin National Park: Vol. 25, No. 1, Summer 2025.
Article
Cave Climates of Great Basin National Park
This article was originally published in The Midden – Great Basin National Park: Vol. 25, No. 1, Summer 2025.
NPS
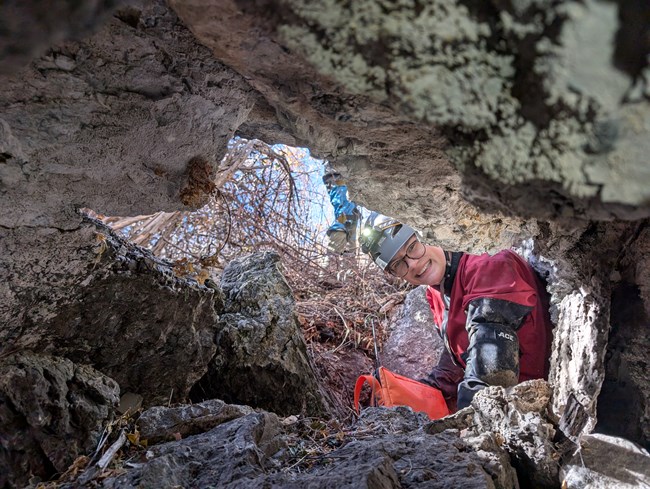
This last winter, I was a Scientists in Parks Cave and Karst Intern at Great Basin National Park. In addition to learning how to go caving, organizing and participating in this year’s Lint Camps, and taking part in a bunch of super fun bird and snow surveys, I was tasked with analyzing all of our existing temperature and humidity data for the park’s 40 caves.
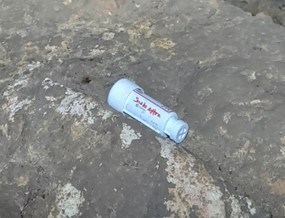
The data was collected by dataloggers: the small tubes that can be easily spotted along the trail in Lehman Caves. Depending on how old the data was, different types of dataloggers were used, but the current dataloggers in use are the white HOBO Pro v2s, which measure temperature and relative humidity, and the black HOBO Onset U20Ls, which measure temperature and barometric pressure (that is then used to calculate water depth). These usually measure data every hour and can last up to 5 years without being switched out! We try to download data from the dataloggers in the caves about once a year using a shuttle, which can then be uploaded to our computers and exported into Excel files, where I worked my magic.
Clara Morrison
So what did all of this data crunching tell us? And why do we care if it's warm, cold, or humid inside a cave? One huge reason is to protect our bats from white-nose syndrome. From research done by Verant et al. in 2012, we know that the ideal temperature for the growth of Geomyces destructans, the fungus that causes white-nose syndrome, is between 12.5 and 15.8°C. Looking at our caves, this means that if white-nose syndrome ever made it to Great Basin NP, bats in lower-elevation caves would be the most at risk, which includes Lehman Caves.
Knowing the climate of a cave also allows us to predict the biota that we can find in each cave, informing future discoveries. And as the climate continues to shift, long-term monitoring will allow us to understand its impact on caves and their inhabitants as well as what we can expect in the future.
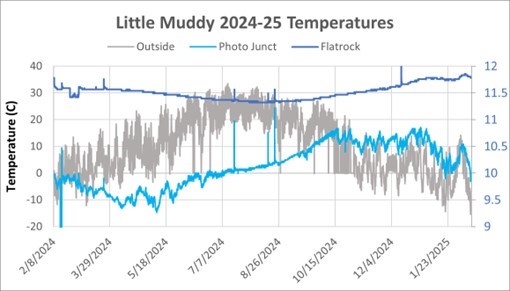
In addition to getting a better understanding of each of the caves' yearly cycles and average temperatures, we found that a couple of the caves behaved completely differently than we expected! For background, caves are usually a very stable representation of the average temperature outside over the entire year. If the cave experiences fluctuations in temperature, it usually corresponds to the temperatures outside– a cave will get slightly colder in the winter and slightly warmer in the summer. The following three caves were unlike any others.
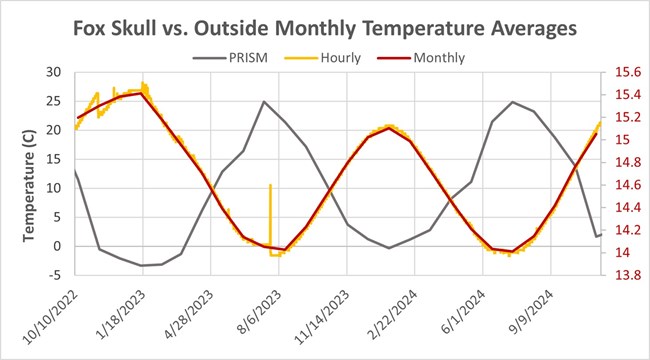
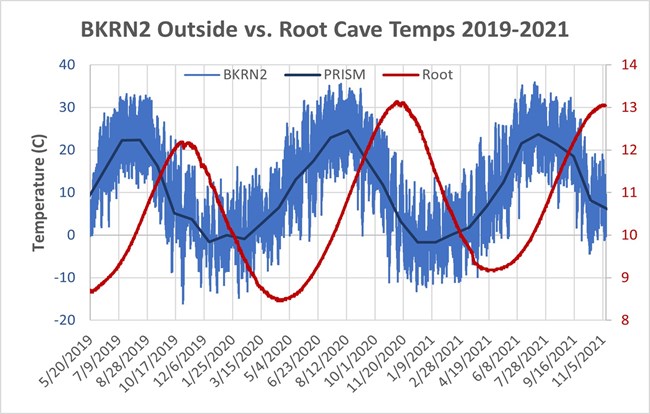
Overall, this preliminary look at Great Basin caves’ climates has informed where to focus our efforts next, and I can’t wait to see all the new things that’ll be found out as we continue to study the park’s caves!
Last updated: May 15, 2025
