Last updated: August 7, 2025
Article
Climate and Water Monitoring at Big Bend National Park: Water Year 2023

NPS
Overview
Together, climate and hydrology shape ecosystems and the services they provide, particularly in arid and semi-arid ecosystems. Understanding changes in climate, groundwater, and surface water is key to assessing the condition of park natural resources—and often, cultural resources.
At Big Bend National Park (Figure 1), Chihuahuan Desert Inventory and Monitoring Network scientists study how ecosystems may be changing by taking measurements of key resources, or “vital signs,” year after year—much as a doctor keeps track of a patient’s vital signs. This long-term ecological monitoring provides early warning of potential problems, allowing managers to mitigate them before they become worse. At Big Bend National Park, we monitor climate, groundwater, and springs, among other vital signs.
Surface water and groundwater conditions are closely related to climate conditions. Because they are better understood together, we report on climate in conjunction with water resources. Reporting is by water year (WY), which begins in October of the previous calendar year and goes through September of the water year (e.g., WY2023 runs from October 2022 through September 2023). This article reports the results of climate and water monitoring at Big Bend National Park (Figure 1) in WY2023.

NPS
Climate and Weather
There is often confusion over the terms “weather” and “climate.” In short, weather describes instantaneous meteorological conditions (e.g., it’s currently raining or snowing, it’s a hot or frigid day), and climate reflects patterns of weather at a given place over longer periods of time (seasons to years). Climate is the primary driver of ecological processes on earth. Climate and weather information provide context for understanding the status or condition of other park resources.
Methods
We report on five National Oceanic and Atmospheric Administration Cooperative Observer Program (NOAA COOP) weather stations at Big Bend National Park (Figure 1):
- Chisos Basin (#411715) at an elevation of 5,300 ft (1,615 m), operational since 1943;
- Panther Junction (#416792) at an elevation of 3,740 ft (1,140 m), operational since 1955;
- Persimmon Gap (#416959) at an elevation of 2,870 ft (875 m), operational since 1952;
- Castolon (#411524) at an elevation of 2,170 ft (661 m), operational since 1947; and
- Rio Grande Village Texas (#417624) at an elevation of 1,857 ft (566 m), operational since 2006.

NPS
Results for Water Year 2022
For precipitation and temperature monitoring results, scroll down or click on a weather station here:
Chisos Basin (COOP) ǀ Panther Junction (COOP) ǀ Persimmon Gap (COOP) ǀ Castalon (COOP) ǀ Rio Grande Village Texas (COOP)
Precipitation and Air Temperature—Chisos Basin
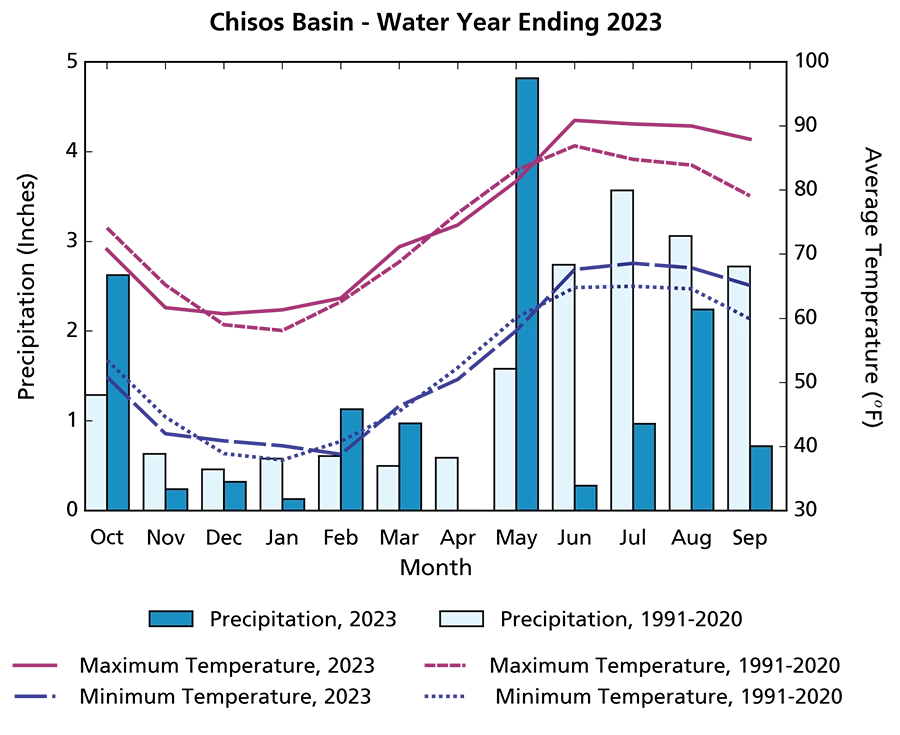
Annual precipitation at Chisos Basin in WY2023 was 14.44″ (36.7 cm), 3.89″ (9.9 cm) less than the 1991–2020 average. Monthly precipitation totals in WY2023 were less than the 1991–2020 average in every month except October, February, March, and May; monthly totals in these four months were 0.52″ (1.3 cm) to 3.24″ (8.2 cm) more than the long-term average (Figure 2). April was completely dry. The monsoon season (June–September) was very dry, receiving only 4.21″ (10.7 cm) compared to the average 12.09″ (30.7 cm). Extreme daily rainfall events (≥ 1.00″; 2.54 cm) occurred on 3 days, one less than the average annual frequency of 4 days. Extreme rainfall events occurred on 11 October 2022 (1.58″; 4.0 cm), 28 May 2023 (1.90″; 4.8 cm), and 23 August 2023 (1.60″; 4.1 cm).
The mean annual maximum temperature at Chisos Basin in WY2023 was 75.4°F (24.1°C), 1.9°F (1.0°C) above the 1991–2020 average. Mean monthly maximum and minimum temperatures oscillated above and below the 1991–2020 averages in the first part of the year (October–May; Figure 2). Increasingly warmer than average temperatures occurred during the monsoon season (June–September), up to 8.8°F (4.9°C) above average in September. Generally, mean monthly minimum temperatures were closer to the long-term averages than mean monthly maximum temperatures were. Extremely hot temperatures (≥ 90.0°F; 32.2°C) occurred on 68 days in WY2023, over three times the average frequency of 22.1 days. Extremely cold temperatures (≤ 30.0°F; −1.1°C) occurred on 20 days, similar to the average frequency of 18.9 days.
NPS
Precipitation and Temperature—Panther Junction
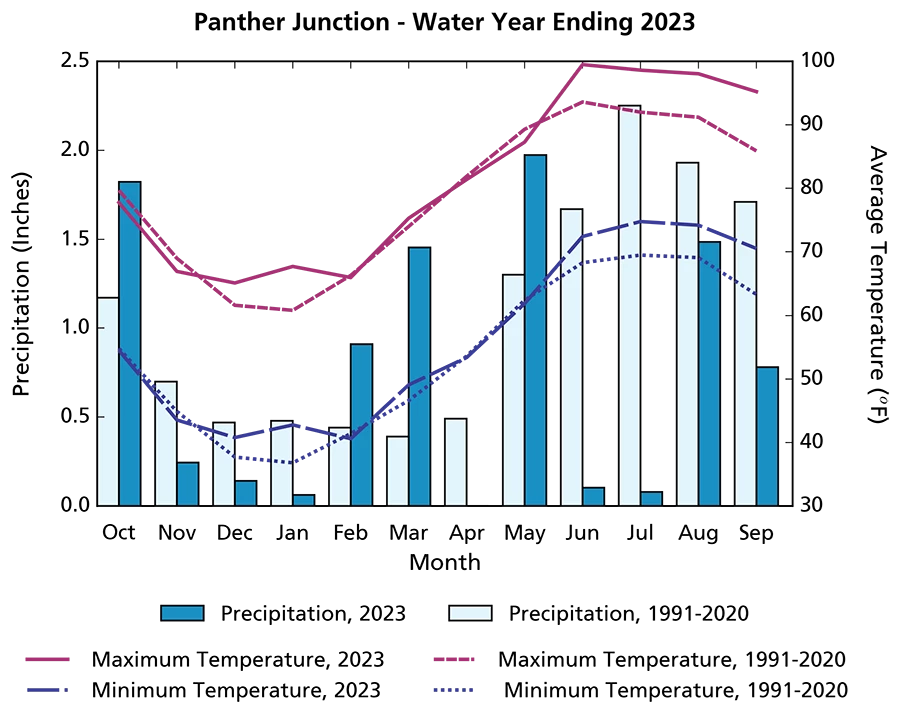
Annual precipitation at Panther Junction in WY2023 was 9.05″ (23.0 cm), 3.95″ (10.0 cm) less than the 1991–2020 annual average. Monthly precipitation totals in WY2023 were less than the 1991–2020 averages in every month except October, February, March, and May; monthly totals in these four months were 0.47″ (1.2 cm) to 1.06″ (2.7 cm) more than average (Figure 3). April was completely dry. The monsoon season (June–September) was very dry, receiving only 2.44″ (6.2 cm) compared to the average 7.56″ (19.2 cm). Extreme daily rainfall events (≥ 1.00″; 2.54 cm) occurred on 2 days, similar to the average annual frequency of 2.5 days. Extreme rainfall events occurred on 11 October 2022 (1.22″; 3.1 cm) and 28 May 2023 (1.30″; 3.3 cm).
The mean annual maximum temperature at Panther Junction in WY2023 was 81.7°F (27.6°C), 2.9°F (1.6°C) above the 1991–2020 average. Mean monthly maximum and minimum temperatures oscillated above and below the 1991–2020 averages in the first part of the year (October–May; Figure 3). Increasingly warmer than average temperatures occurred during the monsoon season (June–September), up to 9.3°F (5.2°C) above average in September. Generally, mean monthly minimum temperatures were closer to the long-term averages than mean monthly maximum temperatures were. Extremely hot temperatures (≥ 98.0°F; 36.7°C) occurred on 71 days in WY2023, nearly three times the average frequency of 25 days. Extremely cold temperatures (≤ 31.0°F; −0.6°C) occurred on 16 days, less than the average frequency of 22.1 days.
NPS
Precipitation and Air Temperature—Persimmon Gap
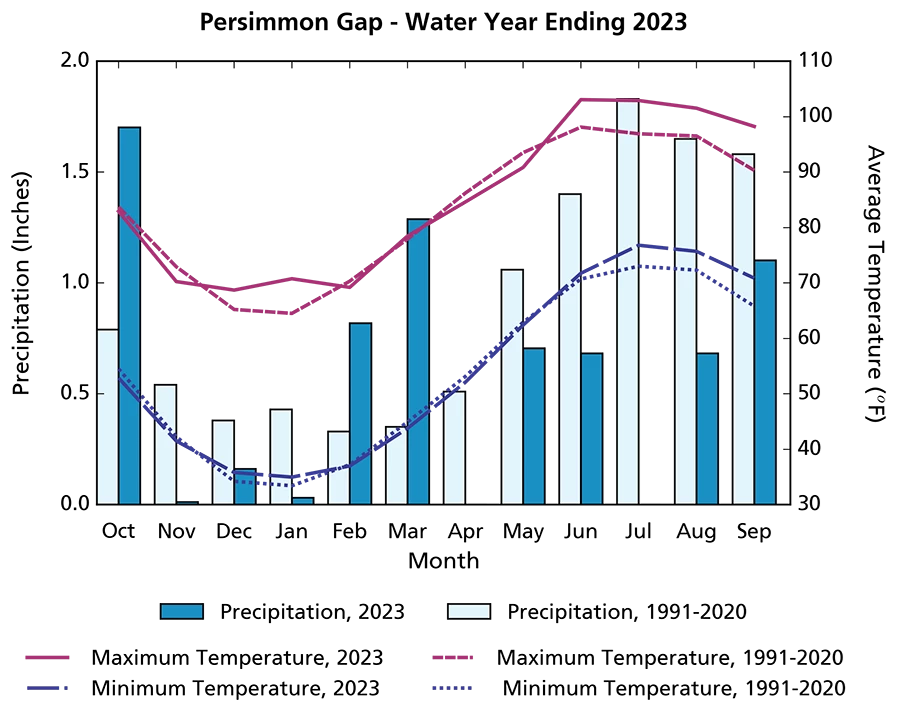
Annual precipitation at Persimmon Gap in WY2023 was 7.18″ (18.2 cm), 3.67″ (9.3 cm) less than the 1991–2020 annual average. Monthly precipitation totals were less than the 1991–2020 averages in every month except October, February, and March: monthly totals in these months were 0.49″ (1.2 cm) to 0.94″ (2.4 cm) more than the 1991–2020 averages (Figure 4). Both April and July were completely dry. Overall, the monsoon season (June–September) was very dry, receiving only 2.46″ (6.3 cm) compared to the average 6.46″ (16.4 cm). An extreme daily rainfall event (≥ 1.00″; 2.54 cm) occurred once on 11 October 2022 (1.05″; 2.7 cm). This is less than the normal annual frequency of 2.4 days.
The mean annual maximum temperature at Persimmon Gap in WY2023 was 85.3°F (29.6°C), 2.3°F (1.3°C) above the 1991–2020 average. The mean annual minimum temperature in WY2023 was 54.7°F (12.6°C), 1.0°F (0.6°C) above the 1991–2020 average. Mean monthly maximum and minimum temperatures oscillated above and below the 1991–2020 averages in the first part of the year (October–May; Figure 4). Warmer than average temperatures occurred during the monsoon season (June–September), up to 7.9°F (4.4°C) above average in September. Generally, mean monthly minimum temperatures were closer to the long-term averages than mean monthly maximum temperatures were. Extremely hot temperatures (≥ 103.0°F; 39.44°C) occurred on 57 days in WY2023, over two and half times the average frequency of 22.2 days. Extremely cold temperatures (≤ 28.0°F; −2.2°C) occurred on 17 days, similar to the average frequency of 16.6 days.
NPS
Precipitation and Air Temperature—Castolon
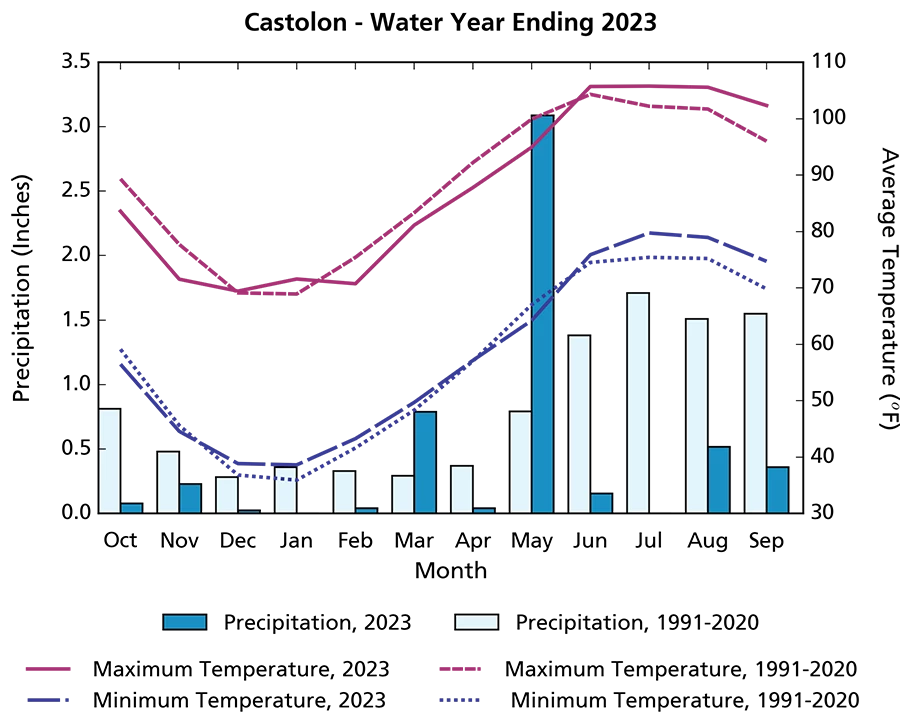
Annual precipitation at Castolon in WY2023 was 5.31″ (13.5 cm), 4.55″ (11.6 cm) less than the 1991–2020 average. May was nearly four times as wet (3.09″; 7.85 cm) as the 1991–2020 average and accounted for over half of the annual total (occurring in several different storm events; Figure 5). March also received nearly three times its average precipitation. January and July were completely dry. All other months received less than half of the average precipitation. No extreme daily rainfall events (> 1.00″; 2.54 cm) occurred in WY2023, which is less than the 1991–2020 average annual frequency of 2.1 days.
The mean annual maximum temperature at Castolon in WY2023 was 87.6°F (30.9°C), 0.7°F (0.4°C) below the 1991–2020 average. The mean annual minimum temperature in WY2023 was 58.6°F (14.8°C), 1.4°F (0.8°C) above the 1991–2020 average. Mean monthly maximum temperatures were generally cooler than the 1991–2020 averages for the first part of the year (October–May), except in December and January, which were warmer than average (Figure 5). During that same period, mean monthly minimum temperatures were either warmer than average or below average, but not as far below average as the mean monthly maximum temperatures were. Warmer than average temperatures occurred during the monsoon season (June–September), up to 6.3°F (3.5°C) above average in September. Extremely hot temperatures (≥ 108.0°F; 42.2°C) occurred on 41 days in WY2023, more than one and half times the average frequency of 24.7 days. Extremely cold temperatures (≤ 30.0°F; −1.1°C) occurred on 11 days, less than the average frequency of 18.7 days.
NPS
Precipitation and Air Temperature—Rio Grande Village Texas
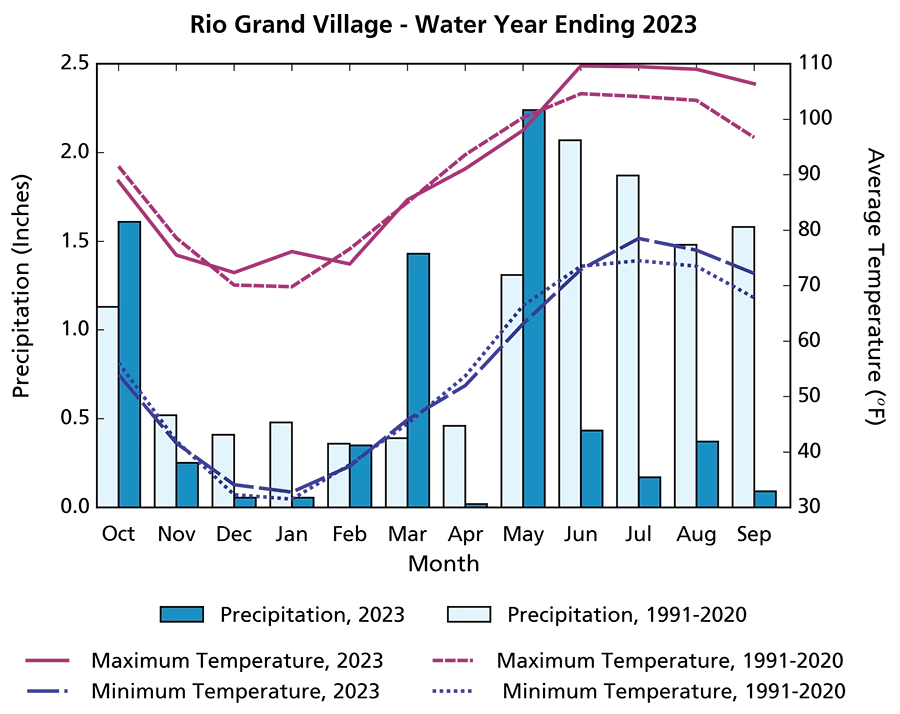
Annual precipitation at Rio Grande Village Texas in WY2023 was 7.07″ (18.0 cm), 4.99″ (12.7 cm) less than the 2006–2020 average. Monthly precipitation totals in October, March, and May were between 0.44″ (1.1 cm) and 1.04″ (2.6 cm) more than the long-term averages (Figure 6). Precipitation in February was similar to average. All other months received less than half of the average precipitation total. April was completely dry. The monsoon season (June–September) was very dry, receiving only 1.06″ (2.7 cm) compared to the average of 7.00″ (17.8 cm). An extreme daily rainfall event (≥ 1.00″; 2.54 cm) occurred once on 28 May 2023 (1.89″; 4.8 cm), similar to the average annual frequency of 1.5 days.
The mean annual maximum temperature at Rio Grande Village Texas in WY2023 was 91.4°F (33.0°C), 1.9°F (1.0°C) above the 2006–2020 average. The mean annual minimum temperature in WY2023 was 55.2°F (12.9°C), 0.7°F (0.4°C) above the 2006–2020 average. Mean monthly maximum and minimum temperatures oscillated above and below the 2006–2020 averages in the first part of the year (October–May; Figure 6). Warmer than average temperatures occurred during the monsoon season (June–September), up to 9.7°F (5.4°C) above average in September. Generally, mean monthly minimum temperatures were closer to the long-term averages than mean monthly maximum temperatures were. Extremely hot temperatures (≥ 109.0°F; 42.8°C) occurred on 67 days in WY2023, over twice the average frequency of 30 days. Extremely cold temperatures (≤ 26.0°F; −3.3°C) occurred on 17 days, less than the average frequency of 24.3 days.
NPS
Drought
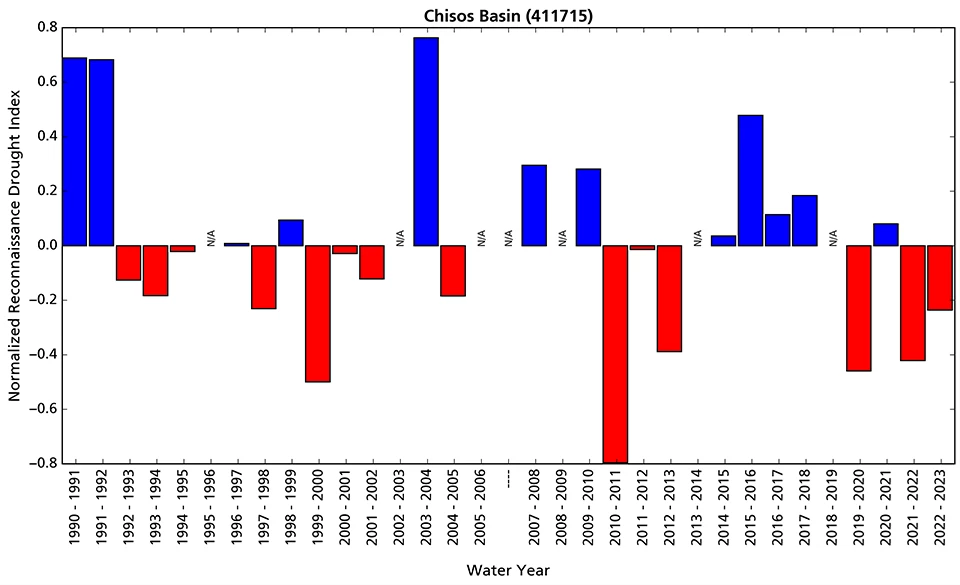
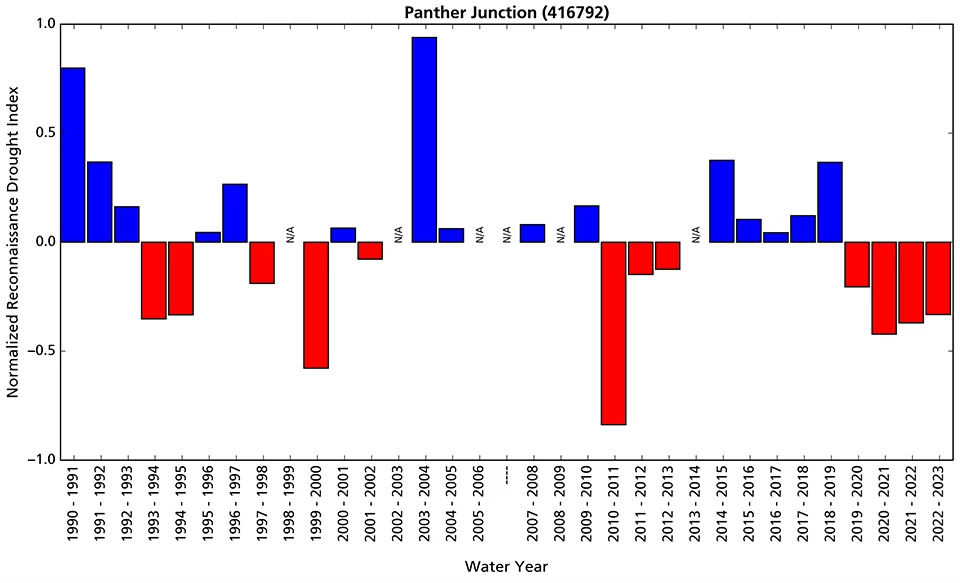
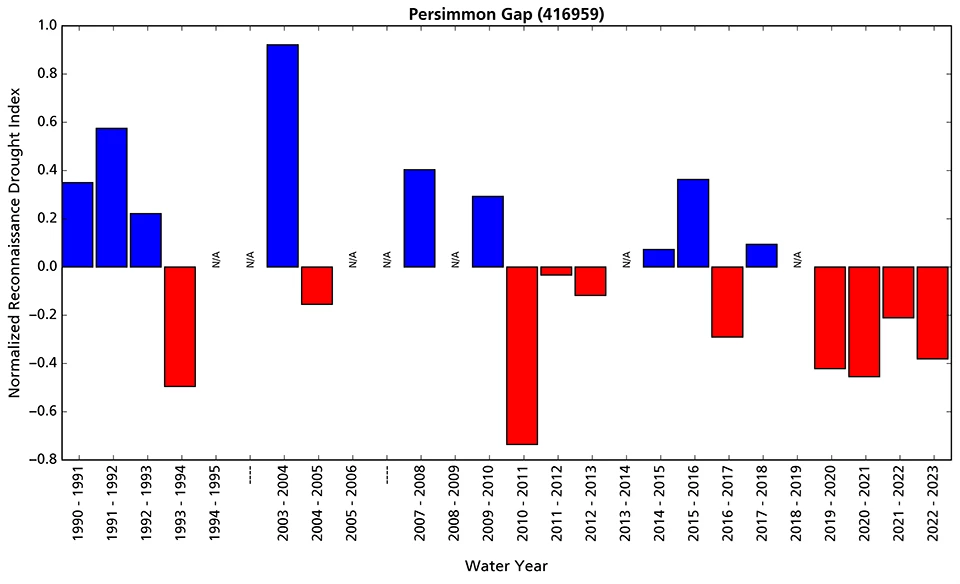
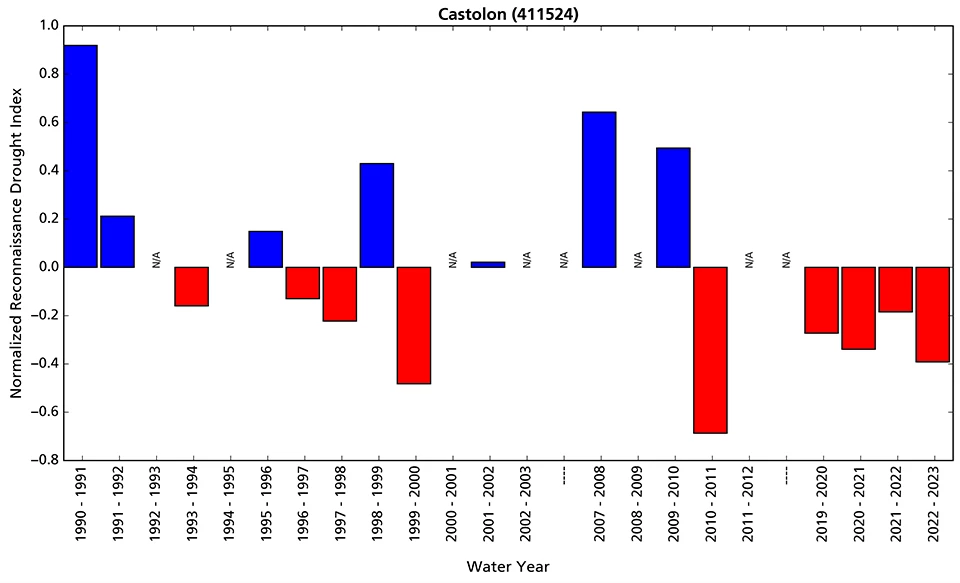
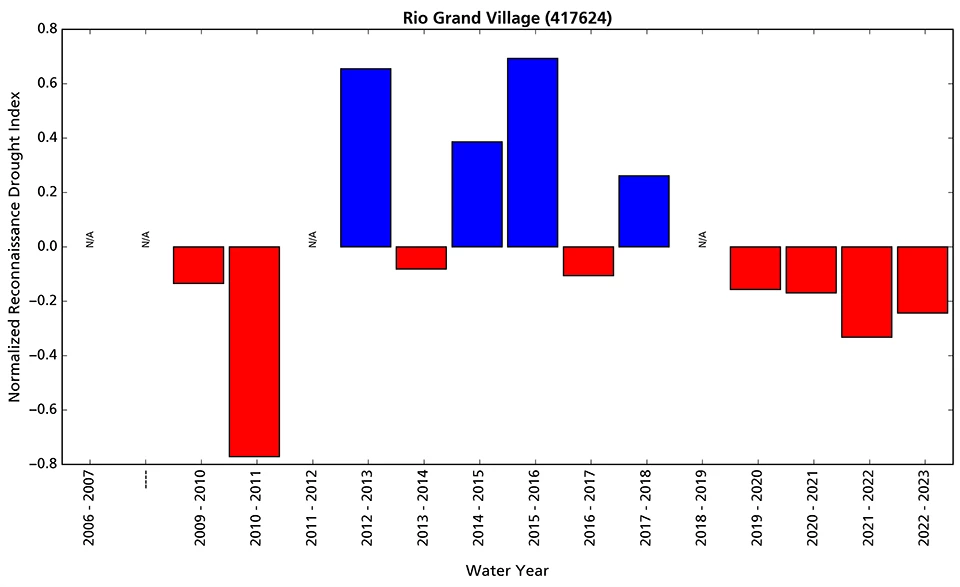
Reconnaissance drought index (Tsakiris and Vangelis 2005) provides a measure of drought severity and extent relative to the long-term climate. It is based on the ratio of average precipitation to average potential evapotranspiration (the amount of water loss that would occur from evaporation and plant transpiration if the water supply was unlimited) over short periods of time (seasons to years). The reconnaissance drought indices for Big Bend National Park indicate that WY2023 was drier than average at all five weather stations from the perspective of both precipitation and potential evapotransporation (Figure 7, Figure 8, Figure 9, Figure 10, and Figure 11). WY2023 was the fourth year in a row of drier than average conditions at four stations and the second year in a row of drier than average conditions at the Chisos Basin station.
Reference: Tsakiris G., and H. Vangelis. 2005. Establishing a drought index incorporating evapotranspiration. European Water 9: 3–11.
NPS
NPS
NPS
NPS
NPS
Groundwater
Groundwater is one of the most critical natural resources of the American Southwest. It provides drinking water, irrigates crops, and sustains rivers, streams, and springs throughout the region.
Groundwater results for WY2023 are not available because of staffing shortages at the park.
Springs
Background
Springs, seeps, and tinajas (discrete pools in a rock basin or impoundments in bedrock) are small, relatively rare biodiversity hotspots in arid lands. They are the primary connection between groundwater and surface water and are important water sources for plants and animals. For springs, the most important questions we ask are about persistence (How long was there water in the spring?) and water quantity (How much water was in the spring?). Springs reporting is by water year (WY), which begins in October of the previous calendar year and goes through September of the current calendar year (e.g., WY2023 runs from October 2022 through September 2023). WY2023 springs sampling at Big Bend National Park occurred 02 February 2023 to 21 February 2023. Water persistence is monitored continuously throughout the water year, but in this report we only present WY2023 persistence data up to the springs sampling visit date.
Methods
Chihuahuan Desert Network springs monitoring is organized into the four modules described below.
Site characterization
This module provides context for interpreting change in the other modules. We record GPS locations, draw a site diagram, and describe the spring type (e.g., helocrene, limnocrene, rheocrene, or tinaja) and its associated vegetation in this module. Helocrene springs emerge as low-gradient wetlands, limnocrene springs emerge as pools, and rheocrene springs emerge as flowing streams. This module is completed once every five years or after significant events.
Site Condition
We estimate the level of natural and anthropogenic disturbances and the level of stress on vegetation and soils at the spring on a scale of 1–4, where 1 = undisturbed, 2 = slightly disturbed, 3 = moderately disturbed, and 4 = highly disturbed. Types of natural disturbances can include flooding, drying, fire, wildlife impacts, windthrow of trees and shrubs, beaver activity, and insect infestations. Anthropogenic disturbances can include roads, off-highway vehicle trails, hiking trails, livestock and feral-animal impacts, removal of invasive non-native plants, flow modification, and other evidence of human use of the spring site. We take repeat photographs from the same location and perspective to show the spring and its landscape context. We note the presence of certain obligate wetland plant species (plant species that almost always occur only in wetlands), facultative wetland plant species (plant species that usually occur in wetlands but also occur in other habitats), and invasive non-native crayfish and bullfrogs (American bullfrog [Lithobates catesbeianus]). We also record the density of invasive non-native plants using a qualitative scale (1–5 plants, scattered patches, evenly distributed patches, or a matrix).
Water Quantity
We measure the persistence of surface water, amount of spring discharge, and wetted extent (area that contained water). To estimate persistence, we analyze the variance of temperature measurements taken by logging thermometers placed at or near the orifice (spring opening). Because water mediates variation in diurnal temperatures, data from a submerged sensor will show less daily variation than data from an exposed, open-air sensor; this tells us when the spring was wet or dry. Surface discharge is measured with a timed sample of water volume. Wetted extent is a systematic measurement of the physical length (up to 100 m), width, and depth of surface water. It is assessed using a technique for either standing water (e.g., limnocrene and helocrene springs) or flowing water (e.g., rheocrene springs).
Water Quality
We measure core water quality and water chemistry parameters. Core water quality parameters include water temperature, pH, specific conductivity (a measure of dissolved compounds and contaminants), dissolved oxygen (how much oxygen is present in the water), and total dissolved solids (an indicator of potentially undesirable compounds). Discrete measurements of these parameters are collected with a multiparameter meter. If the meter fails calibration checks, we do not present data. Water chemistry is assessed by collecting surface water sample(s) and estimating the concentration of major ions with a photometer in the field. These parameters are collected at one or more sampling locations within a spring. Data are presented only for the primary sampling location within each spring. Each perennial spring is somewhat unique, and Texas has not adopted water quality standards that would apply across the diversity of springs described here. Ongoing, long-term data collection at each spring will improve our understanding of the natural range in water quality and water chemistry parameters for a given site.
List of Springs
Scroll down or click on a spring below to view monitoring results.
Bois D'Arc Spring ǀ Cattail Falls ǀ Chilicotal Spring Complex ǀ De La Ho Spring ǀ Government Spring ǀ Grapevine Spring ǀ Lorn Spring ǀ Lower Croton Spring ǀ Mule Ears Spring ǀ Painted Hills Spring ǀ Peña Spring 1 ǀ Red Ass Spring ǀ Rough Spring B ǀ Screwbean Spring ǀ Shelf Spring ǀ Solis Spring ǀ Tiptoe Spring ǀ Water Boy Tinaja
NPS
Bois D'Arc Spring
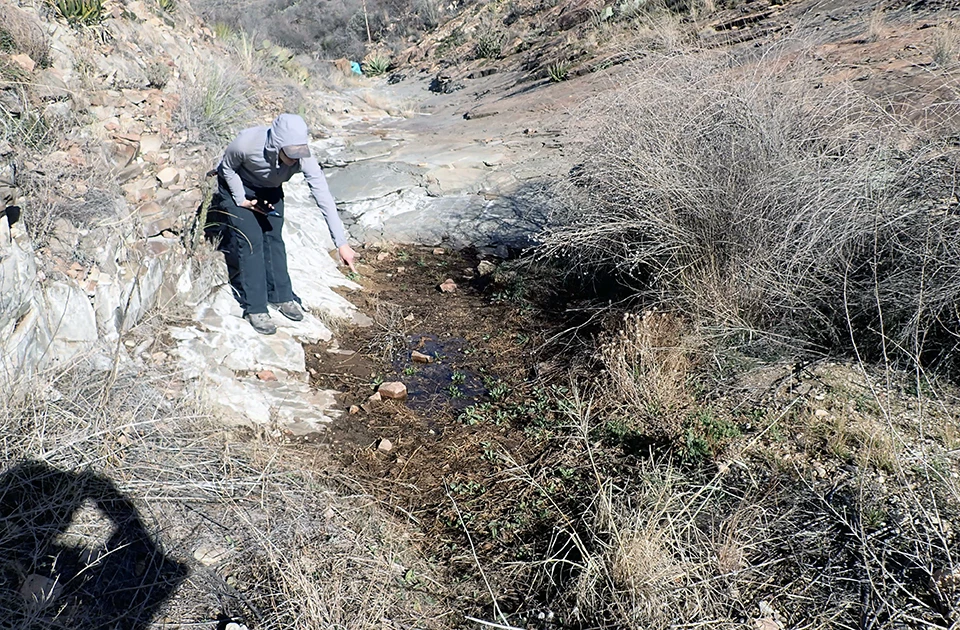
Bois D’Arc Spring (Figure 12) is a rheocrene spring (a spring that emerges into one or more stream channels) located within a bedrock canyon on the north side of the Chisos Mountains. The spring forms an intermittent channel that has ranged in length from 4.7 m to more than 100 m in recent years, although the spring was dry during the WY2022 visit. The WY2023 visit occurred on 04 February 2023, and the spring was wetted (contained water).
Site Condition
In WY2023, we rated Bois D’Arc Spring slightly disturbed by hiking trails because of social trails to and around the site (rated undisturbed in the past); slightly disturbed by feral animals based on tracks around the spring (rated undisturbed to moderately disturbed in the past); and moderately disturbed by drying because two previously wetted orifices were dry at the time of the visit (rated undisturbed to highly disturbed in the past). No other natural or human-caused disturbances were observed at Bois D’Arc Spring in WY2023.
As in past years, we did not observe invasive non-native crayfish or American bullfrog (Lithobates catesbeianus) at Bois D’Arc Spring in WY2023. We observed one invasive non-native plant: scattered patches of Lehmann lovegrass (Eragrostis lehmanniana; scattered patches to evenly distributed patches observed in 2018–2022).
We did not observe any obligate or facultative wetland plants at Bois D’Arc Spring in WY2023. In prior years, sedges (Cyperaceae), rushes (Juncaceae), and monkey flower (Mimulus sp.) were observed.
Water Quantity
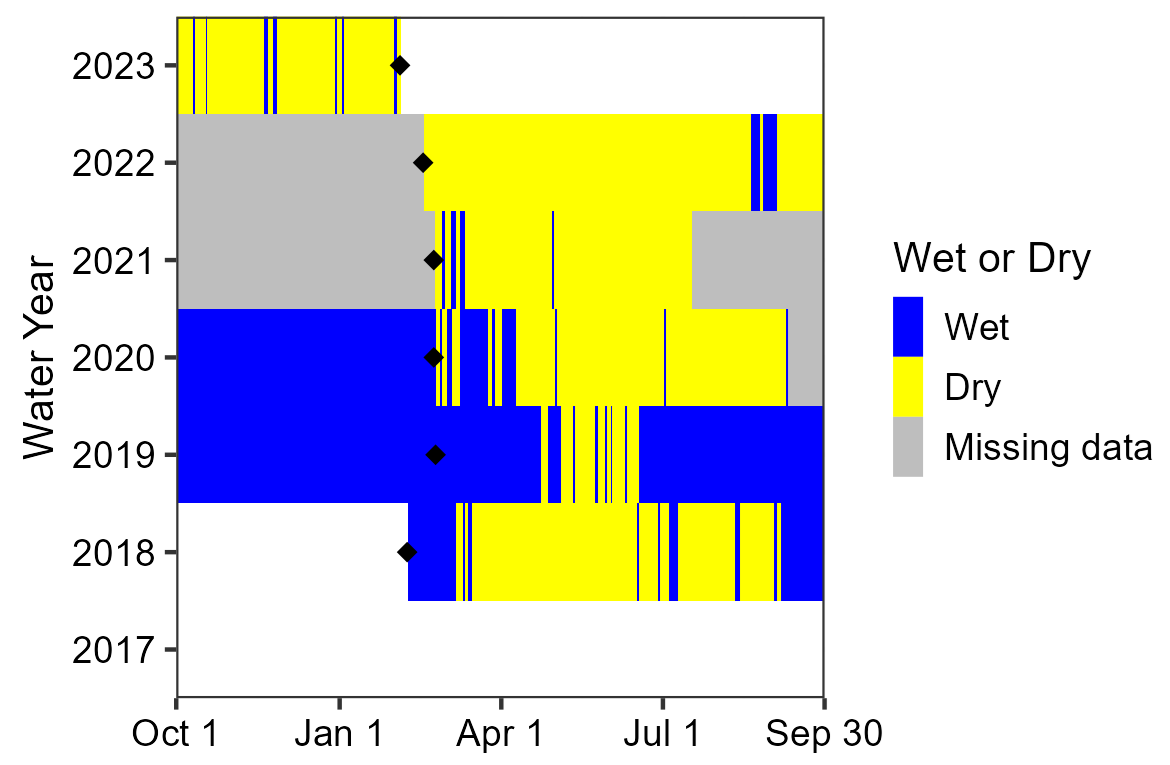
Sensors are deployed and data are downloaded during our annual visit, which takes place in the middle of the water year; the dates of these visits are indicated by black diamonds in the persistence graph (Figure 13). The temperature sensor indicated that Bois D’Arc Spring was wetted for 10 of 127 days (7.9%) measured up to the WY2023 visit. In prior water years, the spring was wetted for 5.8–88.5% of the days measured across entire water years
NPS
Discharge was not measured in WY2023 at the primary sampling location because there was no surface flow. Past data are summarized in Table 1.
Wetted extent was evaluated using a method for flowing water. The total springbrook length was 2.2 m (7.2 ft). In past water years (except WY2022 when the brook was dry), springbrook lengths have ranged from 4.7 m (15.4 ft) to an estimated length between 100 and 200 m (328–656 ft). Width and depth along the springbrook averaged 50.6 cm (19.9 in) and 1.7 cm (0.7 in), respectively. The spring was on the low end of previous length measurements in WY2023, although width and depth of the brook were consistent with prior values (Table 2).
Water Quality
Core water quality (Table 3) and water chemistry data (Table 4) were collected at the primary sampling location, a pool at the primary orifice in WY2023. Previous data for this sampling location are only available for WY2021 since the spring was dry in WY2022. Specific conductivity and total dissolved solids levels surpassed the WY2021 values, while dissolved oxygen, water temperature, and pH values were lower than measurements in WY2021. Alkalinity, calcium, chloride, and potassium values were higher than observed in WY2021. Magnesium was below the detectable limit, which is lower than previously observed. Like in WY2021, sulphate was not detected in WY2023.
Bois D'Arc Data Tables
| Sampling Location | WY2023 Mean (range of prior means) |
Prior Years Measured (# of visits with measurements) |
|---|---|---|
| 005 | c.n.s. (0.8–7.8) | 2019–2020 (2) |
| Measurement | WY2023 Value (range of prior values/means) |
Prior Years Measured (# of visits with measurements) |
|---|---|---|
| Width (cm) | 50.6 ± 30.7 (23.7–93.1) | 2018–2021 (4) |
| Depth (cm) | 1.7 ± 0.9 (0.9–8.9) | 2018–2021 (4) |
| Length (m) | 2.2 (4.7–100.0) | 2018–2021 (4) |
| Sampling Location | Measurement Location | Parameter | WY2023 Value (range of prior values) |
Prior Years Measured (# of measurements) |
|---|---|---|---|---|
| 002 | Center | Dissolved oxygen (mg/L) | 7.66 (11.81) |
2021 (1) |
| 002 | Center | pH | 7.86 (9.64) |
2021 (1) |
| 002 | Center | Specific conductivity (µS/cm) | 319.5 (240.3) |
2021 (1) |
| 002 | Center | Temperature (°C) | 9.5 (11.7) |
2021 (1) |
| 002 | Center | Total dissolved solids (mg/L) | 208 (156) |
2021 (1) |
| Sampling Location | Measurement Location | Parameter | WY2023 Value (range of prior values) |
Prior Years Measured (# of measurements) |
|---|---|---|---|---|
| 002 | Center | Alkalinity (CaCO3) |
90 (75) |
2021 (1) |
| 002 | Center | Calcium (Ca) |
52 (22) |
2021 (1) |
| 002 | Center | Chloride (Cl) |
4 (0) |
2021 (1) |
| 002 | Center | Magnesium (Mg) |
b.d.l. (10) |
2021 (1) |
| 002 | Center | Potassium (K) |
1.8 (0) |
2021 (1) |
| 001 | Center | Sulphate (SO4) |
0 (0) |
2021 (1) |
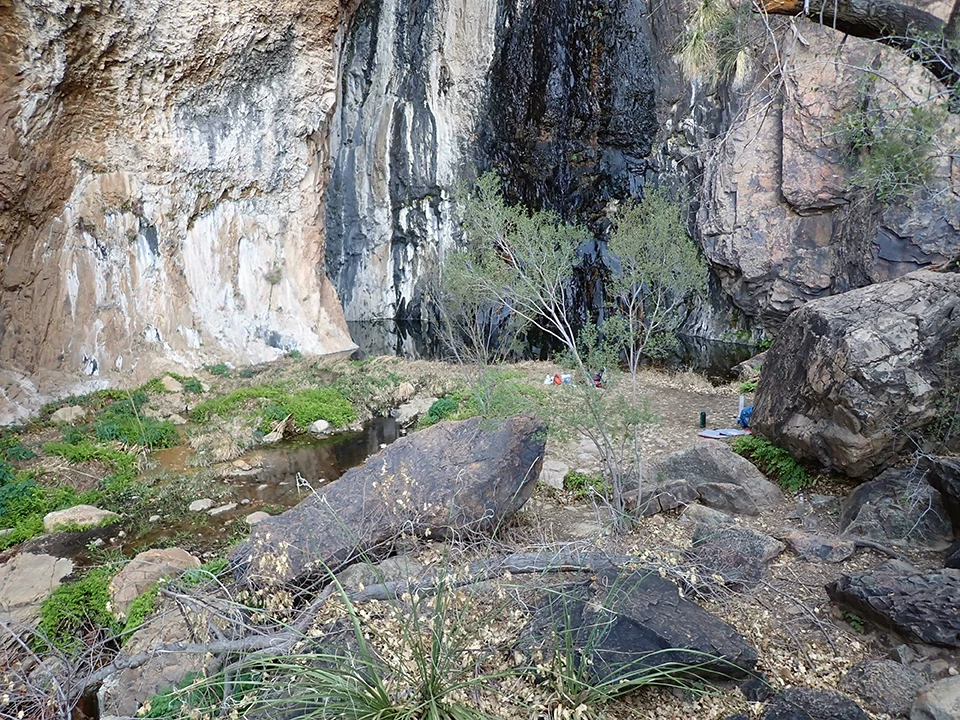
NPS
Cattail Falls
Cattail Falls (Figure 14) is a rheocrene spring (a spring that emerges into one or more stream channels) located in Cattail Canyon on the northwest side of the Chisos Mountains. The spring begins high in the mountains and flows over a steep pouroff into a wide pool. A channel flows out of the pool, forming deep, clear plunge pools surrounded by boulders and dense vegetation. The springbrook has consistently reached 95–98 m in length (measured from the base of the falls) in recent years. The WY2023 visit occurred on 21 February 2023, and the spring was wetted (contained water).
Site Condition
In WY2023, we rated Cattail Falls slightly disturbed by flow modification because of a diversion pipe and springbox (rated undisturbed to slightly disturbed in the past); slightly disturbed by wildlife based on tracks and scat (rated undisturbed to slightly disturbed in the past); slightly disturbed by windthrow based on fallen tree branches in and around spring (rated undisturbed to moderately disturbed in the past); moderately disturbed by hiking trails, with a popular trail leading directly to the spring and defined social trails that lead to banks along the springbrook (rated moderately to highly disturbed in the past); and moderately disturbed by contemporary human use based on trampled vegetation and several people seen in the area during monitoring (rated moderately to highly disturbed in the past). No other natural or human-caused disturbances were observed at Cattail Falls in WY2023.
As in past years, we did not observe invasive non-native crayfish or American bullfrog (Lithobates catesbeianus) at Cattail Falls in WY2023. We observed one invasive non-native plant: 1–5 sowthistle plants (Sonchus sp., not previously observed).
We observed five obligate or facultative wetland plants at Cattail Falls in WY2023. We observed bluestem (Andropogon sp., a grass observed in 2018–2022); cattail (Typhaceae, a plant observed in 2018–2022); lobelia (Lobelia sp., a forb observed in 2017 and 2021); maidenhair fern (Adiantum sp., a fern observed in 2018–2022); and a member of the rush family (Juncaceae, observed in 2018–2022).
Water Quantity
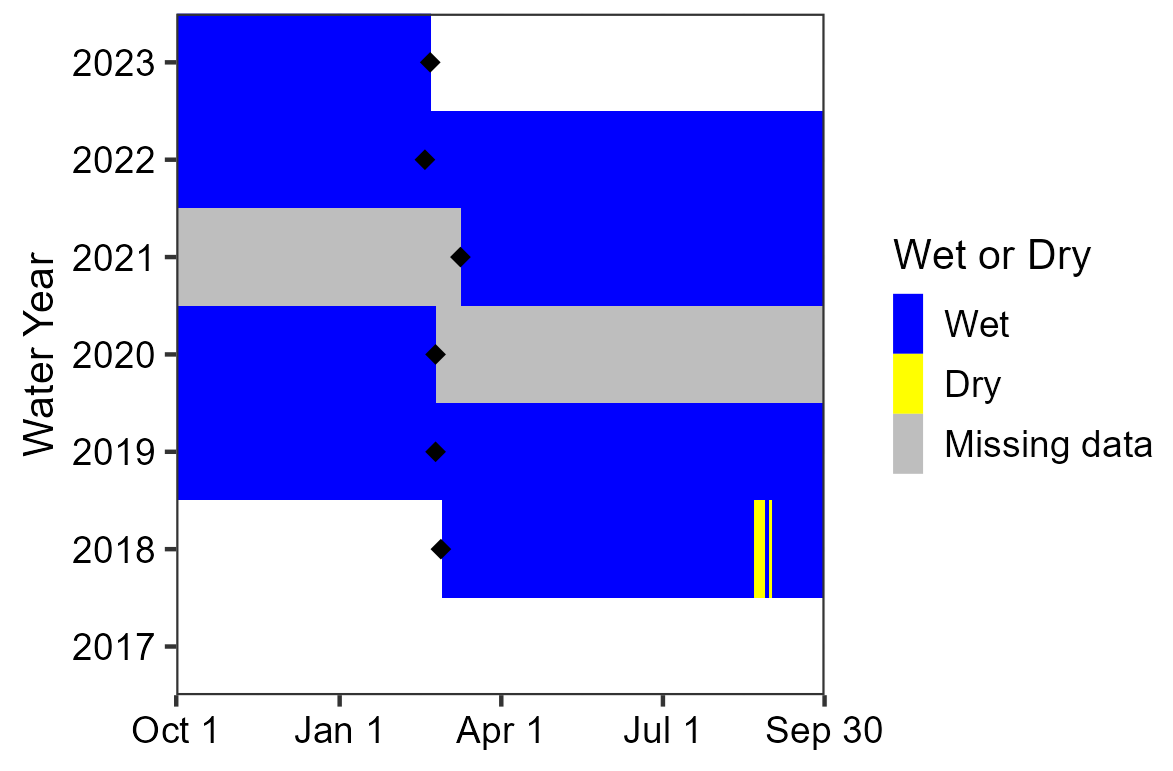
Sensors are deployed and data are downloaded during our annual visit, which takes place in the middle of the water year; the dates of these visits are indicated by black diamonds in the persistence graph (Figure 15). The temperature sensor indicated that Cattail Falls was wetted for 144 of 144 days (100%) measured up to the WY2023 visit. In prior water years, the spring was wetted 96.3–100% of the days measured across entire water years.
NPS
Discharge was estimated at 47.1 ± 3.2 L/min (12.4 ± 0.8 gal/min) in WY2023. WY2023 discharge was consistent with the historical range of measurements (40.1–72.1 L/min in 2018–2022; Table 5).
Wetted extent was evaluated using a method for flowing water. The total springbrook length in WY2023 was 98.9 m (324.5 ft). In the past, springbrook lengths ranged from 94.7 to 98.1 m (310.7–321.9 ft). Width and depth along the springbrook averaged 4.2 m (13.8 ft) and 10.6 cm (4.2 in), respectively. The mean width was slightly above the range of historical values, while the mean depth was consistent with the previous range of means (2018–2022; Table 6).
Water Quality
Core water quality (Table 7) and water chemistry (Table 8) data were collected at the primary sampling location on the edge of the main pool at the base of the falls in WY2023. Values for dissolved oxygen and pH were both lower than the range of values recorded in previous years (2018–2022), while specific conductivity, water temperature, and total dissolved solids were within ranges of prior values. Alkalinity, calcium, chloride, potassium, and sulphate values were all below previous values. Magnesium levels were similar to prior years.
Cattail Falls Data Tables
| Sampling Location | WY2023 Mean (range of prior means) |
Prior Years Measured (# of visits with measurements) |
|---|---|---|
| 003 | 47.1 ± 3.2 (40.1–72.1) | 2018–2022 (5) |
| Measurement | WY2023 Value (range of prior values/means) |
Prior Years Measured (# of visits with measurements) |
|---|---|---|
| Width (m) | 4.2 ± 3.8 (3.0–4.1) | 2018–2022 (5) |
| Depth (cm) | 10.6 ± 6.6 (6.1–16.3) | 2018–2022 (5) |
| Length (m) | 98.9 (94.7–98.1) | 2018–2022 (5) |
| Sampling Location | Measurement Location | Parameter | WY2023 Value (range of prior values) |
Prior Years Measured (# of measurements) |
|---|---|---|---|---|
| 001 | Center | Dissolved oxygen (mg/L) | 3.44 (7.36–8.49) |
2018–2022 (5) |
| 001 | Center | pH | 7.04 (7.48–8.10) |
2018–2022 (5) |
| 001 | Center | Specific conductivity (µS/cm) | 396.4 (200.7–441.8) |
2019–2022 (4) |
| 001 | Center | Temperature (°C) | 10.5 (9.5–14.6) |
2018–2022 (7) |
| 001 | Center | Total dissolved solids (mg/L) | 258 (130–299) |
2018–2022 (5) |
| Sampling Location | Measurement Location | Parameter | WY2023 Value (range of prior values) |
Prior Years Measured (# of measurements) |
|---|---|---|---|---|
| 001 | Center | Alkalinity (CaCO3) |
25 (65–130) |
2018–2022 (5) |
| 001 | Center | Calcium (Ca) |
2 (34–54) |
2018–2022 (5) |
| 001 | Center | Chloride (Cl) |
1 (9–27) |
2018–2022 (5) |
| 001 | Center | Magnesium (Mg) |
12 (7–14) |
2018–2022 (5) |
| 001 | Center | Potassium (K) |
1.3 (1.5–1.9) |
2018–2022 (5) |
| 001 | Center | Sulphate (SO4) |
33 (75–93) |
2018–2022 (5) |
NPS
Chilicotal Spring Complex
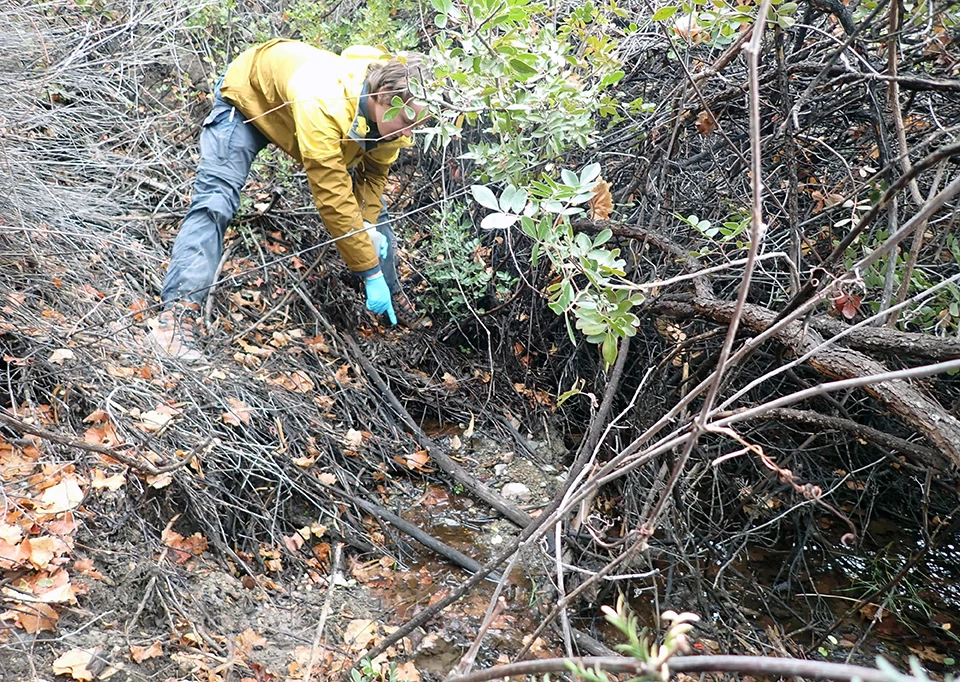
Chilicotal Spring Complex (Figure 16) is a rheocrene spring (a spring that emerges into one or more stream channels) located inside a drainage in the desert shrublands northeast of Chilicotal Mountain. The spring emerges from the side of a steep and densely vegetated bank, forming a springbrook that has been estimated at up to 200–500 m in length. The WY2023 visit occurred on 02 February 2023, and the spring was wetted (contained water).
Site Condition
In WY2023, we rated Chilicotal Spring Complex slightly disturbed by contemporary human use based on footprints around the spring (rated undisturbed in the past) and slightly disturbed by wildlife, with tracks and scat present (rated undisturbed to slightly disturbed in the past). No other natural or human-caused disturbances were observed at Chilicotal Spring Complex in WY2023.
We did not observe invasive non-native crayfish or American bullfrog (Lithobates catesbeianus) at Chilicotal Spring Complex in WY2023. We observed three invasive non-native plants: a matrix of Bermudagrass (Cynodon dactylon, scattered to evenly distributed patches observed in 2017–2022); 1–5 sowthistle plants (Sonchus sp., not previously observed); and scattered patches of tamarisk (Tamarix sp., 1–5 plants observed in 2018–2022).
We observed seven obligate or facultative wetland plants at Chilicotal Spring Complex in WY2023: cattail (Typhaceae, a plant observed in 2017–2022); cottonwood (Populus sp., a tree observed in 2019–2020); flatsedge (Cyperus sp., a sedge observed in 2018–2022); mule-fat (Baccharis salicifolia, a shrub observed in 2017–2022); a member of the rush family (Juncaceae, observed in 2018–2022); tamarisk (Tamarix sp., a tree observed in 2017–2022); and willow (Salix sp., a tree observed in 2017–2022).
Water Quantity
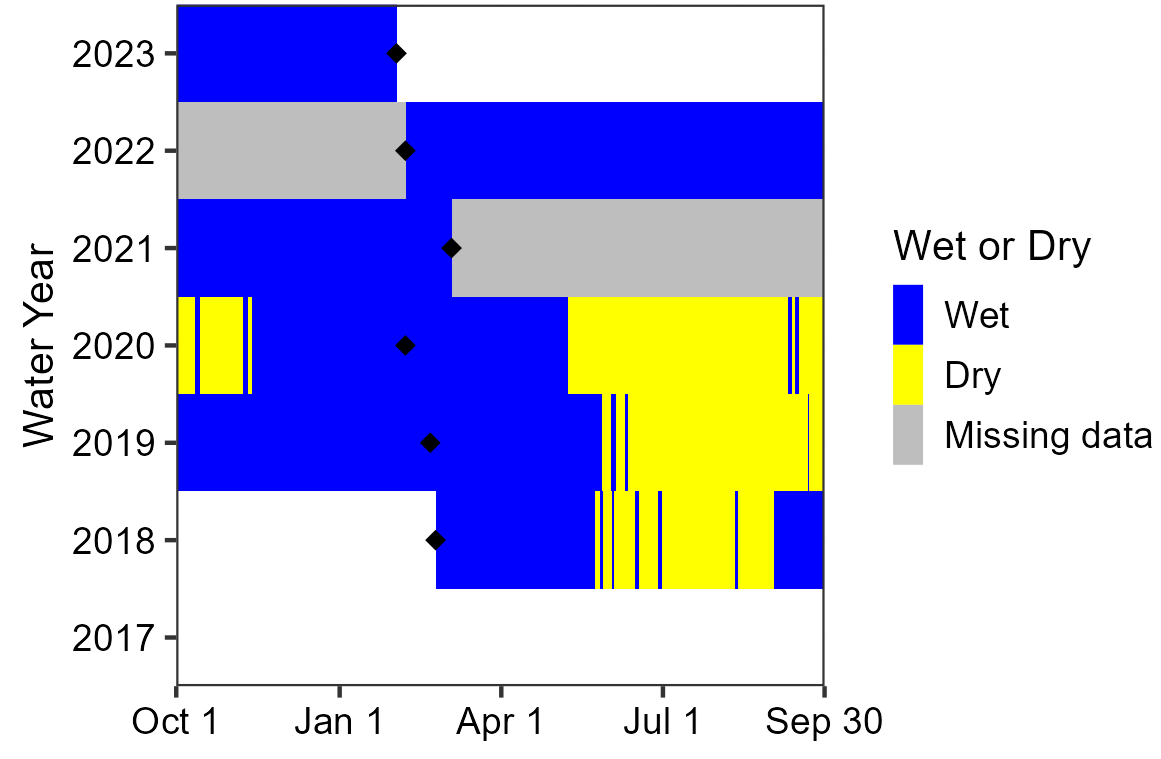
Sensors are deployed and data are downloaded during our annual visit, which takes place in the middle of the water year; the dates of these visits are indicated by black diamonds in the persistence graph (Figure 17). The temperature sensor indicated that Chilicotal Spring Complex was wetted for 125 of 125 days (100%) measured up to the WY2023 visit. In prior water years, the spring was wetted 51.4–100% of the days measured across entire water years.
NPS
Discharge was estimated at 18.1 ± 1.1 L/min (4.8 ± 0.3 gal/min) in WY2023 at the primary sampling location. In prior years, discharge could not be sampled at this location (Table 9).
Wetted extent was evaluated using a method for flowing water. The total springbrook length in WY2023 was estimated at between 100 and 200 m (328–656 ft), however the measured springbrook length was limited to the first 41.7 m (136.8 ft) because the channel was not safe to access beyond that point. In the past, springbrook lengths ranged from 22.1 m (72.5 ft) to an estimated length exceeding 500 m (>1,640 ft). Width and depth along the first 41.7 m (136.8 ft) of the springbrook averaged 40.1 cm (15.8 in) and 1.3 cm (0.5 in), respectively. The mean width and depth of the springbrook were below the historical ranges for these values. The mean length was consistent with the range of values from prior years (Table 10).
Water Quality
Core water quality (Table 11) and water chemistry (Table 12) data were collected at the primary sampling location near the orifice in WY2023. Values for specific conductivity, water temperature, and total dissolved solids were all consistent with prior years, while dissolved oxygen and pH values were slightly higher. Alkalinity, calcium, and magnesium values were consistent with previously collected data. Chloride was lower and potassium was higher than values recorded in previous years. Sulphate was not detected in WY2023.
Chilicotal Spring Complex Data Tables
| Sampling Location | WY2023 Mean (range of prior means) |
Prior Years Measured (# of visits with measurements) |
|---|---|---|
| 001 | 18.1 ± 1.1 (c.n.s.) | c.n.s. |
| Measurement | WY2023 Value (range of prior values/means) |
Prior Years Measured (# of visits with measurements) |
|---|---|---|
| Width (cm) | 40.1 ± 62.2 (102.1–575.9) | 2018–2022 (5) |
| Depth (cm) | 1.3 ± 1.8 (2.0–21.8) | 2018–2022 (5) |
| Length (m) | 41.7 (22.1–100.0) | 2018–2022 (5) |
| Sampling Location | Measurement Location | Parameter | WY2023 Value (range of prior values) |
Prior Years Measured (# of measurements) |
|---|---|---|---|---|
| 001 | Center | Dissolved oxygen (mg/L) | 8.69 (5.22–8.63) |
2018–2022 (5) |
| 001 | Center | pH | 7.80 (7.44–7.78) |
2018–2022 (5) |
| 001 | Center | Specific conductivity (µS/cm) | 356.8 (343.5–381.1) |
2019–2022 (4) |
| 001 | Center | Temperature (°C) | 12.6 (10.3–17.6) |
2018–2022 (7) |
| 001 | Center | Total dissolved solids (mg/L) | 232.0 (222.9–248.0) |
2018–2022 (5) |
| Sampling Location | Measurement Location | Parameter | WY2023 Value (range of prior values) |
Prior Years Measured (# of measurements) |
|---|---|---|---|---|
| 001 | Center | Alkalinity (CaCO3) |
150 (135–185) |
2018–2022 (5) |
| 001 | Center | Calcium (Ca) |
30 (26–46) |
2018–2022 (5) |
| 001 | Center | Chloride (Cl) |
8 (14–23) |
2018–2022 (5) |
| 001 | Center | Magnesium (Mg) |
12 (5–80) |
2018–2022 (5) |
| 001 | Center | Potassium (K) |
1.4 (0.0–0.7) |
2018–2022 (5) |
| 001 | Center | Sulphate (SO4) |
0 (1–8) |
2018–2022 (5) |
NPS
De La Ho Spring
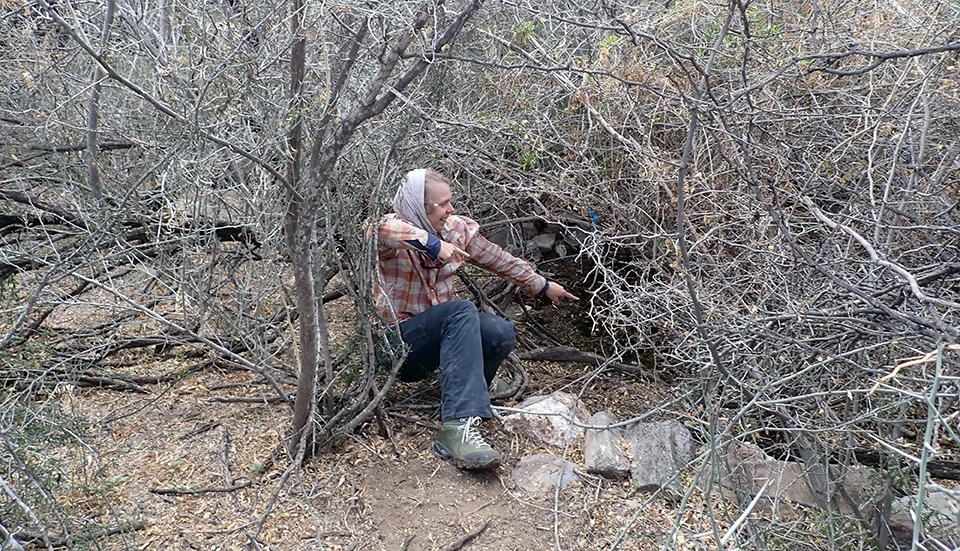
De La Ho Spring (Figure 18) is a helocrene spring (a spring that emerges into marshy, wet meadow settings—low-gradient wetlands) located about 3 km southeast of Cerro Castolon. De La Ho Spring is a shallow pool surrounded by a dense thicket of trees and shrubs and is confined by a rock wall on one bank. The pool has been measured up to 7.5 m long and 4.4 m wide in recent years. The WY2023 visit occurred on 16 February 2023, and the spring was wetted (contained water).
Site Condition
In WY2023, we rated De La Ho Spring slightly disturbed by flow modification because of a rock embankment along one side of spring (rated undisturbed to highly disturbed in the past); slightly disturbed by drying based on a reduction in pool size from prior years and the presence of mineral deposits (rated undisturbed to slightly disturbed in the past); slightly disturbed by wildlife, with scat and bones present (rated slightly disturbed in the past); and slightly disturbed by windthrow, with downed tree branches in and around the spring (rated undisturbed to highly disturbed in the past). No other natural or human-caused disturbances were observed at De La Ho Spring in WY2023.
As in past years, we did not observe invasive non-native crayfish or American bullfrog (Lithobates catesbeianus) at De La Ho Spring in WY2023. We observed one invasive non-native plant: scattered patches of tree tobacco (Nicotiana glauca, 1–5 plants to scattered patches observed in 2017–2022).
We observed three obligate or facultative wetland plants at De La Ho Spring in WY2023: mule-fat (Baccharis salicifolia, a shrub observed in 2017–2022); rushes (Juncaceae, observed in 2018–2022); and willow (Salix sp., a tree observed in 2017–2022).
Water Quantity
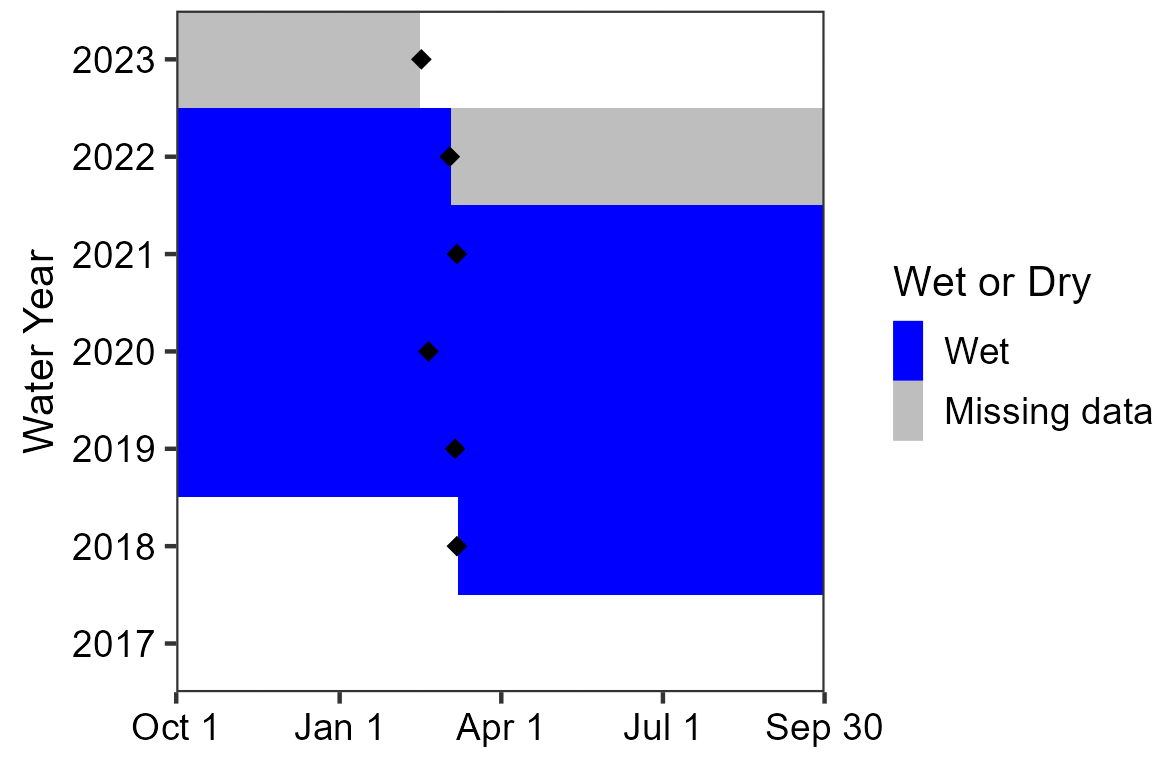
Sensors are deployed and data are downloaded during our annual visit, which takes place in the middle of the water year; the dates of these visits are indicated by black diamonds in the persistence graph (Figure 19). The most recent temperature sensor data were unavailable at time of publication, so there is no estimate of persistence for WY2023. In prior water years, the spring was wetted 100% of the days measured across entire water years.
NPS
As in past years, there was no measurable discharge.
Wetted extent was evaluated using a method for standing water. Width averaged 2.7 m (8.9 ft), length averaged 4.9 m (16.1 ft), and depth averaged 7.3 cm (2.9 in) in WY2023. The mean width and length of De La Ho Spring were below the ranges of means from previous years, while the mean depth was within the range of prior values (Table 13).
Water Quality
Core water quality (Table 14) and water chemistry (Table 15) data were collected at the primary sampling location along the edge of the pool next to the rock wall in WY2023. Values for dissolved oxygen, specific conductivity, and total dissolved solids were consistent with ranges recorded in previous years. Water temperature and pH were measured at just below previous values. Alkalinity, calcium, chloride, and sulphate values were all consistent with prior measurements. Magnesium and potassium levels were slightly higher than previously observed.
De La Ho Spring Data Tables
| Measurement | WY2023 Mean (range of prior means) |
Prior Years Measured (# of visits with measurements) |
|---|---|---|
| Width (m) | 2.7 ± 0.6 (3.3–4.4) | 2018–2022 (5) |
| Depth (cm) | 7.3 ± 6.3 (2.0–17.5) | 2018–2022 (5) |
| Length (m) | 4.9 ± 1.1 (5.3–7.5) | 2018–2022 (5) |
| Sampling Location | Measurement Location | Parameter | WY2023 Value (range of prior values) |
Prior Years Measured (# of measurements) |
|---|---|---|---|---|
| 001 | Center | Dissolved oxygen (mg/L) | 5.15 (0.18–16.69) |
2018–2022 (5) |
| 001 | Center | pH | 7.39 (7.55–8.89) |
2018–2022 (5) |
| 001 | Center | Specific conductivity (µS/cm) | 580.0 (495.7–612.0) |
2018–2022 (5) |
| 001 | Center | Temperature (°C) | 17.6 (18.0–26.0) |
2018–2022 (7) |
| 001 | Center | Total dissolved solids (mg/L) | 377 (317–398) |
2018–2022 (5) |
| Sampling Location | Measurement Location | Parameter | WY2023 Value (range of prior values) |
Prior Years Measured (# of measurements) |
|---|---|---|---|---|
| 001 | Center | Alkalinity (CaCO3) |
185 (b.d.l.–185) |
2018–2022 (5) |
| 001 | Center | Calcium (Ca) |
24 (14–26) |
2018–2022 (5) |
| 001 | Center | Chloride (Cl) |
13 (6–17) |
2018–2022 (5) |
| 001 | Center | Magnesium (Mg) |
13 (b.d.l.–12) |
2018–2022 (5) |
| 001 | Center | Potassium (K) |
4.8 (2.6–4.2) |
2018–2022 (5) |
| 001 | Center | Sulphate (SO4) |
73 (40–118) |
2018–2022 (5) |
NPS
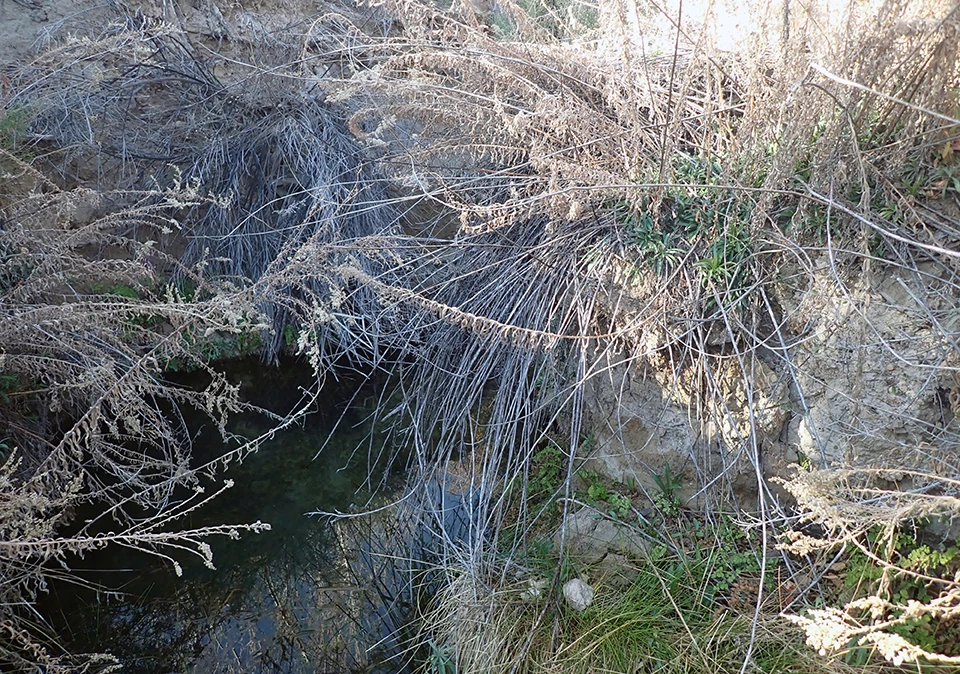
Government Spring
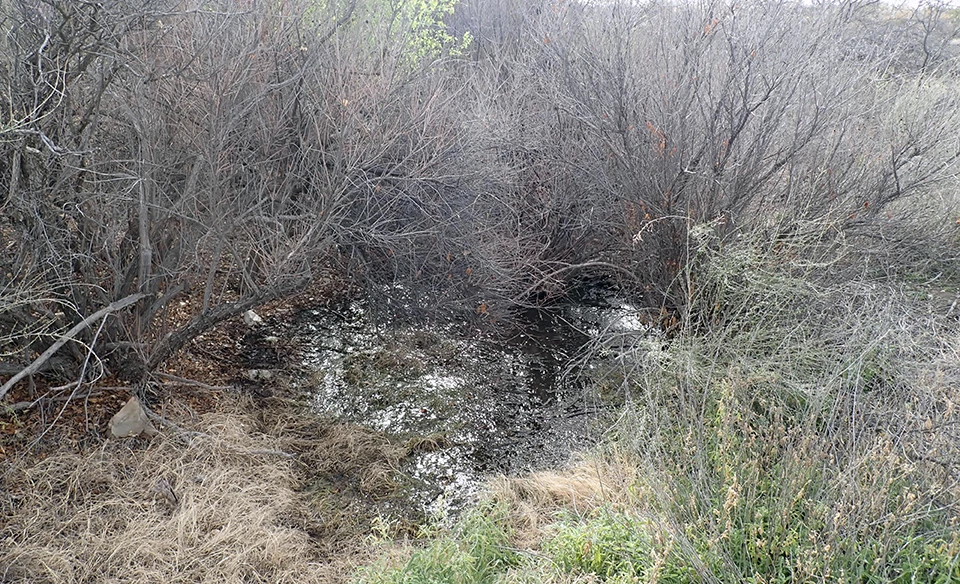
Government Spring (Figure 20) is a limnocrene spring (a spring emerging as a pool) located near an established campsite and the intersection of Grapevine Hills Road and the main park road. The spring is diverted into a locked springbox, and it also forms a pool located 15–20 m away, with no surface channel connecting the two. The pool has been measured up to 4 m wide and 6.5 m long in recent years. Water in the springbox and pool is cool and clear with significant leaf litter from surrounding trees. The WY2023 visit occurred on 16 February 2023, and the spring was wetted (contained water).
Site Condition
In WY2023, we rated Government Spring slightly disturbed by hiking trails based on a social trail to the spring (rated moderately to highly disturbed in the past); slightly disturbed by contemporary humans, with a campsite within 200 m of the spring (rated moderately to highly disturbed in the past); slightly disturbed by other anthropogenic effects, such as piles of woody debris (rated undisturbed in the past); slightly disturbed by wildlife based on scat (rated slightly to moderately disturbed in the past); moderately disturbed by roads, with a road within 200 m of the spring (rated undisturbed to slightly disturbed in the past); and highly disturbed by flow modification because the flow is confined into a spring box (rated highly disturbed in the past). No other natural or human-caused disturbances were observed at Government Spring in WY2023.
As in past years, we did not observe invasive non-native crayfish or American bullfrog (Lithobates catesbeianus) at Government Spring in WY2023. We observed three invasive non-native plants: evenly distributed patches of Bermudagrass (Cynodon dactylon, scattered patches observed in 2019–2021); scattered patches of Lehmann lovegrass (Eragrostis lehmanniana, scattered patches to evenly distributed patches observed in 2020–2022); and scattered patches of horehound (Marrubium vulgare, scattered patches observed in 2019–2022).
We observed three obligate or facultative wetland plants at Government Spring in WY2023: common buttonbush (Cephalanthus occidentalis, a shrub observed in 2021 and 2022); cottonwood (Populus sp., a tree observed in 2019–2022); and mule-fat (Baccharis salicifolia, a shrub observed in 2019–2022).
Water Quantity
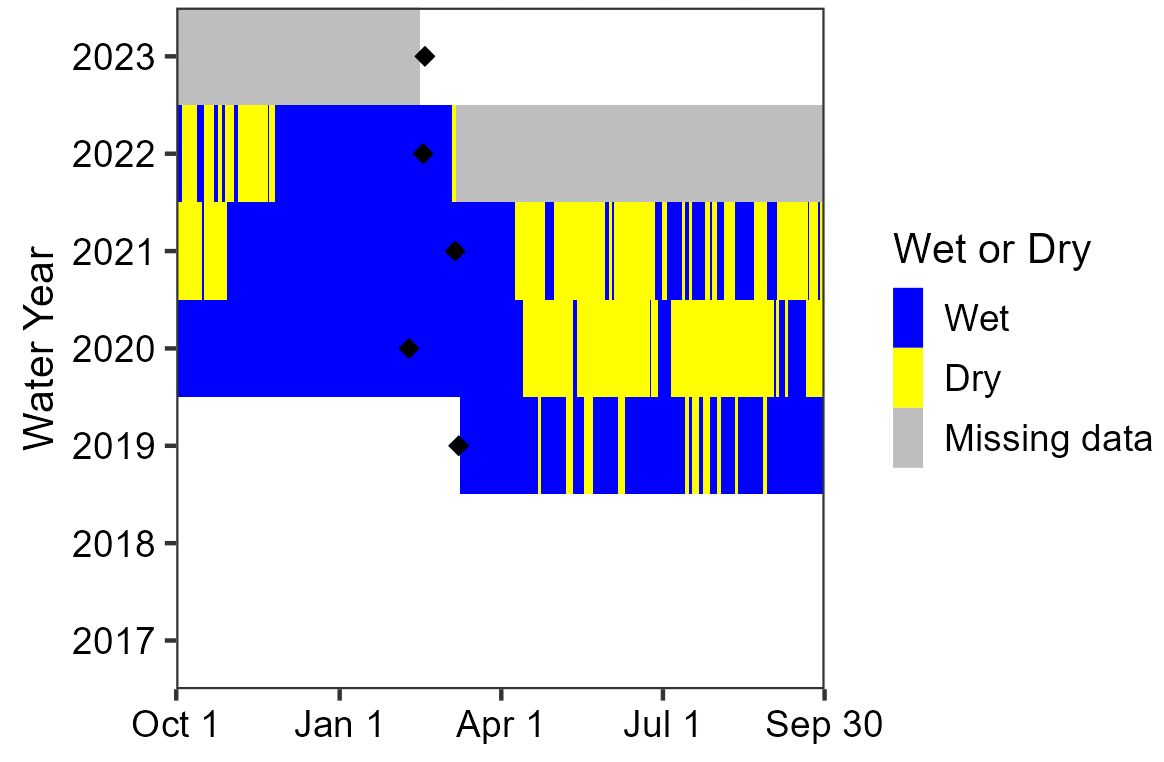
Sensors are deployed and data are downloaded during our annual visit, which takes place in the middle of the water year; the dates of these visits are indicated by black diamonds in the persistence graph (Figure 21). The temperature sensor data are missing due to a sensor malfunction shortly after deployment so there is no estimate of persistence for WY2023. In prior water years, the spring was wetted 59.2–84.9% of the days measured across entire water years.
NPS
As in past years, there was no measurable discharge in WY2023.
Wetted extent was evaluated using a method for standing water. Width averaged 3.4 m (11.2 ft), length averaged 5.4 m (17.7 ft), and depth averaged 12.3 cm (4.8 in) in WY2023. Mean width, depth, and length of the springbrook were all consistent with mean values from prior years (Table 16).
Water Quality
Core water quality (Table 17) and water chemistry (Table 18) data were from inside the springbox at Government Spring in WY2023. Water temperature, total dissolved solids, and pH values were comparable to prior observations, while specific conductivity was slightly below and dissolved oxygen was slightly above previous measurements. Values for alkalinity, calcium, magnesium, and potassium were all consistent with previous observations, while chloride and sulphate were lower than in the past.
Government Spring Data Tables
| Measurement | WY2023 Mean (range of prior means) |
Prior Years Measured (# of visits with measurements) |
|---|---|---|
| Width (m) | 3.4 ± 0.3 (2.4–4.0) | 2019–2022 (4) |
| Depth (cm) | 12.3 ± 2.3 (10.0–13.5) | 2019–2022 (4) |
| Length (m) | 5.4 ± 0.6 (3.6–6.5) | 2019–2022 (4) |
| Sampling Location | Measurement Location | Parameter | WY2023 Value (range of prior values) |
Prior Years Measured (# of measurements) |
|---|---|---|---|---|
| 001 | Center | Dissolved oxygen (mg/L) | 3.12 (2.14–2.82) |
2019–2022 (10) |
| 001 | Center | pH | 7.26 (7.07–8.47) |
2019–2022 (10) |
| 001 | Center | Specific conductivity (µS/cm) | 224.8 (225.2–232.2) |
2019–2022 (10) |
| 001 | Center | Temperature (°C) | 17.4 (17.2–19.2) |
2019–2022 (13) |
| 001 | Center | Total dissolved solids (mg/L) | 146 (146–151) |
2019–2022 (10) |
| Sampling Location | Measurement Location | Parameter | WY2023 Value (range of prior values) |
Prior Years Measured (# of measurements) |
|---|---|---|---|---|
| 001 | Center | Alkalinity (CaCO3) |
80 (80–105) |
2019–2022 (4) |
| 001 | Center | Calcium (Ca) |
26 (20–26) |
2019–2022 (4) |
| 001 | Center | Chloride (Cl) |
4 (8–13) |
2019–2022 (4) |
| 001 | Center | Magnesium (Mg) |
13 (9–13) |
2019–2022 (4) |
| 001 | Center | Potassium (K) |
0.2 (0.0–1.2) |
2019–2022 (4) |
| 001 | Center | Sulphate (SO4) |
1 (3–8) |
2019–2022 (4) |
NPS
Grapevine Spring
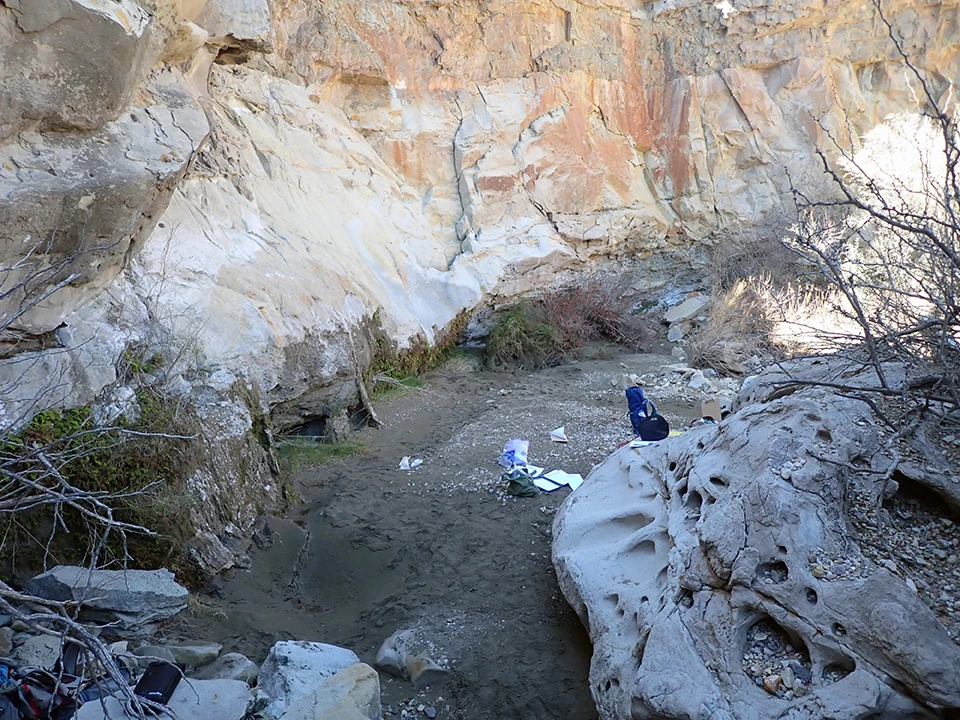
Grapevine Spring (Figure 22) is a rheocrene spring (a spring that emerges into one or more stream channels) located northeast of the Grapevine Hills. The spring emerges from an undercut bank inside a wash, forming a narrow channel with slow flow and a series of small, shallow pools. In recent years, brook length has ranged from 15–47 m. Aquatic plants and animals are abundant at the spring, including frogs near the primary orifice. We saw a deer carcass just beyond the end of the springbrook. The WY2023 visit occurred on 05 February 2023, and the spring was wetted (contained water).
Site Condition
In WY2023, no natural or human-caused disturbances were observed at Grapevine Spring. As in past years, we did not observe invasive non-native crayfish or American bullfrog (Lithobates catesbeianus), and we did not observe any invasive non-native plants in WY2023.
We observed five obligate or facultative wetland plants in WY2023: bluestem (Andropogon sp., a grass observed in 2017–2022); maidenhair fern (Adiantum sp., a fern observed in 2018–2022); mule-fat (Baccharis salicifolia, a shrub observed in 2017–2022); spikerush (Eleocharis sp., a sedge observed in 2018–2022); and willow (Salix sp., a tree observed in 2017–2022).
Water Quantity
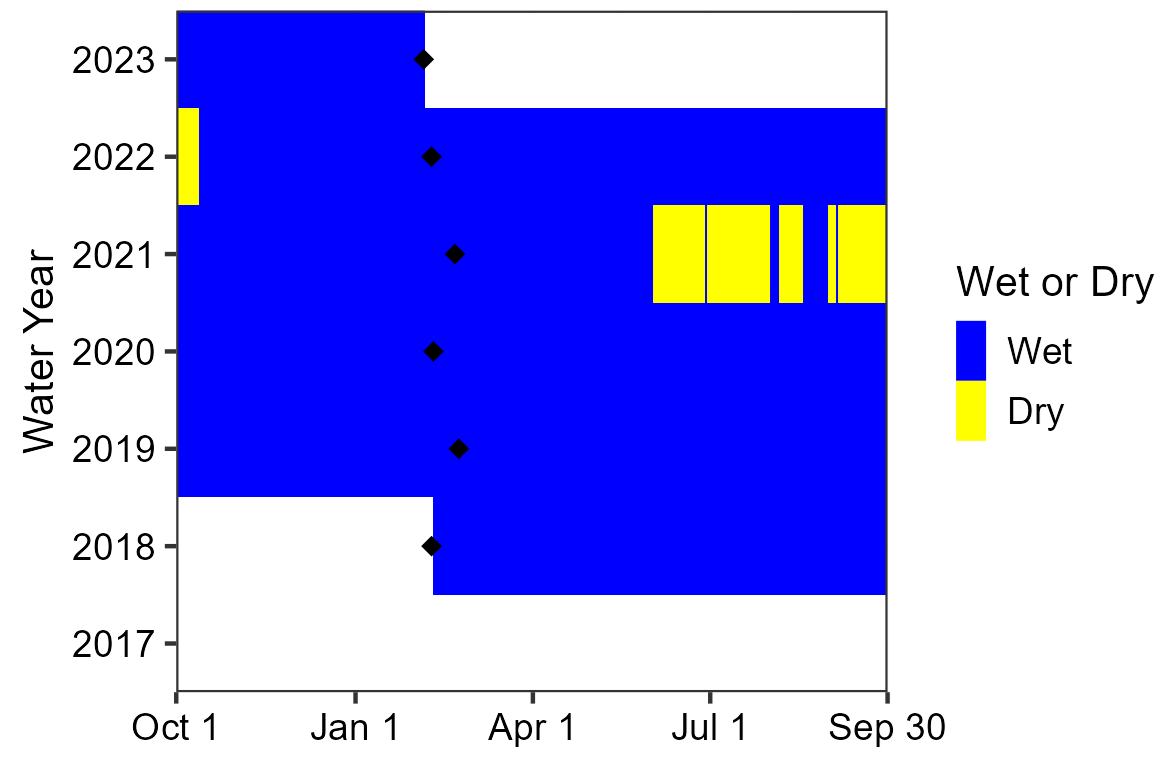
Sensors are deployed and data are downloaded during our annual visit, which takes place in the middle of the water year; the dates of these visits are indicated by black diamonds in the persistence graph (Figure 23). The temperature sensor indicated that Grapevine Spring was wetted for 128 of 128 days (100%) measured up to the WY2023 visit. In prior water years, the spring was wetted 72.6–100% of the days measured across entire water years.
NPS
Discharge was not measured in WY2023 because of a lack of measurable flow. Past data are summarized in Table 19.
Wetted extent was evaluated using a method for flowing water. The total springbrook length in WY2023 was 21.6 m (70.9 ft). Width averaged 91.8 cm (36.1 in) and depth averaged 13.8 cm (5.4 in). Length, width, and depth of the springbrook were consistent with the ranges of means from prior years (Table 20).
Water Quality
Core water quality (Table 21) and water chemistry (Table 22) data in WY2023 were collected at the primary sampling location about 2–3 m away from the actual orifice, where the pool becomes safely accessible. Values for dissolved oxygen, specific conductivity, water temperature, and total dissolved solids were within ranges of previous values, while the pH was lower than in prior years. Alkalinity, calcium, chloride, magnesium, potassium, and sulphate values were similar to previous measurements.
Grapevine Spring Data Tables
| Sampling Location | WY2023 Mean (range of prior means) |
Prior Years Measured (# of visits with measurements) |
|---|---|---|
| 007 | c.n.s. (3.9) | 2022 (1) |
| Measurement | WY2023 Value (range of prior values/means) |
Prior Years Measured (# of visits with measurements) |
|---|---|---|
| Width (cm) | 91.8 ± 66.9 (54.4–102.0) | 2018–2022 (5) |
| Depth (cm) | 13.8 ± 22.4 (1.8–31.0) | 2018–2022 (5) |
| Length (m) | 21.6 (15.1–47.0) | 2018–2022 (5) |
| Sampling Location | Measurement Location | Parameter | WY2023 Value (range of prior values) |
Prior Years Measured (# of measurements) |
|---|---|---|---|---|
| 001 | Center | Dissolved oxygen (mg/L) | 2.09 (2.01–6.92) |
2018–2022 (5) |
| 001 | Center | pH | 7.10 (7.32–7.56) |
2018–2022 (5) |
| 001 | Center | Specific conductivity (µS/cm) | 561 (528–602) |
2018–2022 (5) |
| 001 | Center | Temperature (°C) | 15.4 (14.0–17.4) |
2018–2022 (7) |
| 001 | Center | Total dissolved solids (mg/L) | 365 (344–390) |
2018–2022 (5) |
| Sampling Location | Measurement Location | Parameter | WY2023 Value (range of prior values) |
Prior Years Measured (# of measurements) |
|---|---|---|---|---|
| 001 | Center | Alkalinity (CaCO3) |
245 (80–265) |
2018–2022 (5) |
| 001 | Center | Calcium (Ca) |
60 (26–82) |
2018–2022 (5) |
| 001 | Center | Chloride (Cl) |
13 (4–48) |
2018–2022 (5) |
| 001 | Center | Magnesium (Mg) |
7 (b.d.l.–26) |
2018–2022 (5) |
| 001 | Center | Potassium (K) |
0.5 (0.0–0.8) |
2018–2022 (5) |
| 001 | Center | Sulphate (SO4) |
37 (36–62) |
2018–2022 (5) |
NPS
Lorn Spring
Lorn Spring (Figure 24) is a hanging garden spring (complex, multi-habitat spring that emerges along geologic contacts and seeps onto underlying walls) located inside a wash northwest of the Grapevine Hills. Lorn Spring slowly drips from a rock face covered in maidenhair fern (Adiantum sp.) at the base of a north-facing cliff. Water from the hanging garden collects into small pools of cool, clear water at the base of the cliff, the largest of which is typically no more than 2 m long by 2 m wide. The WY2023 visit occurred on 05 February 2023, and the spring was wetted (contained water).
Site Condition
No natural or human-caused disturbances were observed at Lorn Spring in WY2023.
As in past years, we did not observe invasive non-native crayfish or American bullfrog (Lithobates catesbeianus) at Lorn Spring in WY2023. We observed three invasive non-native plants: scattered patches of yellow bluestem (Bothriochloa ischaemum, scattered patches observed in 2020); scattered patches of Bermudagrass (Cynodon dactylon, scattered patches observed in 2017–2020); and 1–5 Lehmann lovegrass plants (Eragrostis lehmanniana, 1–5 plants to scattered patches observed in 2017–2022).
We observed three obligate or facultative wetland plants at Lorn Spring in WY2023: common buttonbush (Cephalanthus occidentalis, a shrub observed in 2020–2022); maidenhair fern (Adiantum sp., a fern observed in 2019–2022); and mule-fat (Baccharis salicifolia, a shrub observed in 2017–2022).
Water Quantity
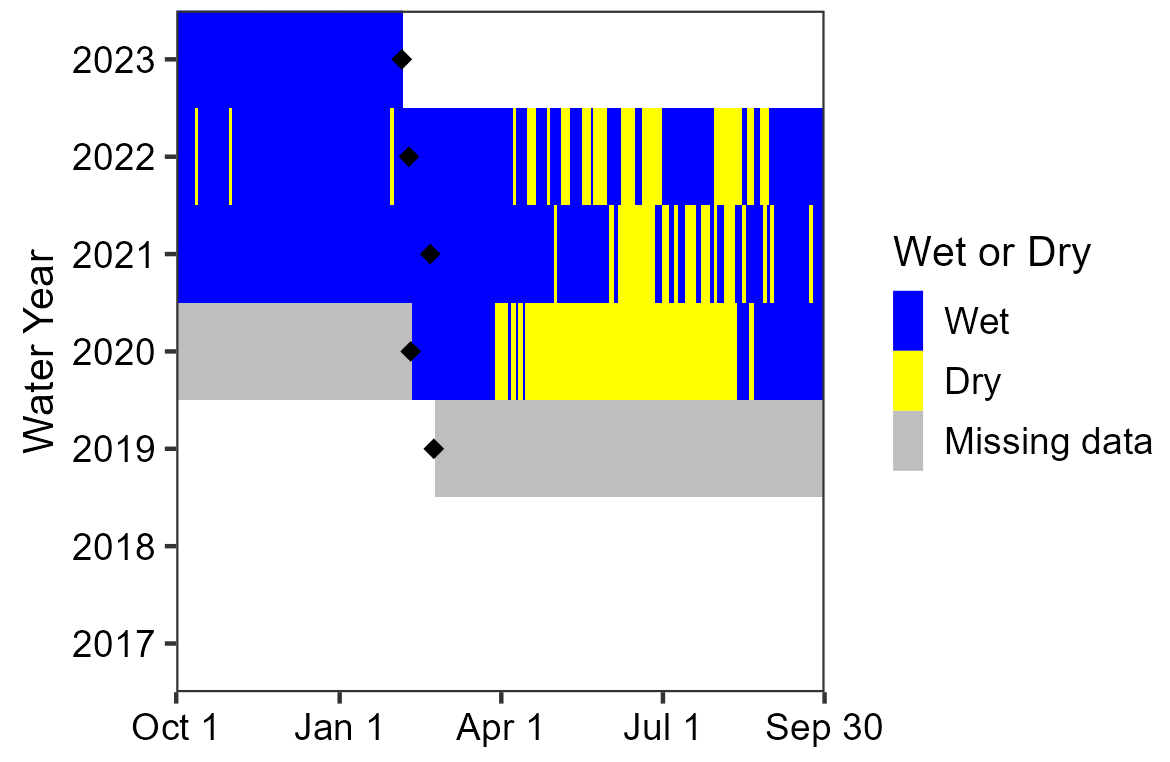
Sensors are deployed and data are downloaded during our annual visit, which takes place in the middle of the water year; the dates of these visits are indicated by black diamonds in the persistence graph (Figure 25). The temperature sensor indicated that Lorn Spring was wetted for 128 of 128 days (100%) measured up to the WY2023 visit. In prior water years, the spring was wetted 42.1–83.8% of the days measured across entire water years.
NPS
Discharge was estimated at 0.6 ± 0.0 L/min (0.2 ± 0.0 gal/min) in WY2023, consistent with the historical ranges of estimated discharge (Table 23).
Wetted extent was evaluated using a method for standing water. Width averaged 24.5 cm (9.6 in), length averaged 58.3 cm (23.0 in), and depth averaged 1.3 cm (0.5 in) in WY2023. These springbrook measurements were below the ranges of means from other years (Table 24).
Water Quality
Core water quality (Table 25) and water chemistry (Table 26) data were collected at the primary sampling location in the deepest part of the largest pool at the base of the hanging garden in WY2023. Water temperature was consistent with prior values. Dissolved oxygen, specific conductivity, total dissolved solids, and pH values were lower than previous measurements. The level of calcium was consistent with previous values, while values for alkalinity, chloride, and potassium were lower and values for magnesium and sulphate were higher than in prior years.
Lorn Spring Data Tables
| Sampling Location | WY2023 Mean (range of prior means) |
Prior Years Measured (# of visits with measurements) |
|---|---|---|
| 002 | 0.6 ± 0.0 (0.3–0.6) | 2019–2022 (4) |
| Measurement | WY2023 Mean (range of prior means) |
Prior Years Measured (# of visits with measurements) |
|---|---|---|
| Width (cm) | 24.5 ± 13.1 (44.7–188.7) | 2019–2022 (4) |
| Depth (cm) | 1.3 ±1.4 (5.7–9.2) | 2019–2022 (4) |
| Length (cm) | 58.3 ± 21.9 (106.7–210.7) | 2019–2022 (4) |
| Sampling Location | Measurement Location | Parameter | WY2023 Value (range of prior values) |
Prior Years Measured (# of measurements) |
|---|---|---|---|---|
| 002 | Center | Dissolved oxygen (mg/L) | 7.15 (7.75–11.08) |
2019–2022 (4) |
| 002 | Center | pH | 7.50 (7.82–8.36) |
2019–2022 (4) |
| 002 | Center | Specific conductivity (µS/cm) | 1,785 (1,791–1,808) |
2019–2022 (4) |
| 002 | Center | Temperature (°C) | 14.7 (6.5–16.2) |
2019–2022 (5) |
| 002 | Center | Total dissolved solids (mg/L) | 1,160 (1,164–1,176) |
2019–2022 (4) |
| Sampling Location | Measurement Location | Parameter | WY2023 Value (range of prior values) |
Prior Years Measured (# of measurements) |
|---|---|---|---|---|
| 002 | Center | Alkalinity (CaCO3) |
220 (240–295) |
2019–2022 (3) |
| 002 | Center | Calcium (Ca) |
105 (28–140) |
2019–2022 (3) |
| 002 | Center | Chloride (Cl) |
42 (54–92) |
2019–2022 (3) |
| 002 | Center | Magnesium (Mg) |
28 (5–25) |
2019–2022 (3) |
| 002 | Center | Potassium (K) |
1.5 (1.6–2.8) |
2019–2022 (3) |
| 002 | Center | Sulphate (SO4) |
560 (65–390) |
2019–2022 (3) |
NPS
Lower Croton Spring
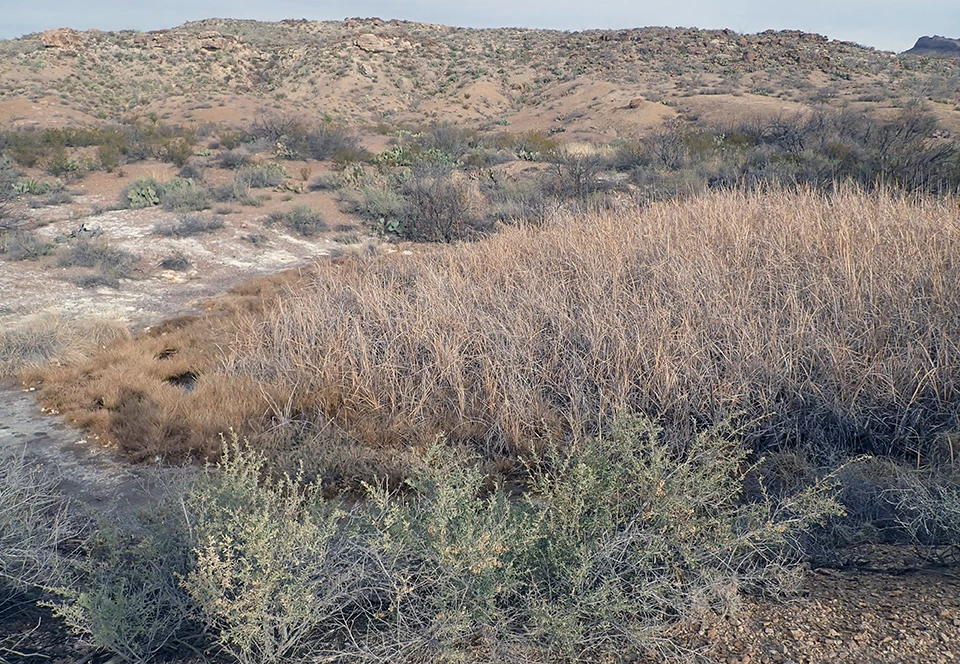
Lower Croton Spring (Figure 26) is a helocrene spring (a spring that emerges into marshy, wet meadow settings—low-gradient wetlands) located north of the Chisos Mountains and south of Croton Peak. The spring forms a pool that is typically about 20 m wide and 20 m long and populated by a dense stand of cattails (Typhaceae). Mineral deposits line the gravelly banks and shrubs partially surround the pool. The WY2023 visit occurred on 07 February 2023, and the spring was wetted (contained water).
Site Condition
In WY2023, we rated Lower Croton Spring slightly disturbed by hiking trails, with a trail leading to the spring (rated slightly to moderately disturbed in the past); slightly disturbed by drying because of patches of white, salty soil surrounding the spring and upland plants encroaching on the pool (rated undisturbed to highly disturbed in the past); and slightly disturbed by wildlife based on tracks around the spring (rated slightly to moderately disturbed in the past). No other natural or human-caused disturbances were observed at Lower Croton Spring in WY2023.
As in past years, we did not observe invasive non-native crayfish or American bullfrog (Lithobates catesbeianus) at Lower Croton Spring in WY2023. We observed one invasive non-native plant: evenly distributed patches of Bermudagrass (Cynodon dactylon, evenly distributed patches to a matrix observed in 2018–2022).
We observed three obligate or facultative wetland plants at Lower Croton Spring in WY2023: cattail (Typhaceae, a plant observed in 2018–2022); flatsedge (Cyperus sp., a sedge not previously observed); and mule-fat (Baccharis salicifolia, a shrub observed in 2018–2022).
Water Quantity
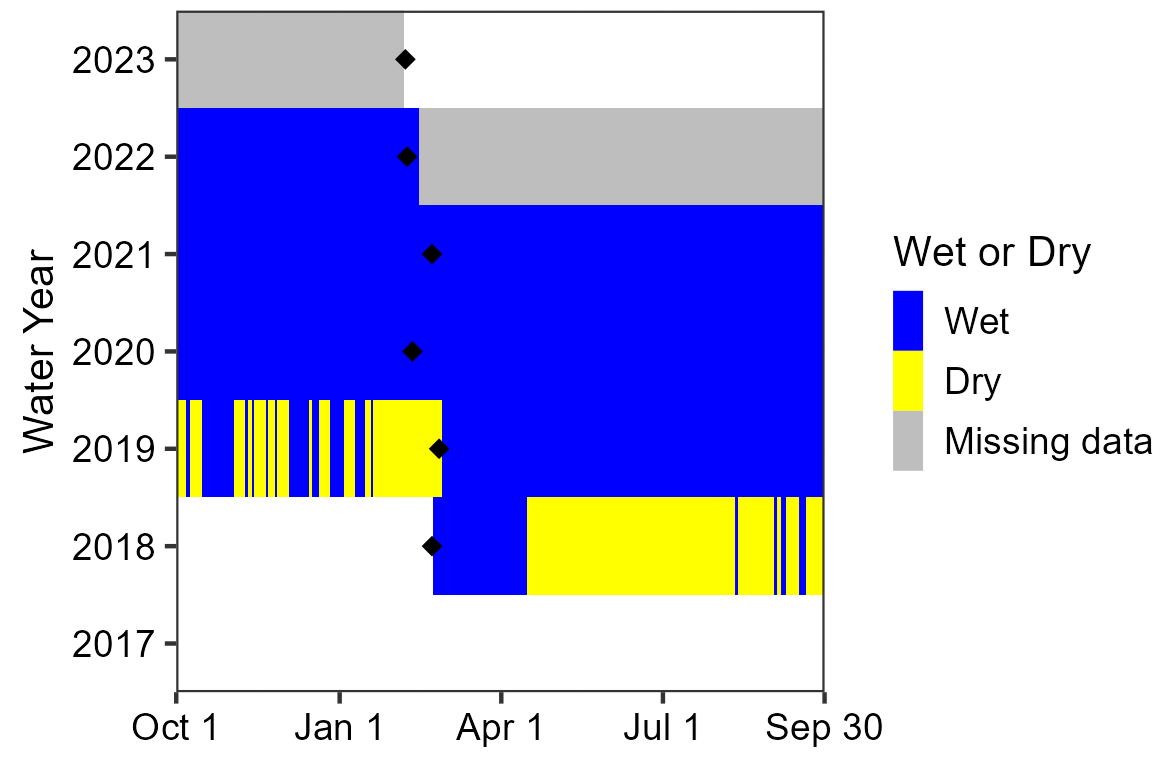
Sensors are deployed and data are downloaded during our annual visit, which takes place in the middle of the water year; the dates of these visits are indicated by black diamonds in the persistence graph (Figure 27). The temperature sensor malfunctioned after one week of deployment, so there is no estimate of persistence for WY2023. In prior water years, the spring was wetted 29.1–100% of the days measured across entire water years.
NPS
As in past years, there was no measurable discharge.
Wetted extent was evaluated using a method for standing water. Width averaged 17.2 m (56.4 ft), length averaged 16.1 m (52.8 ft), and depth averaged 5.7 cm (2.2 in) in WY2023. Length of the springbrook was lower than the range of previous means, while width and depth were comparable with prior means (Table 27).
Water Quality
Core water quality (Table 28) and water chemistry (Table 29) data were collected at the primary sampling location near the edge of the pool in WY2023. Dissolved oxygen, water temperature, and pH values were consistent with prior years, while specific conductivity and total dissolved solids were above their ranges of previous measurements. Values for alkalinity, calcium, and chloride were all consistent with previous years, while magnesium, potassium, and sulphate were higher than prior values.
Lower Croton Spring Data Tables
| Measurement | WY2023 Mean (range of prior means) |
Prior Years Measured (# of visits with measurements) |
|---|---|---|
| Width (m) | 17.2 ± 5.5 (13.5–20.1) | 2018–2022 (5) |
| Depth (cm) | 5.7 ± 3.6 (4.5–12.7) | 2018–2022 (5) |
| Length (m) | 16.1 ± 2.1 (16.9–18.4) | 2018–2022 (5) |
| Sampling Location | Measurement Location | Parameter | WY2023 Value (range of prior values) |
Prior Years Measured (# of measurements) |
|---|---|---|---|---|
| 001 | Center | Dissolved oxygen (mg/L) | 0.28 (0.06–0.82) |
2018–2022 (5) |
| 001 | Center | pH | 7.29 (7.12–7.43) |
2018–2022 (5) |
| 001 | Center | Specific conductivity (µS/cm) | 2,326 (1,719–1,861) |
2019–2022 (4) |
| 001 | Center | Temperature (°C) | 12.5 (12.1–17.5) |
2018–2022 (7) |
| 001 | Center | Total dissolved solids (mg/L) | 1,511 (1,118–1,209) |
2018–2022 (5) |
| Sampling Location | Measurement Location | Parameter | WY2023 Value (range of prior values) |
Prior Years Measured (# of measurements) |
|---|---|---|---|---|
| 001 | Center | Alkalinity (CaCO3) |
460 (180–500) |
2018–2022 (5) |
| 001 | Center | Calcium (Ca) |
36 (33–40) |
2018–2022 (5) |
| 001 | Center | Chloride (Cl) |
42 (b.d.l.–120) |
2018–2022 (5) |
| 001 | Center | Magnesium (Mg) |
47 (0–32) |
2018–2022 (5) |
| 001 | Center | Potassium (K) |
4.3 (0.0–3.0) |
2018–2022 (5) |
| 001 | Center | Sulphate (SO4) |
660 (b.d.l.–390) |
2018–2022 (5) |
NPS
Mule Ears Spring
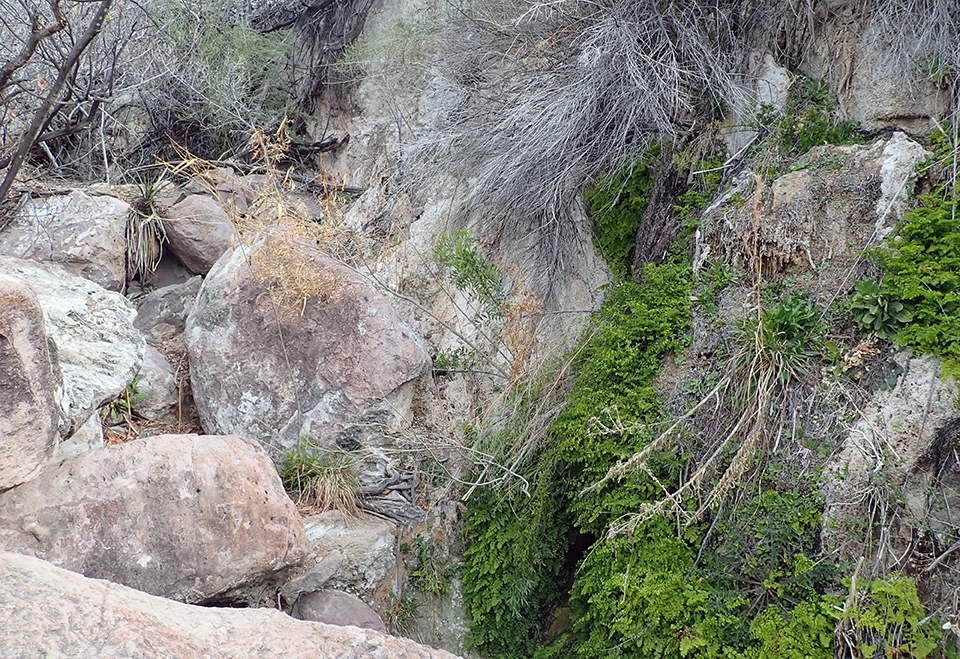
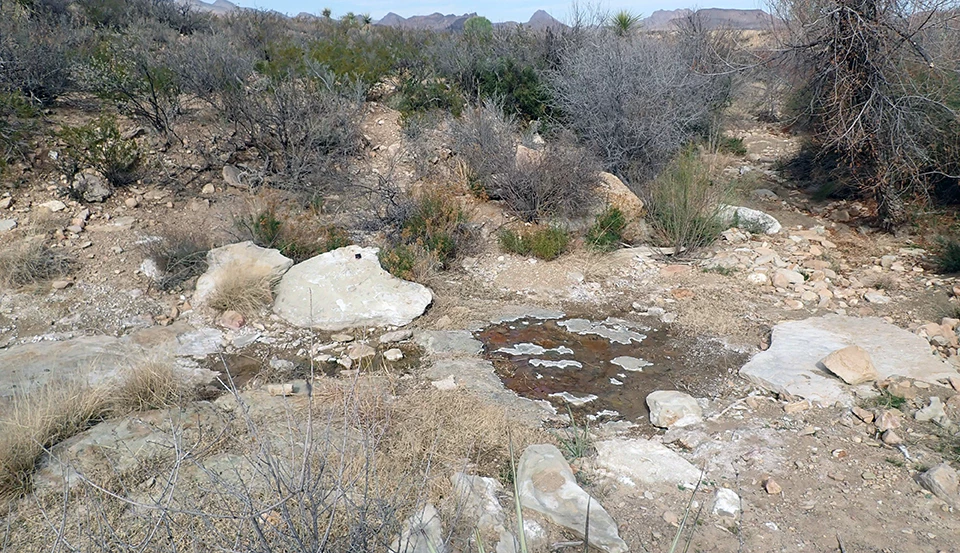
Mule Ears Spring (Figure 28) is a hanging garden spring (a complex, multi-habitat spring that emerges along geologic contacts and seeps onto underlying walls) located north of the Mule Ears Peaks. The primary orifice seeps from under ferns on a rock face and creates a small pool bounded by boulders. Spring flow continues out of the pool forming a narrow channel that has ranged from 12 to 36 m long in recent years. A second hanging garden about 8 m downstream of the first adds to the flow as the channel becomes more densely vegetated with shrubs. The WY2023 visit occurred on 18 February 2023, and the spring was wetted (contained water).
Site Condition
In WY2023, we rated Mule Ears Spring slightly disturbed by contemporary human use with trash at the site (rated undisturbed to moderately disturbed in the past); slightly disturbed by “other” anthropogenic factors because of sawed-off mule-fat stems (rated undisturbed in the past); slightly disturbed by recent flooding based on evidence of downed plants in the direction of water flow (rated undisturbed to slightly disturbed in the past); slightly disturbed by wildlife, with tracks in various pools in the spring system (rated undisturbed to slightly disturbed in the past); and moderately disturbed by hiking trails because the Mule Ears Trail leads directly to the spring (rated moderately to highly disturbed in the past). No other natural or human-caused disturbances were observed at Mule Ears Spring in WY2023.
As in past years, we did not observe invasive non-native crayfish or American bullfrog (Lithobates catesbeianus) at Mule Ears Spring in WY2023. We observed two invasive non-native plants: scattered patches of Bermudagrass (Cynodon dactylon, scattered patches to evenly distributed patches observed in 2017–2022) and scattered patches of sowthistle (Sonchus sp., 1–5 plants to scattered patches observed in 2018–2022).
We observed eight obligate or facultative wetland plants at Mule Ears Spring in WY2023: bluestem (Andropogon sp., a grass observed in 2017–2022); cattail (Typhaceae, a grass observed in 2017–2022); flatsedge (Cyperus sp., a sedge observed in 2020–2021); lobelia (Lobelia sp., a forb observed in 2021–2022); maidenhair fern (Adiantum sp., a fern observed in 2018–2022); mule-fat (Baccharis salicifolia, a shrub observed in 2017–2022); spikerush (Eleocharis sp., a sedge observed in 2019–2020); and willow (Salix sp., a tree observed in 2020–2022).
Water Quantity
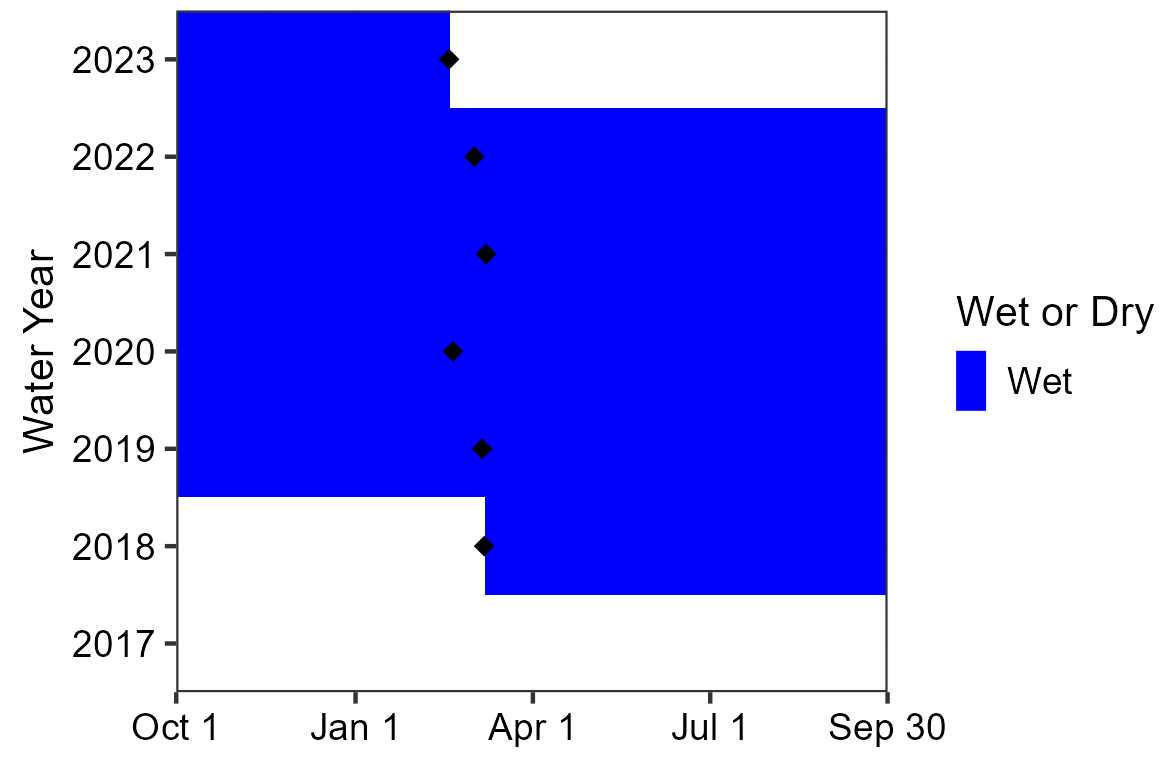
Sensors are deployed and data are downloaded during our annual visit, which takes place in the middle of the water year; the dates of these visits are indicated by black diamonds in the persistence graph (Figure 29). The temperature sensor indicated that Mule Ears Spring was wetted for 141 of 141 days (100%) measured up to the WY2023 visit. In prior water years, the spring was wetted 100% of the days measured across entire water years.
NPS
Discharge was estimated at 2.5 ± 0.1 L/min (0.7 ± 0.03 gal/min) in WY2023, which was below the range of values from previous years (Table 30).
Wetted extent was evaluated using a method for flowing water. The total springbrook length in WY2023 was 25.6 m (84.0 ft), consistent with past springbrook lengths, which ranged from 12.2 to 36.1 m (40.0 to 118.4 ft). Width and depth averaged 69.8 cm (27.5 in) and 6.0 cm (2.4 in), respectively, also consistent with prior years (Table 31).
Water Quality
Core water quality (Table 32) and water chemistry (Table 33) data were collected at the primary sampling location in a small pool fed by the main orifice in WY2023. The value for pH was consistent with previous measurements, while specific conductivity, water temperature, and total dissolved solids were below and dissolved oxygen was above previous values. Alkalinity, calcium, chloride, magnesium, potassium, and sulphate levels were all within the ranges of prior values.
Mule Ears Spring Data Tables
| Sampling Location | WY2023 Mean (range of prior means) |
Prior Years Measured (# of visits with measurements) |
|---|---|---|
| 003 | 2.5 ± 0.1 (3.2–13.7) | 2018–2021 (4) |
| Measurement | WY2023 Value (range of prior values/means) |
Prior Years Measured (# of visits with measurements) |
|---|---|---|
| Width (cm) | 69.8 ± 43.2 (52.9–138.7) | 2018–2022 (5) |
| Depth (cm) | 6.0 ± 9.6 (4.0–13.3) | 2018–2022 (5) |
| Length (m) | 25.6 (12.2–36.1) | 2018–2022 (5) |
| Sampling Location | Measurement Location | Parameter | WY2023 Value (range of prior values) |
Prior Years Measured (# of measurements) |
|---|---|---|---|---|
| 001 | Center | Dissolved oxygen (mg/L) | 9.73 (2.72–9.13) |
2018–2022 (5) |
| 001 | Center | pH | 7.73 (7.36–8.09) |
2018–2022 (5) |
| 001 | Center | Specific conductivity (µS/cm) | 561 (569–626) |
2018–2022 (5) |
| 001 | Center | Temperature (°C) | 17.9 (18.6–21.5) |
2018–2022 (7) |
| 001 | Center | Total dissolved solids (mg/L) | 365.0 (370.0–409.5) |
2018–2022 (5) |
| Sampling Location | Measurement Location | Parameter | WY2023 Value (range of prior values) |
Prior Years Measured (# of measurements) |
|---|---|---|---|---|
| 001 | Center | Alkalinity (CaCO3) |
260 (225–275) |
2018–2022 (5) |
| 001 | Center | Calcium (Ca) |
68 (52–74) |
2018–2022 (5) |
| 001 | Center | Chloride (Cl) |
15 (12–180*) |
2018–2022 (5) |
| 001 | Center | Magnesium (Mg) |
17 (5–70) |
2018–2022 (5) |
| 001 | Center | Potassium (K) |
0.6 (0.1–2.7) |
2018–2022 (5) |
| 001 | Center | Sulphate (SO4) |
21 (14–28) |
2018–2022 (5) |
NPS
Painted Hills Spring
Painted Hills Spring (Figure 30) is a rheocrene spring (a spring that emerges into one or more stream channels) located in a shallow wash on the northern edge of the Painted Hills. The seep emerges from two distinct bedrock seams in the channel, forming a springbrook that has been measured from 3.5 to 13.7 m in length in recent years. The brook consists of disconnected pools with no discernable flow. The WY2023 visit occurred on 17 February 2023, and the spring was wetted (contained water).
Site Condition
In WY2023, we rated Painted Hills Spring slightly disturbed by feral animals because of hoof prints and scat (rated undisturbed to slightly disturbed in the past); slightly disturbed by drying based on sparse, but healthy, riparian plants (rated slightly to moderately disturbed in the past); and slightly disturbed by wildlife, with deer scat and tracks present (rated undisturbed to slightly disturbed in the past). No other natural or human-caused disturbances were observed at Painted Hills Spring in WY2023.
As in past years, we did not observe invasive non-native crayfish or American bullfrog (Lithobates catesbeianus) at Painted Hills Spring in WY2023. We observed two invasive non-native plants: evenly distributed patches of Bermudagrass (Cynodon dactylon, scattered patches to evenly distributed patches observed in 2017–2022) and scattered patches of Lehmann lovegrass (Eragrostis lehmanniana, scattered patches to evenly distributed patches observed in 2017–2022).
We observed three obligate/facultative wetland plants at Painted Hills Spring in WY2023: cottonwood (Populus sp., a tree observed in 2017–2022); mule-fat (Baccharis salicifolia, a shrub observed in 2017–2022); and willow (Salix sp., a tree observed in 2017–2022).
Water Quantity
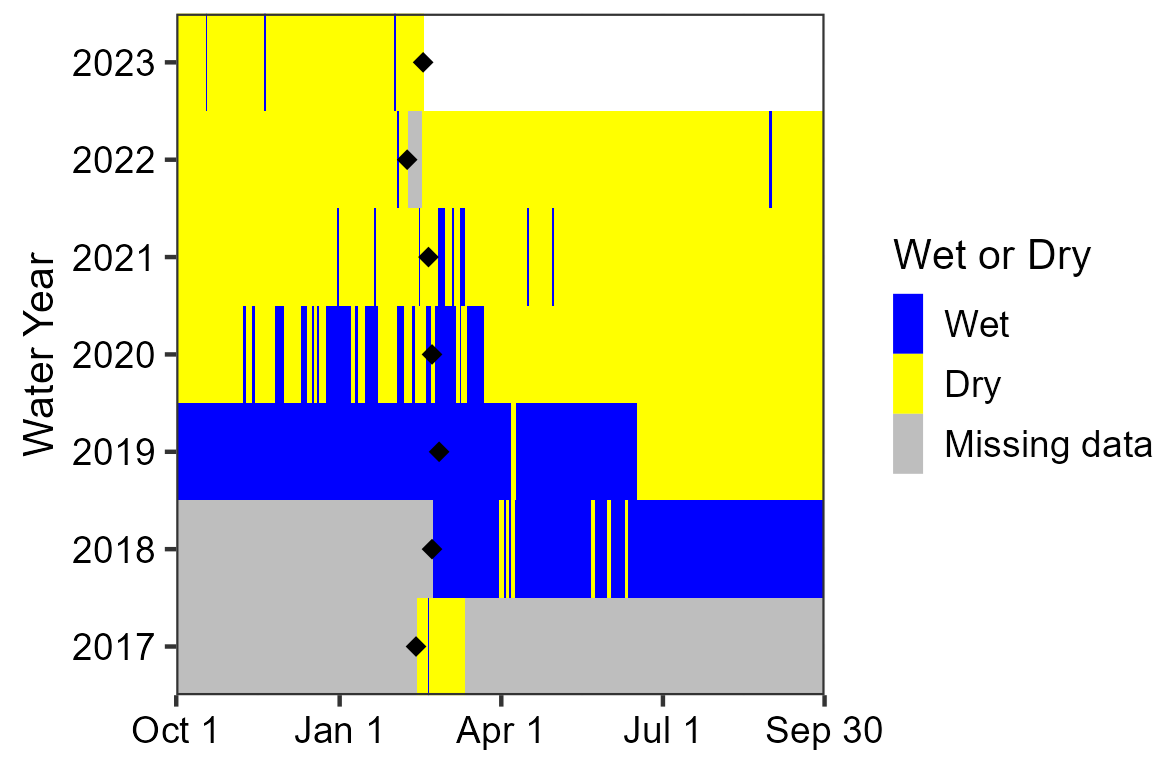
Sensors are deployed and data are downloaded during our annual visit, which takes place in the middle of the water year; the dates of these visits are indicated by black diamonds in the persistence graph (Figure 31). The temperature sensor indicated that Painted Hills Spring was wetted for 3 of 140 days (2.1%) measured up to the WY2023 visit. However, at the WY2023 visit, the spring was wetted and the temperature sensor was found resting on the ground outside the water, which may have affected the WY2023 persistence results. In prior water years, the spring was wetted 0.8–94.1% of the days measured across entire water years.
NPS
As in past years, there was no measurable discharge because there was no surface flow.
Wetted extent was evaluated using a method for flowing water. The total brook length was 12.6 m (41.3 ft). In the past, springbrook lengths ranged from 3.5 to 13.7 m (11.5 to 44.9 ft). Width and depth along the springbrook averaged 31.8 cm (12.5 in) and 0.4 cm (0.2 in), respectively. The mean width, length, and depth recorded in WY2023 were consistent with the ranges of means in previous years (Table 34).
Water Quality
Core water quality (Table 35) and water chemistry (Table 36) data were collected at the primary sampling location at the primary orifice in WY2023. The value for pH was consistent with prior years; water temperature was below the previous observations; and dissolved oxygen, specific conductivity, and total dissolved solids values were above ranges of past values. Alkalinity, calcium, chloride, magnesium, and potassium were within historical ranges, and sulphate was higher than in previous years. Algae and detritus were collected with the sample water and may have affected our results.
Painted Hills Spring Data Tables
| Measurement | WY2023 Value (range of prior values/means) |
Prior Years Measured (# of visits with measurements) |
|---|---|---|
| Width (cm) | 31.8 ± 50.2 (14.3–79.4) | 2017–2022 (6) |
| Depth (cm) | 0.4 ± 0.7 (0.2–1.1) | 2017–2022 (6) |
| Length (m) | 12.6 (3.5–13.7) | 2017–2022 (6) |
| Sampling Location | Measurement Location | Parameter | WY2023 Value (range of prior values) |
Prior Years Measured (# of measurements) |
|---|---|---|---|---|
| 001 | Center | Dissolved oxygen (mg/L) | 8.22 (3.95–6.26) |
2017–2021 (5) |
| 001 | Center | pH | 7.62 (7.39–7.84) |
2017–2021 (4) |
| 001 | Center | Specific conductivity (µS/cm) | 1,483 (1,226–1,451) |
2017–2021 (4) |
| 001 | Center | Temperature (°C) | 9.3 (9.5–18.2) |
2017–2021 (7) |
| 001 | Center | Total dissolved solids (mg/L) | 964.0 (767.0–942.5) |
2017–2021 (5) |
| Sampling Location | Measurement Location | Parameter | WY2023 Value (range of prior values) |
Prior Years Measured (# of measurements) |
|---|---|---|---|---|
| 001 | Center | Alkalinity (CaCO3) |
430 (358–510) |
2017–2021 (5) |
| 001 | Center | Calcium (Ca) |
44 (32–72) |
2017–2021 (5) |
| 001 | Center | Chloride (Cl) |
12 (b.d.l.–81) |
2017–2021 (5) |
| 001 | Center | Magnesium (Mg) |
26 (b.d.l.–46) |
2017–2021 (5) |
| 001 | Center | Potassium (K) |
1.5 (1.0–2.4) |
2017–2021 (5) |
| 001 | Center | Sulphate (SO4) |
280 (175–195) |
2017–2021 (5) |
NPS
Peña Spring 1
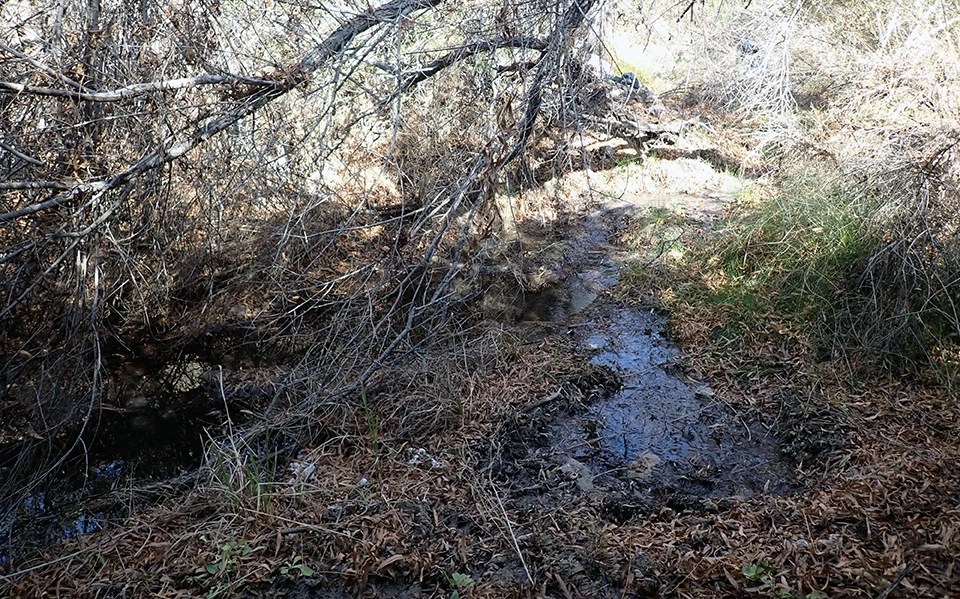
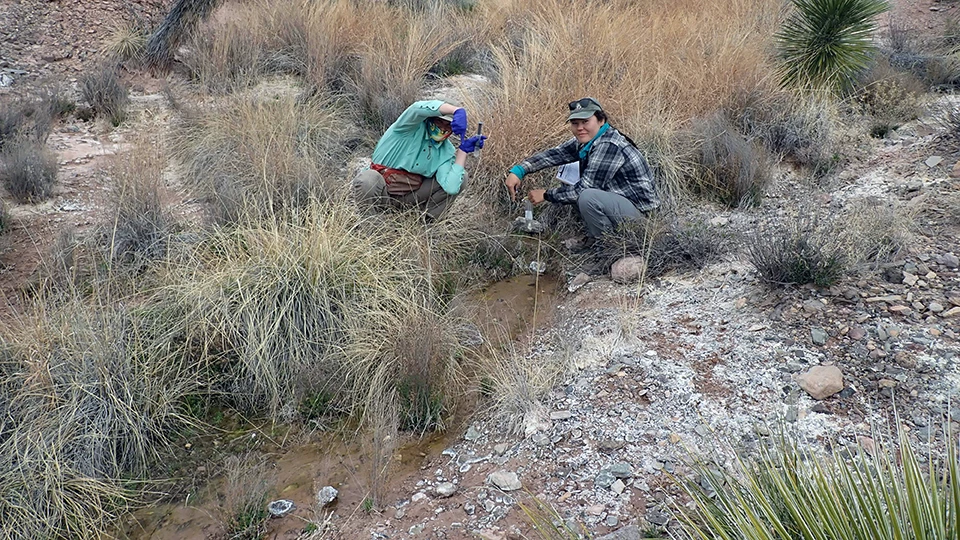
Peña Spring 1 (Figure 32) is a rheocrene spring (a spring that emerges into one or more stream channels). The spring emerges inside a drainage near the Chimneys Trail, east of Old Maverick Road. Multiple orifices and a hanging garden inside the wash contribute to a springbrook that has consistently been observed at more than 100 m in length, although typically only the upper reaches are accessible for monitoring. Steep banks and trees overhang the channel. Aquatic life is abundant, including anurans, macroinvertebrates, and a host of wetland plants. The WY2023 visit occurred on 20 February 2023, and the spring was wetted (contained water).
Site Condition
In WY2023, we rated Peña Spring 1 slightly disturbed by contemporary human use because there is a trail within 50 m of the spring, but we did not find trash or other related impacts (rated undisturbed in the past); slightly disturbed by recent flooding based on erosion and exposed roots on channel sides, though the riparian community was vigorous (rated undisturbed to slightly disturbed in the past); and moderately disturbed by hiking trails, with the Chimneys Trail nearby (rated undisturbed to slightly disturbed in the past). No other natural or human-caused disturbances were observed at Peña Spring 1 in WY2023.
As in past years, we did not observe invasive non-native crayfish or American bullfrog (Lithobates catesbeianus) at Peña Spring 1 in WY2023. We observed two invasive non-native plants: 1–5 sowthistle plants (Sonchus sp., not previously observed); and 1–5 tamarisk trees (Tamarix sp., not previously observed).
We observed nine obligate/facultative wetland plants at Peña Spring 1 in WY2023: bluestem (Andropogon sp., a grass observed in 2018–2022); cattail (Typhaceae, a plant not previously observed); cottonwood (Populus sp., a tree not previously observed); maidenhair fern (Adiantum sp., a fern observed in 2018–2022); mule-fat (Baccharis salicifolia, a shrub observed in 2018–2022); spikerush (Eleocharis sp., a sedge observed in 2018–2022); tamarisk (Tamarix sp., a tree not previously observed); umbrella-sedge (Fuirena sp., a sedge not previously observed); and willow (Salix sp., a tree observed in 2018–2022).
Water Quantity
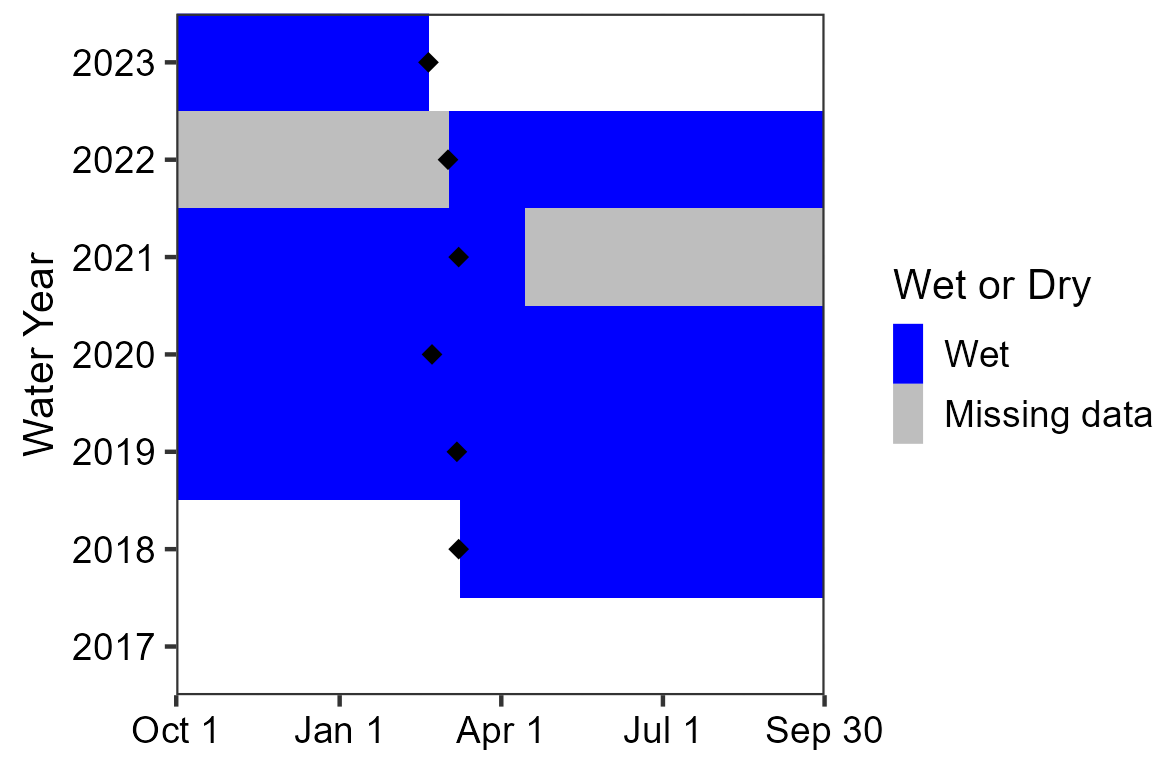
Sensors are deployed and data are downloaded during our annual visit, which takes place in the middle of the water year; the dates of these visits are indicated by black diamonds in the persistence graph (Figure 33). The temperature sensor indicated that Peña Spring 1 was wetted for 143 of 143 days (100%) measured up to the WY2023 visit. In prior water years, the spring was wetted 100% of the days measured across entire water years.
NPS
Discharge was not measured in WY2023 at the primary sampling location because there was no flow. Past data are summarized in Table 37.
Wetted extent was evaluated using a method for flowing water. Similar to prior years, total springbrook length in WY2023 was estimated at 100–200 m (328–656 ft), however wetted extent was only measured for the first 59.5 m (195.2 ft) of the springbrook because of safety and resource damage concerns. In the past, springbrook lengths ranged from 14.4 m (47.2 ft) to estimated lengths between 100–200 m (328–656 ft). Width and depth along the first 59.5 m of the springbrook averaged 180.3 cm (71.0 in) and 10.0 cm (3.9 in), respectively. In WY2023, the springbrook was wider and deeper than in previous years (Table 38).
Water Quality
Core water quality (Table 39) and water chemistry (Table 40) data were collected at the primary sampling location in a small pool near the primary orifice in WY2023. A syringe and calibration cup were used to collect and measure the sample for core water quality and a syringe was used to collect the sample for water chemistry, which may affect our results. Water temperature and pH were comparable with prior years. Specific conductivity and total dissolved solids values were lower and dissolved oxygen was higher than previous measurements. Values for alkalinity, calcium, magnesium, and potassium were comparable with prior years. Chloride and sulphate were lower than previous measurements.
Peña Spring 1 Data Tables
| Sampling Location | WY2023 Mean (range of prior means) |
Prior Years Measured (# of visits with measurements) |
|---|---|---|
| 009 | c.n.s. (38.7) | 2021 (1) |
| Measurement | WY2023 Value (range of prior values/means) |
Prior Years Measured (# of visits with measurements) |
|---|---|---|
| Width (cm) | 180.3 ± 93.0 (112.8–177.2) | 2018–2022 (5) |
| Depth (cm) | 10.0 ± 6.7 (4.4–9.7) | 2018–2022 (5) |
| Length (m) | 59.5 (14.4–100.0) | 2018–2022 (5) |
| Sampling Location | Measurement Location | Parameter | WY2023 Value (range of prior values) |
Prior Years Measured (# of measurements) |
|---|---|---|---|---|
| 001 | Center | Dissolved oxygen (mg/L) | 3.46 (0.48–1.73) |
2018–2022 (5) |
| 001 | Center | pH | 7.27 (7.12–7.46) |
2018–2022 (5) |
| 001 | Center | Specific conductivity (µS/cm) | 816 (839–1,014) |
2018–2022 (5) |
| 001 | Center | Temperature (°C) | 20.1 (18.6–22.3) |
2018–2022 (7) |
| 001 | Center | Total dissolved solids (mg/L) | 530 (545–659) |
2018–2022 (5) |
| Sampling Location | Measurement Location | Parameter | WY2023 Value (range of prior values) |
Prior Years Measured (# of measurements) |
|---|---|---|---|---|
| 001 | Center | Alkalinity (CaCO3) |
310 (260–340) |
2018–2022 (5) |
| 001 | Center | Calcium (Ca) |
70 (58–100) |
2018–2022 (5) |
| 001 | Center | Chloride (Cl) |
b.d.l. (2–32) |
2018–2022 (5) |
| 001 | Center | Magnesium (Mg) |
9 (b.d.l.–15)* |
2018–2021 (4) |
| 001 | Center | Potassium (K) |
0.2 (0.2–1.5) |
2018–2022 (5) |
| 001 | Center | Sulphate (SO4) |
104 (128–195) |
2018–2022 (5) |
NPS
Red Ass Spring
Red Ass Spring (Figure 34) is a rheocrene spring (a spring that emerges into one or more stream channels) located in a drainage near the Chimneys formation. Several distinct orifices emerge within a 200 m radius, creating a vibrant complex of hanging gardens, pouroffs, and channels in the vicinity that support large cottonwood (Populus sp.) trees. We focus our monitoring on one orifice and channel within the complex, a shallow, silty-bottom stream that has ranged from 7.5 to 12.8 m in length during recent visits. The WY2023 visit occurred on 19 February 2023, and the spring was wetted (contained water).
Site Condition
In WY2023, we rated Red Ass Spring slightly disturbed by drying with upland plant species present in the riparian areas and heavy mineral crust lining the wetted area (rated undisturbed to moderately disturbed in the past) and slightly disturbed by wildlife based on tracks and scat (rated undisturbed to moderately disturbed in the past). No other natural or human-caused disturbances were observed at Red Ass Spring in WY2023.
As in past years, we did not observe invasive non-native crayfish or American bullfrog (Lithobates catesbeianus) at Red Ass Spring in WY2023. We observed two invasive non-native plants: scattered patches of Bermudagrass (Cynodon dactylon, 1–5 plants observed in 2019) and scattered patches of sowthistle (Sonchus sp., scattered patches observed in 2020–2021).
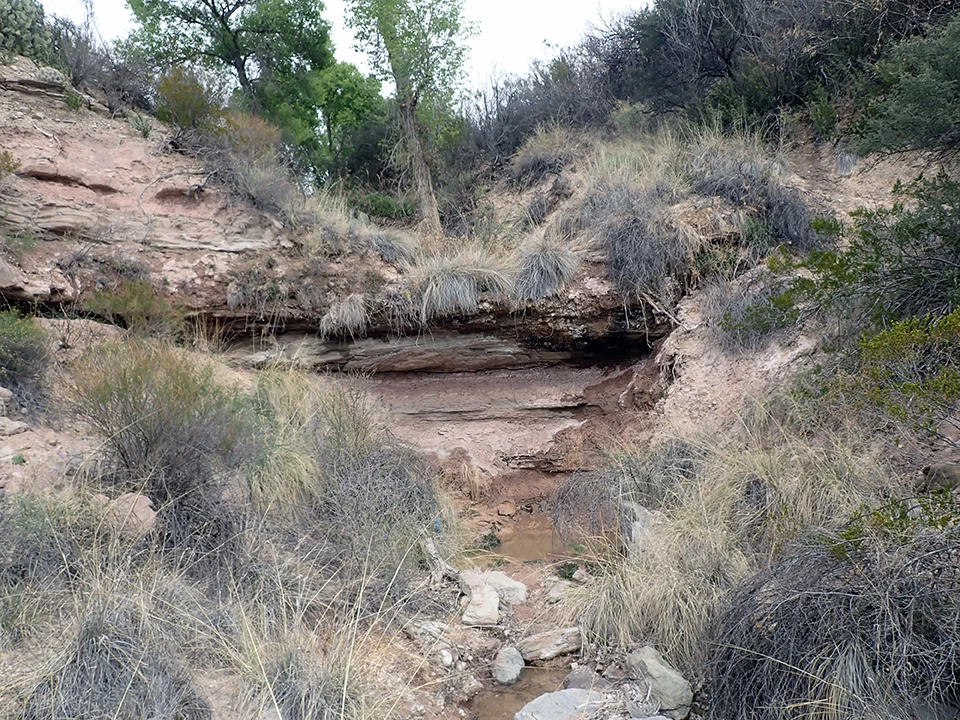
We observed eight obligate or facultative wetland plants at Red Ass Spring in WY2023: bluestem (Andropogon sp., a grass observed in 2017–2020); a member of the cattail family (Typhaceae, observed in 2018); centaury (Centarium sp., a forb observed in 2022); cottonwood (Populus sp., a tree observed in 2017–2022; Figure 35); flatsedge (Cyperus sp., a sedge observed in 2019); mule-fat (Baccharis salicifolia, a shrub observed in 2017–2018); rushes (Juncaceae, observed in 2019–2022); and spikerush (Eleocharis sp., a sedge observed in 2019).
NPS
Water Quantity
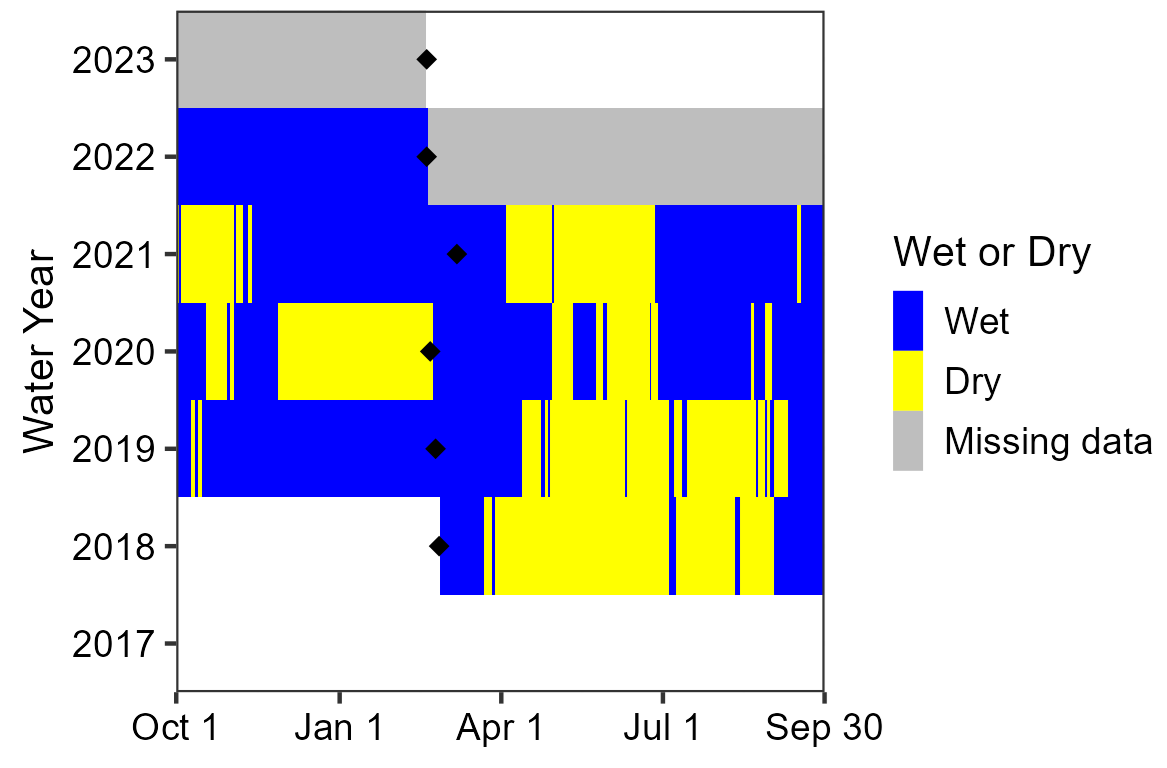
Sensors are deployed and data are downloaded during our annual visit, which takes place in the middle of the water year; the dates of these visits are indicated by black diamonds in the persistence graph (Figure 36). The most recent temperature sensor data were unavailable at time of publication, so there is no estimate of persistence for WY2023. In prior water years, the spring was wetted 28.7–100% of the days measured across entire water years.
NPS
Discharge was estimated at 0.5 ± 0.03 L/min (0.1 ± 0.009 gal/min) in WY2023. This value is consistent with the historical range of values (Table 41).
Wetted extent was evaluated using a method for flowing water. The total springbrook length was 8.1 m (26.6 ft) in WY2023. In the past, springbrook lengths ranged from 7.5 m (24.6 ft) to an estimated 200–500 m (656–1,640 ft). Width and depth along the springbrook averaged 58.4 cm (23.0 in) and 0.8 cm (0.3 in), respectively. Mean length of the springbrook in WY2023 was similar to previous measurements, but it was slightly wider and shallower on average (Table 42).
Water Quality
Core water quality (Table 43) and water chemistry (Table 44) data were collected at the primary sampling location in a small pool at the orifice in WY2023. A syringe and calibration cup were used to collect and measure the sample for core water quality and a syringe was used to collect the sample for water chemistry, which may affect our results. Dissolved oxygen, specific conductivity, water temperature, and total dissolved solids values were consistent with previous years, while pH was lower. Values for calcium, chloride, and sulphate were within ranges of values from prior years. Alkalinity, magnesium, and potassium levels were above previous measurements.
Red Ass Spring Data Tables
| Sampling Location | WY2023 Mean (range of prior means) |
Prior Years Measured (# of visits with measurements) |
|---|---|---|
| 002 | 0.5 ± 0.03 (0.3–1.1) | 2018–2022 (5) |
| Measurement | WY2023 Value (range of prior values/means) |
Prior Years Measured (# of visits with measurements) |
|---|---|---|
| Width (cm) | 58.4 ± 36.7 (42.9–55.6) | 2018–2022 (5) |
| Depth (cm) | 0.8 ± 0.7 (0.9–2.2) | 2018–2022 (5) |
| Length (m) | 8.1 (7.5–12.8) | 2018–2022 (5) |
| Sampling Location | Measurement Location | Parameter | WY2023 Value (range of prior values) |
Prior Years Measured (# of measurements) |
|---|---|---|---|---|
| 001 | Center | Dissolved oxygen (mg/L) | 2.56 (1.76–4.48) |
2018–2022 (5) |
| 001 | Center | pH | 7.15 (7.22–7.55) |
2018–2022 (5) |
| 001 | Center | Specific conductivity (µS/cm) | 839 (806–857) |
2019–2022 (4) |
| 001 | Center | Temperature (°C) | 14.7 (13.1–17.6) |
2018–2022 (7) |
| 001 | Center | Total dissolved solids (mg/L) | 546.0 (526.5–572.0) |
2018–2022 (5) |
| Sampling Location | Measurement Location | Parameter | WY2023 Value (range of prior values) |
Prior Years Measured (# of measurements) |
|---|---|---|---|---|
| 001 | Center | Alkalinity (CaCO3) |
330 (270–310) |
2018–2022 (5) |
| 001 | Center | Calcium (Ca) |
56 (54–66) |
2018–2022 (5) |
| 001 | Center | Chloride (Cl) |
31 (11–59) |
2018–2022 (5) |
| 001 | Center | Magnesium (Mg) |
13 (b.d.l.–11) |
2018–2022 (5) |
| 001 | Center | Potassium (K) |
1.3 (0.0–1.2) |
2018–2022 (5) |
| 001 | Center | Sulphate (SO4) |
87 (67–94) |
2018–2022 (5) |
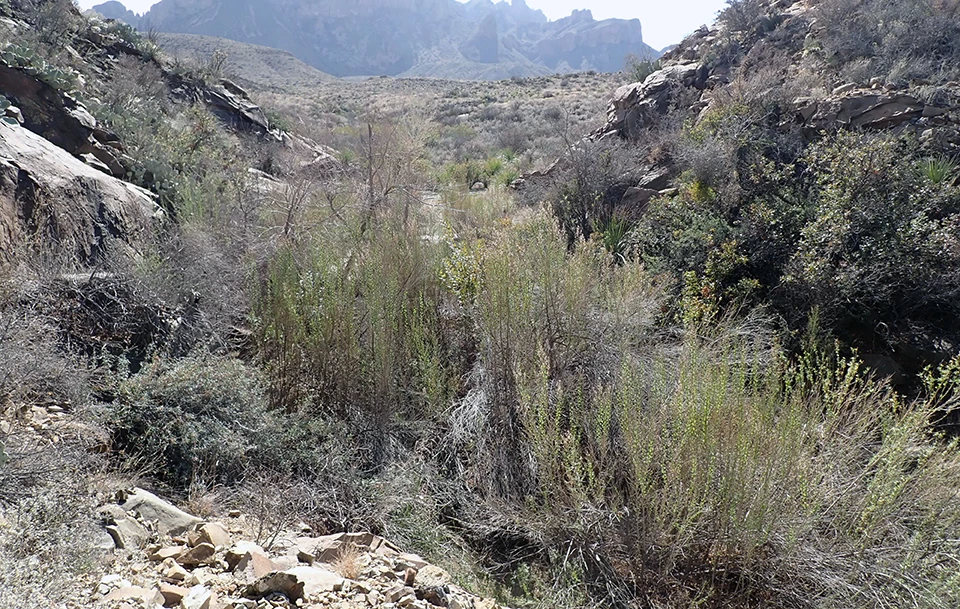
NPS
Rough Spring B
Rough Spring B (Figure 37) is a rheocrene spring (a spring that emerges into one or more stream channels) located inside a drainage on the north slopes of the Chisos Mountains. Rough Spring B emerges from under thick shrubs inside a bedrock-lined drainage. The spring forms a narrow, intermittent channel that has ranged from 12 to over 100 m in length at annual visits. The WY2023 visit occurred on 07 February 2023, and the spring was wetted (contained water).
Site Condition
In WY2023, we rated Rough Spring B slightly disturbed by recent flooding (rated undisturbed to highly disturbed in the past); slightly disturbed by drying, with upland plants established in the drainage (rated undisturbed to moderately disturbed in the past); slightly disturbed by wildlife based on tracks near the site (rated undisturbed to slightly disturbed in the past); and slightly disturbed by windthrow because of a downed tree on site (rated undisturbed in the past). No other natural or human-caused disturbances were observed at Rough Spring B in WY2023.
As in past years, we did not observe invasive non-native crayfish or American bullfrog (Lithobates catesbeianus) at Rough Spring B in WY2023. We observed one invasive non-native plant: scattered patches of Lehmann lovegrass (Eragrostis lehmanniana, 1–5 plants to scattered patches observed in 2017–2022).
We observed five obligate or facultative wetland plants at Rough Spring B in WY2023: centaury (Centarium sp., a forb observed in 2022); cottonwood (Populus sp., a tree observed in 2017–2022); flatsedge (Cyperus sp., a sedge observed in 2017–2020); mule-fat (Baccharis salicifolia, a shrub observed in 2017–2022); and a rush (Juncaceae, observed in 2018–2022).
Water Quantity
Sensors are deployed and data are downloaded during our annual visit, which takes place in the middle of the water year; the dates of these visits are indicated by black diamonds in the persistence graph (Figure 38). The temperature sensor indicated that Rough Spring B was wetted for 130 of 130 days (100%) measured up to the WY2023 visit. In prior water years, the spring was wetted 92.3–100% of the days measured across entire water years.
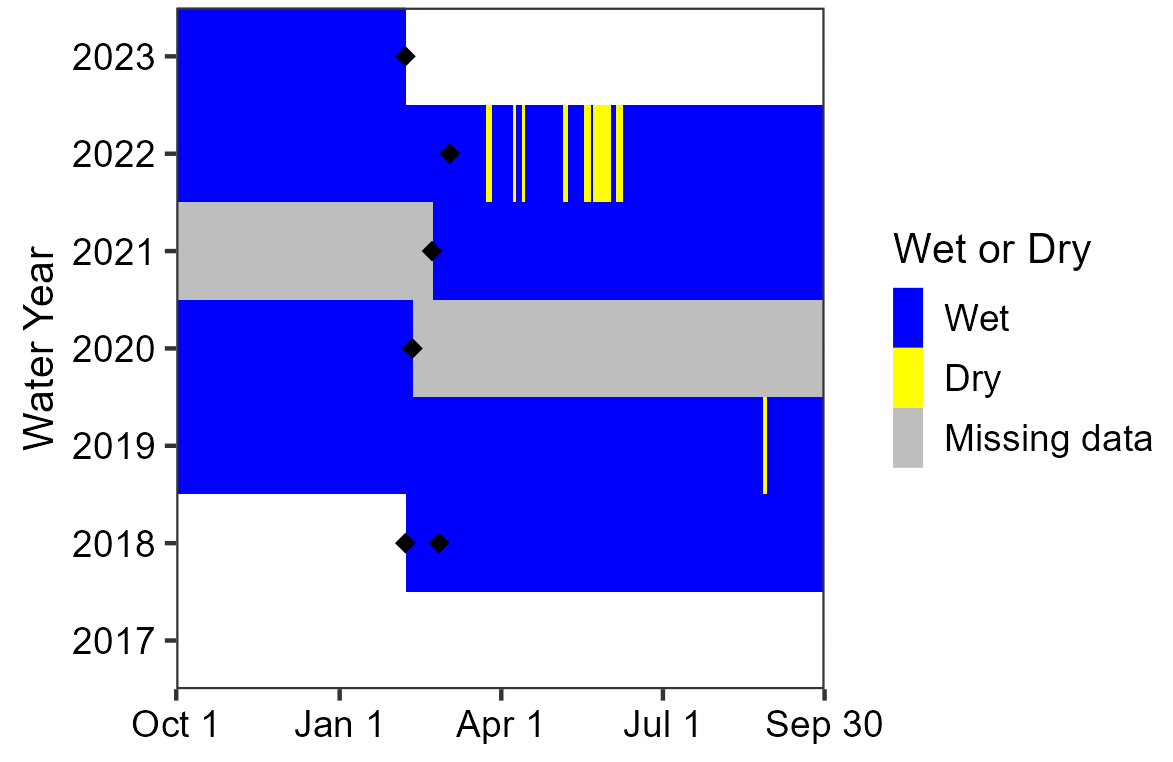
NPS
Discharge was not measured in WY2023 at the primary sampling location because there was no measurable flow. Past data are summarized in Table 45.
Wetted extent was not measured in WY2023. Dense poison ivy surrounding the channel has made the spring banks increasingly difficult to access. Past data are summarized in Table 46.
Water Quality
Core water quality (Table 47) and water chemistry (Table 48) data were collected at the primary sampling location, near the orifice in WY2023. Dissolved oxygen, specific conductivity, water temperature, total dissolved solids, and pH values were all within the ranges of prior values. The values for alkalinity, chloride, and sulphate were within historic ranges of values. Calcium and potassium were below and magnesium was above values in previous years.
Rough Spring B Data Tables
| Sampling Location | WY2023 Mean (range of prior means) |
Prior Years Measured (# of visits with measurements) |
|---|---|---|
| 005 | c.n.s. (6.4) | 2019 (1) |
| Measurement | WY2023 Value (range of prior values/means) |
Prior Years Measured (# of visits with measurements) |
|---|---|---|
| Width (cm) | c.n.s. (63.7–96.1) | 2018–2022 (5) |
| Depth (cm) | c.n.s. (1.1–3.4) | 2018–2022 (5) |
| Length (m) | c.n.s. (12.1–100.0) | 2018–2022 (5) |
| Sampling Location | Measurement Location | Parameter | WY2023 Value (range of prior values) |
Prior Years Measured (# of measurements) |
|---|---|---|---|---|
| 001 | Center | Dissolved oxygen (mg/L) | 3.06 (1.81–4.84) |
2018–2022 (5) |
| 001 | Center | pH | 7.29 (7.05–7.54) |
2018–2022 (5) |
| 001 | Center | Specific conductivity (µS/cm) | 747 (658–761) |
2018–2022 (5) |
| 001 | Center | Temperature (°C) | 14.2 (12.6–20.0) |
2018–2022 (7) |
| 001 | Center | Total dissolved solids (mg/L) | 485 (429–494) |
2018–2022 (5) |
| Sampling Location | Measurement Location | Parameter | WY2023 Value (range of prior values) |
Prior Years Measured (# of measurements) |
|---|---|---|---|---|
| 001 | Center | Alkalinity (CaCO3) |
260 (250–310) |
2018–2022 (5) |
| 001 | Center | Calcium (Ca) |
56 (60–85) |
2018–2022 (5) |
| 001 | Center | Chloride (Cl) |
11 (0–93) |
2018–2022 (5) |
| 001 | Center | Magnesium (Mg) |
25 (9–22) |
2018–2022 (5) |
| 001 | Center | Potassium (K) |
0.2 (0.5–1.3) |
2018–2022 (5) |
| 001 | Center | Sulphate (SO4) |
86 (67–87) |
2018–2022 (5) |
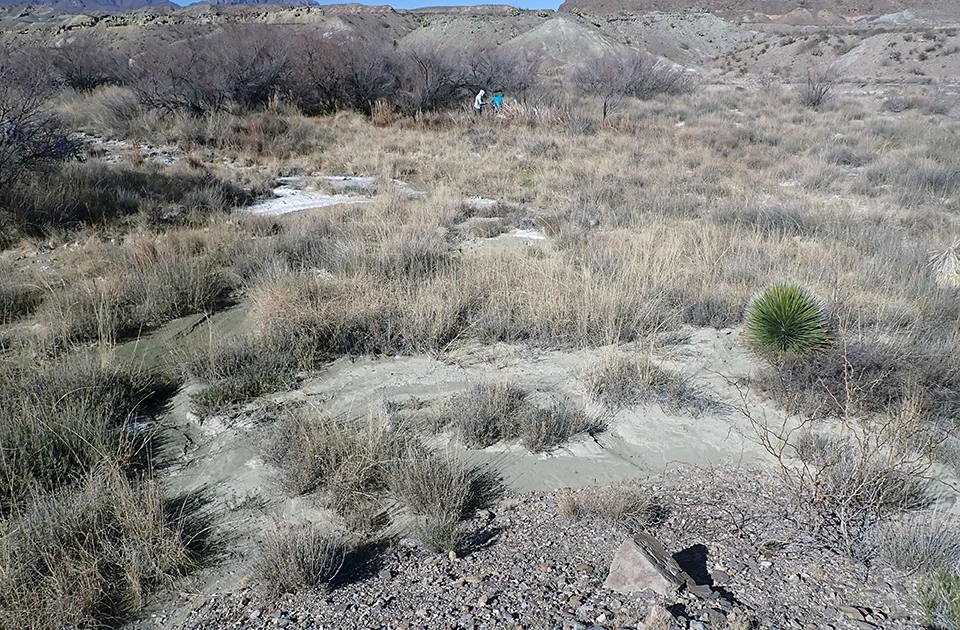
NPS
Screwbean Spring
Screwbean Spring (Figure 39) is a rheocrene spring (a spring that emerges into one or more stream channels). The spring emerges from multiple orifices under a stand of screwbean mesquite (Prosopis pubescens) trees in a wide drainage. Narrow, braided channels meander and dissipate into an open alkali sacaton (Sporobolus airoides) grassland. Multiple intermittently wetted seeps are also present in the area. The surrounding uplands are a sparse creosote shrubland, with large bentonite hills in most directions. The WY2023 visit occurred on 03 February 2023, and the spring was wetted (contained water).
Site Condition
In WY2023, we rated Screwbean Spring slightly disturbed by livestock based on cattle tracks (rated undisturbed to slightly disturbed in the past); slightly disturbed by drying, with upland species present in the wetland area and wetland species appearing less robust than in previous years (rated slightly to moderately disturbed in the past); and slightly disturbed by wildlife because of tracks in the wetland area and the presence of a coyote carcass (rated undisturbed to moderately disturbed in the past). No other natural or human-caused disturbances were observed at Screwbean Spring in WY2023.
As in past years, we did not observe invasive non-native crayfish or American bullfrog (Lithobates catesbeianus) at Screwbean Spring in WY2023. We observed one invasive non-native plant: scattered patches of tamarisk (Tamarix sp., 1–5 trees observed in 2018–2022).
We observed four obligate or facultative wetland plants at Screwbean Spring in WY2023: bluestem (Andropogon sp., a grass observed in 2017–2022); centaury (Centarium sp., a forb observed in 2020); spikerush (Eleocharis sp., a sedge observed in 2018–2022); and tamarisk (Tamarix sp., a tree observed in 2017–2022).
Water Quantity
Sensors are deployed and data are downloaded during our annual visit, which takes place in the middle of the water year; the dates of these visits are indicated by black diamonds in the persistence graph (Figure 40). The temperature sensor indicated that Screwbean Spring was wetted for 126 of 126 days (100%) measured up to the WY2023 visit. In prior water years, the spring was wetted 89.2–100% of the days measured across entire water years.
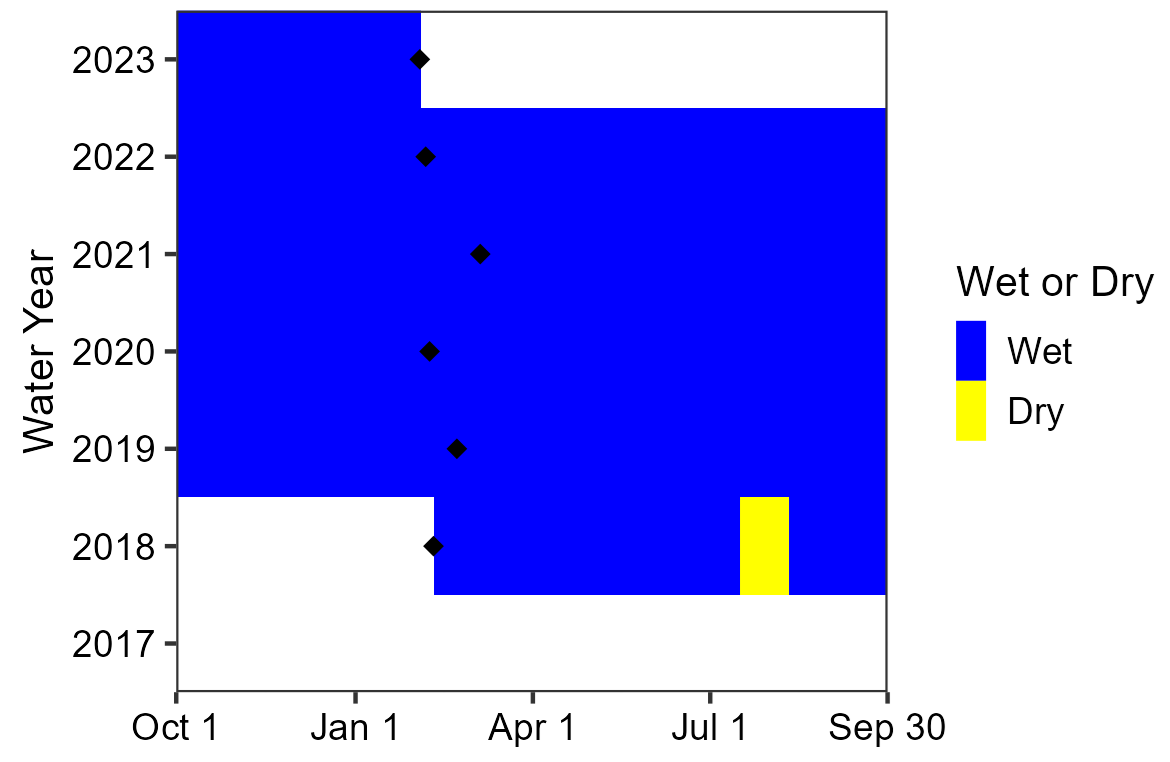
NPS
Discharge was not measured in WY2023 at the primary sampling location because there was no flow. Past data are summarized in Table 49.
Wetted extent has been evaluated using a method for flowing water since 2020. Prior to that (WY2018–WY2019), standing water measurements were used, and these data are shown in Table 50. In WY2023, the total springbrook length was 12.4 m (40.7 ft). In the past, lengths ranged from 12.0 m (39.4 ft) to an estimated 100–200 m (328–656 ft). Width and depth along the springbrook averaged 51.2 cm (20.2 in) and 2.4 cm (0.9 in), respectively. Mean depth and length of the springbrook in WY2023 were similar to previous years, but it was narrower on average (Table 51).
Water Quality
Core water quality (Table 52) and water chemistry (Table 53) data were collected at the primary sampling location near the orifice in WY2023. Dissolved oxygen, specific conductivity, water temperature, and total dissolved solids values were consistent with prior measurements, while pH was lower than in past years. Magnesium and potassium levels were within the ranges of prior values. Alkalinity, calcium, and sulphate levels were higher and chloride was lower than in previous years.
Screwbean Spring Data Tables
| Sampling Location | WY2023 Mean (range of prior means) |
Prior Years Measured (# of visits with measurements) |
|---|---|---|
| 004 | c.n.s. (2.0–4.3) | 2018–2021 (4) |
| Measurement | Range of Means (WY2018 and WY2019) |
Years Measured (# of visits with measurements) |
|---|---|---|
| Width (m) | 9.9–12.6 | 2018–2019 (2) |
| Depth (cm) | c.n.s. | 2018–2019 (2) |
| Length (m) | 20.8–34.3 | 2018–2019 (2) |
| Measurement | WY2023 Value (range of prior values/means) |
Prior Years Measured (# of visits with measurements) |
|---|---|---|
| Width (cm) | 51.2 ±37.1 (62.5–90.2) | 2020–2022 (3) |
| Depth (cm) | 2.4 ± 1.1 (2.0–2.8) | 2020–2022 (3) |
| Length (m) | 12.4 (12.0–47.3) | 2020–2022 (3) |
| Sampling Location | Measurement Location | Parameter | WY2023 Value (range of prior values) |
Prior Years Measured (# of measurements) |
|---|---|---|---|---|
| 001 | Center | Dissolved oxygen (mg/L) | 3.93 (2.75–6.92) |
2018–2022 (5) |
| 001 | Center | pH | 7.75 (7.77–8.27) |
2018–2022 (5) |
| 001 | Center | Specific conductivity (µS/cm) | 1,674 (1,031–2,006) |
2018–2022 (5) |
| 001 | Center | Temperature (°C) | 19.3 (17.9–19.7) |
2018–2022 (7) |
| 001 | Center | Total dissolved solids (mg/L) | 1,086.0 (669.0–1,306.5) |
2018–2022 (5) |
| Sampling Location | Measurement Location | Parameter | WY2023 Value (range of prior values) |
Prior Years Measured (# of measurements) |
|---|---|---|---|---|
| 001 | Center | Alkalinity (CaCO3) |
290 (195–275) |
2018–2022 (5) |
| 001 | Center | Calcium (Ca) |
34 (22–32) |
2018–2022 (5) |
| 001 | Center | Chloride (Cl) |
19 (27–87) |
2018–2022 (5) |
| 001 | Center | Magnesium (Mg) |
13 (b.d.l.–13) |
2018–2022 (5) |
| 001 | Center | Potassium (K) |
1.3 (0.2–2.6) |
2018–2022 (5) |
| 001 | Center | Sulphate (SO4) |
680 (180–570) |
2018–2022 (5) |
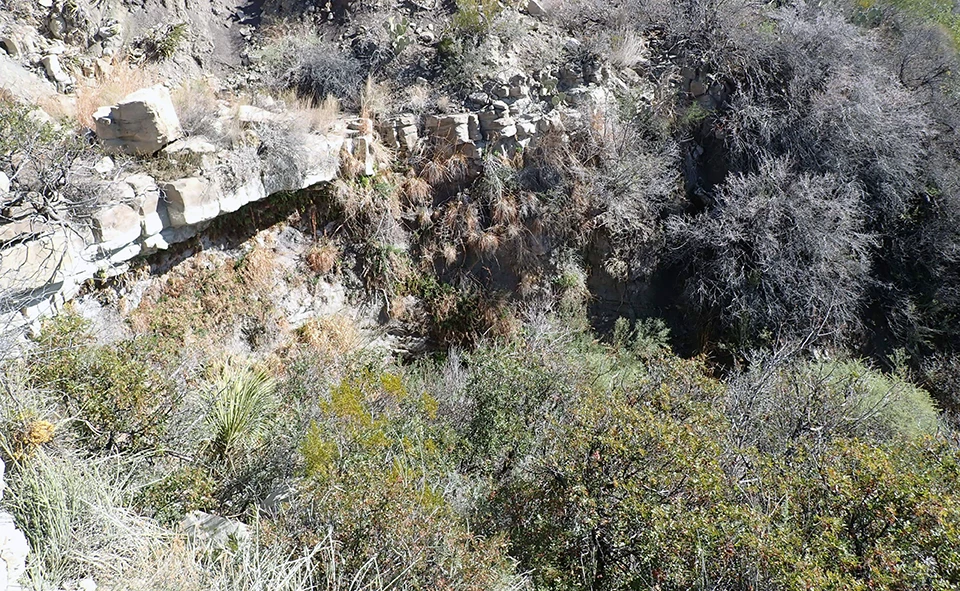
NPS
Shelf Spring
Shelf Spring (Figure 41) is a hanging garden spring (a complex, multi-habitat spring that emerges along geologic contacts and seeps onto underlying walls). The spring flows from a bedrock cliff and into a drainage north of Black Gap Road. At the base of the hanging garden, flow becomes subsurface and re-emerges about 5 m down the channel. Surface flow continues intermittently as a small stream with shallow pools under a sometimes dense canopy of smooth sumac and willows. The springbrook has ranged from 24 to 33 m in length at recent visits. The WY2023 visit occurred on 03 February 2023, and the spring was wetted (contained water).
Site Condition
In WY2023, we rated Shelf Spring slightly disturbed by contemporary human use with trash at the site (rated undisturbed to slightly disturbed in the past); slightly disturbed by recent flooding based on downed grasses along the springbrook (rated undisturbed to moderately disturbed in the past); and slightly disturbed by wildlife because of animal tracks (rated slightly disturbed in the past). No other natural or human-caused disturbances were observed at Shelf Spring in WY2023.
As in past years, we did not observe invasive non-native crayfish or American bullfrog (Lithobates catesbeianus), and we did not observe any invasive non-native plants at Shelf Spring in WY2023.
We observed four obligate or facultative wetland plants at Shelf Spring in WY2023: bluestem (Andropogon sp., a grass observed in 2018–2022); maidenhair fern (Adiantum sp., a fern observed in 2018–2022); mule-fat (Baccharis salicifolia, a shrub observed in 2018–2022); and spikerush (Eleocharis sp., a sedge observed in 2018–2021).
Water Quantity
Sensors are deployed and data are downloaded during our annual visit, which takes place in the middle of the water year; the dates of these visits are indicated by black diamonds in the persistence graph (Figure 42). The temperature sensor data are missing due to a sensor malfunction, so there is no estimate of persistence for WY2023. In prior water years, the spring was wetted 100% of the days measured across entire water years.
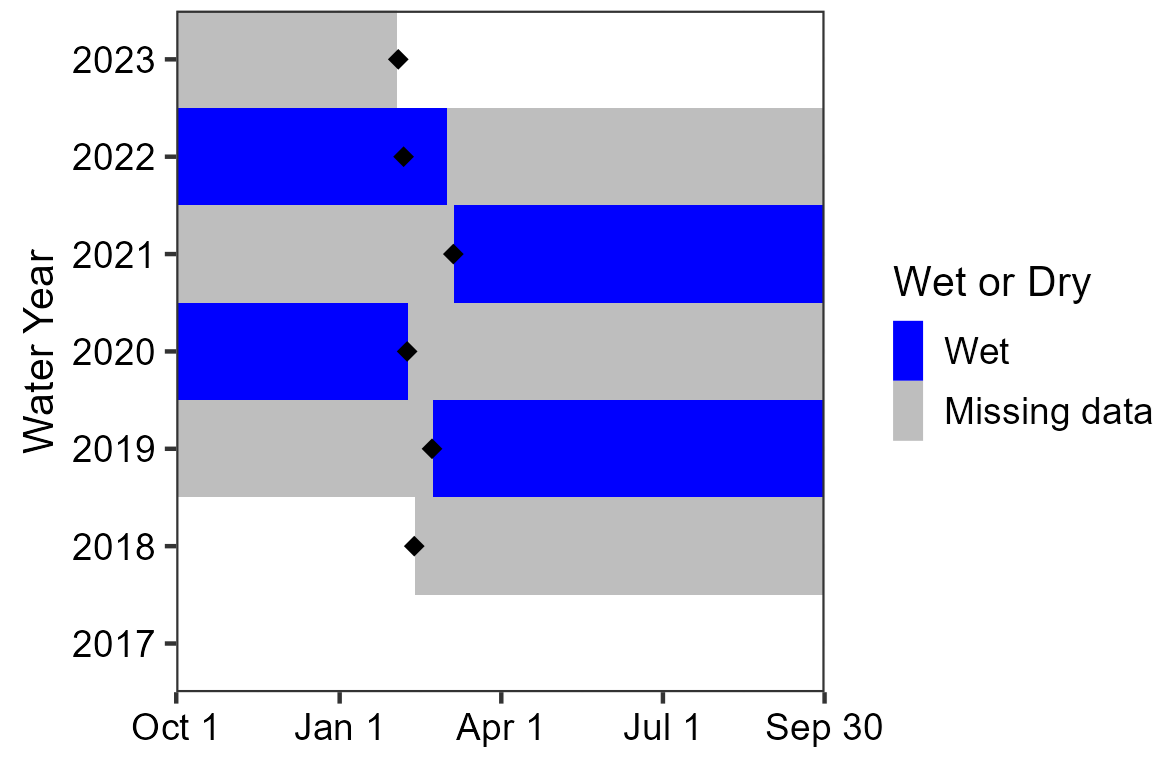
NPS
Discharge was estimated at 0.7 ± 0.1 L/min (0.2 ± 0.03 gal/min) in WY2023. Discharge measurements were not taken at this sampling location in the past; therefore, no prior measurements are available for comparison (Table 54).
Wetted extent was evaluated using a method for flowing water. The total springbrook length in WY2023 was 32.2 m (105.6 ft). In the past, lengths ranged from 23.9 to 33.1 m (78.4 to 108.6 ft). Width and depth along the springbrook averaged 13.2 cm (5.2 in) and 0.7 cm (0.3 in), respectively. Mean width, depth, and length of the springbrook were within historical ranges (Table 55).
Water Quality
Core water quality (Table 56) and water chemistry (Table 57) data were collected at the primary sampling location in WY2023, in the pool closest to the hanging garden. Water temperature was within the range of results from prior years. Values for dissolved oxygen and pH were lower and specific conductivity and total dissolved solids were higher than previously observed. Alkalinity, calcium, chloride, magnesium, and potassium levels were within historical ranges. Sulphate was higher than in prior years.
Shelf Spring Data Tables
| Sampling Location | WY2023 Mean (range of prior means) |
Prior Years Measured (# of visits with measurements) |
|---|---|---|
| 004 | 0.7 ± 0.1 (c.n.s.) | c.n.s. |
| Measurement | WY2023 Value (range of prior values/means) |
Prior Years Measured (# of visits with measurements) |
|---|---|---|
| Width (cm) | 13.2 ± 17.0 (10.6–26.0) | 2018–2022 (5) |
| Depth (cm) | 0.7 ± 0.7 (0.4–0.9) | 2018–2022 (5) |
| Length (m) | 32.2 (23.9–33.1) | 2018–2022 (5) |
| Sampling Location | Measurement Location | Parameter | WY2023 Value (range of prior values) |
Prior Years Measured (# of measurements) |
|---|---|---|---|---|
| 001 | Center | Dissolved oxygen (mg/L) | 3.74 (3.88–6.35) |
2018–2022 (5) |
| 001 | Center | pH | 7.25 (7.49–7.93) |
2018–2022 (5) |
| 001 | Center | Specific conductivity (µS/cm) | 576.0 (280.2–560.0) |
2018–2022 (5) |
| 001 | Center | Temperature (°C) | 19.8 (14.2–20.4) |
2018–2022 (7) |
| 001 | Center | Total dissolved solids (mg/L) | 374 (182–364) |
2018–2022 (5) |
| Sampling Location | Measurement Location | Parameter | WY2023 Value (range of prior values) |
Prior Years Measured (# of measurements) |
|---|---|---|---|---|
| 001 | Center | Alkalinity (CaCO3) |
225 (195–275) |
2018–2022 (5) |
| 001 | Center | Calcium (Ca) |
44 (38–50) |
2018–2022 (5) |
| 001 | Center | Chloride (Cl) |
17 (9–32) |
2018–2022 (5) |
| 001 | Center | Magnesium (Mg) |
13 (7–34) |
2018–2022 (5) |
| 001 | Center | Potassium (K) |
1.4 (0.0–7.2) |
2018–2022 (5) |
| 001 | Center | Sulphate (SO4) |
58 (40–55) |
2018–2022 (5) |
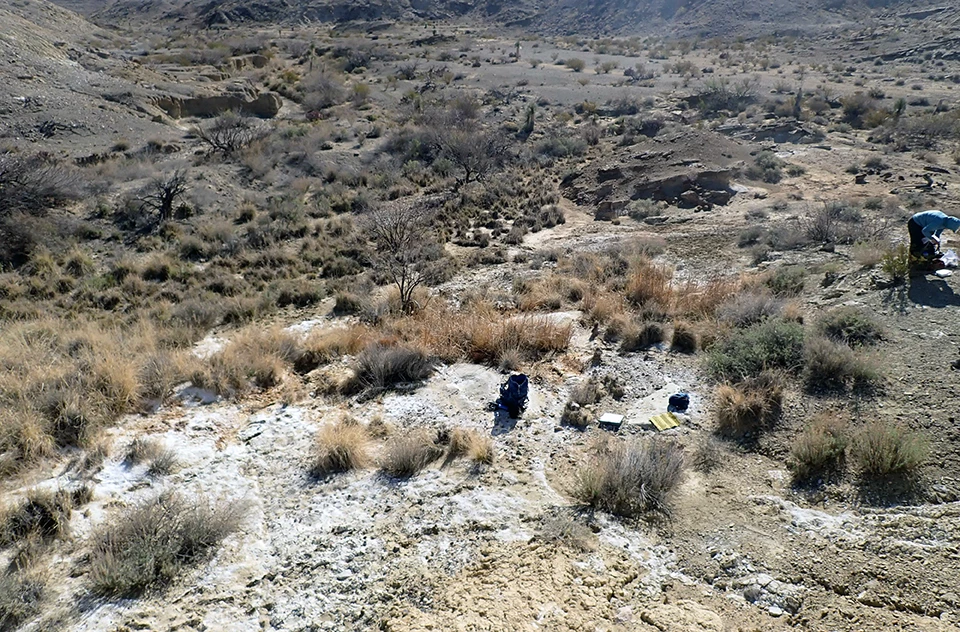
NPS
Solis Spring
Solis Spring (Figure 43) is a rheocrene spring (a spring that emerges into one or more stream channels) located inside a drainage southeast of Talley Mountain. Solis Spring is a complex of seeps on the edge of a shallow drainage, forming small, silt-bottomed pools along the bank. At higher flows, the seeps have formed individual channels that join and flow into the main drainage. Channel length has ranged from 7.7 to 32.5 m in length in recent years. Thick mineral deposits coat the banks surrounding Solis Spring. The WY2023 visit occurred on 06 February 2023, and the spring was wetted (contained water).
Site Condition
In WY2023, we rated Solis Spring slightly disturbed by wildlife based on deer scat at the spring (rated undisturbed to moderately disturbed in the past); moderately disturbed by livestock due to cattle and horse prints, manure, and evidence of grazing throughout the site (rated undisturbed in the past); and moderately disturbed by drying because there were upland plants and heavy mineral deposits (rated undisturbed to moderately disturbed in the past). No other natural or human-caused disturbances were observed at Solis Spring in WY2023.
As in past years, we did not observe invasive non-native crayfish or American bullfrog (Lithobates catesbeianus) at Solis Spring in WY2023. We observed two invasive non-native plants: scattered patches of tree tobacco (Nicotiana glauca, 1–5 plants observed in 2022) and 1–5 tamarisk trees (Tamarix sp., 1–5 plants observed in 2018–2022).
We observed five obligate or facultative wetland plants at Solis Spring in WY2023: a member of the cattail family (Typhaceae, observed in 2017–2022); centaury (Centarium sp., a forb observed in 2020–2022); a member of the sedge family (Cyperaceae, observed in 2017); spikerush (Eleocharis sp., a sedge observed in 2018–2022); and tamarisk (Tamarix sp., a tree observed in 2017–2022).
Water Quantity
Sensors are deployed and data are downloaded during our annual visit, which takes place in the middle of the water year; the dates of these visits are indicated by black diamonds in the persistence graph (Figure 44). The temperature sensor indicated that Solis Spring was wetted for 87 of 87 days (100%) measured up to the WY2023 visit. In prior water years, the spring was wetted 75.6–100% of the days measured across entire water years.
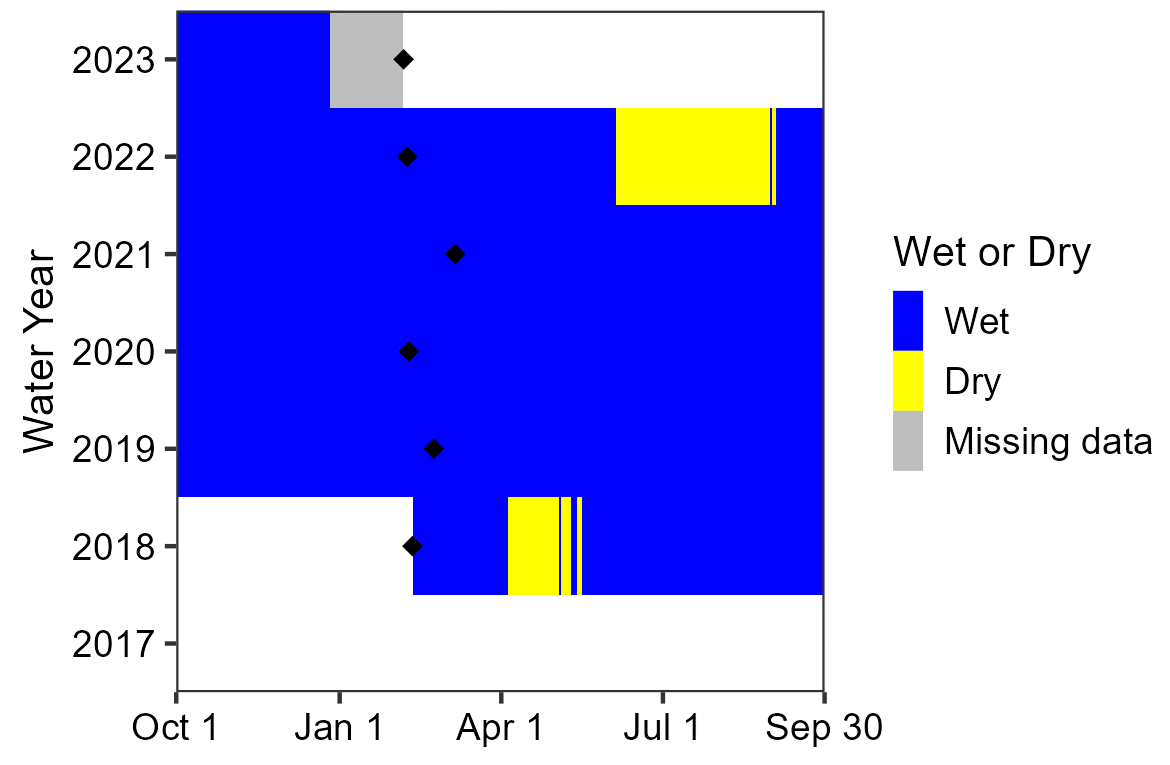
NPS
Discharge was not measured in WY2023 at the primary sampling location because there was no measurable flow. Past data are summarized in Table 58.
Wetted extent was evaluated using a method for flowing water. The total springbrook length in WY2023 was 12.7 m (41.7 ft). In the past, lengths ranged from 7.7 to 32.8 m (25.3 to 107.6 ft). Width and depth along the springbrook averaged 37.8 cm (14.9 in) and 0.5 cm (0.2 in), respectively. Mean width, depth, and length were within historical ranges (Table 59).
Water Quality
Core water quality (Table 60) and water chemistry (Table 61) data were collected at the primary sampling location in WY2023. A syringe and calibration cup were used to collect and measure the sample for core water quality and a syringe was used to collect the sample for water chemistry, which may affect our results. Dissolved oxygen, specific conductivity, and total dissolved solids values were within the ranges of values recorded in prior years. The pH level was lower and water temperature was higher than previously observed. Alkalinity, chloride, magnesium, and sulphate levels were all above measurements in prior years, while potassium was within the range of prior results. The calcium value is excluded because of a sampling error (the value failed to meet data quality standards).
Solis Spring Data Tables
| Sampling Location | WY2023 Mean (range of prior means) |
Prior Years Measured (# of visits with measurements) |
|---|---|---|
| 006 | c.n.s. (0.1) | 2020 (1) |
| Measurement | WY2023 Value (range of prior values/means) |
Prior Years Measured (# of visits with measurements) |
|---|---|---|
| Width (cm) | 37.8 ± 24.5 (14.0–99.7) | 2018–2022 (5) |
| Depth (cm) | 0.5 ± 0.5 (0.1–1.5) | 2018–2022 (5) |
| Length (m) | 12.7 (7.7–32.5) | 2018–2022 (5) |
| Sampling Location | Measurement Location | Parameter | WY2023 Value (range of prior values) |
Prior Years Measured (# of measurements) |
|---|---|---|---|---|
| 002 | Center | Dissolved oxygen (mg/L) | 8.99 (3.47–10.29) |
2018–2022 (5) |
| 002 | Center | pH | 7.92 (8.13–9.62) |
2018–2022 (5) |
| 002 | Center | Specific conductivity (µS/cm) | 3,763 (2,983–16,538) |
2018–2022 (5) |
| 002 | Center | Temperature (°C) | 16.5 (8.7–16.4) |
2018–2022 (7) |
| 002 | Center | Total dissolved solids (mg/L) | 2,446 (1,937–10,750) |
2018–2022 (5) |
| Sampling Location | Measurement Location | Parameter | WY2023 Value (range of prior values) |
Prior Years Measured (# of measurements) |
|---|---|---|---|---|
| 002 | Center | Alkalinity (CaCO3) |
440 (370–400) |
2018–2020 (3) |
| 002 | Center | Calcium (Ca) |
n.a.* (18–24) |
2018–2020 (3) |
| 002 | Center | Chloride (Cl) |
115 (b.d.l.–83) |
2018–2020 (3) |
| 002 | Center | Magnesium (Mg) |
13 (b.d.l.–9) |
2018–2020 (3) |
| 002 | Center | Potassium (K) |
0.2 (0.1–2.3) |
2018–2020 (3) |
| 002 | Center | Sulphate (SO4) |
195 (55–190) |
2018–2020 (3) |
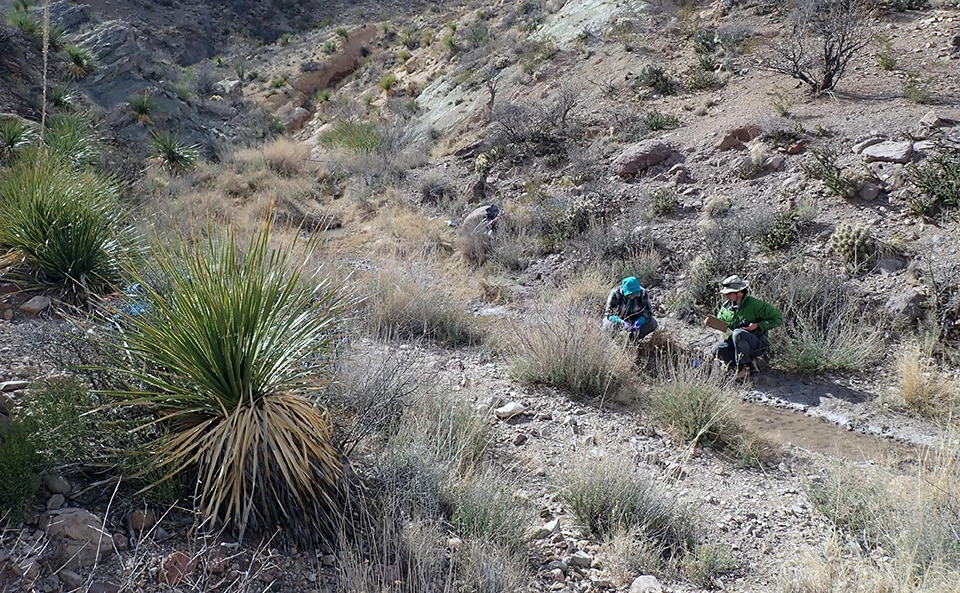
NPS
Tiptoe Spring
Tiptoe Spring (Figure 45) is a rheocrene spring (a spring that emerges into one or more stream channels) in a drainage on the southeast side of the Grapevine Hills. The spring emerges inside a fairly open, rocky wash lined with grasses and shrubs. The springbrook has been characterized by shallow, disconnected pools in recent years, and the channel has ranged in length from 22.2 to 75.2 m. The WY2023 visit occurred on 17 February 2023, and the spring was wetted (contained water).
Site Condition
In WY2023, we rated Tiptoe Spring slightly disturbed by drying because there were upland plant species present in the riparian area and dry, salty, white soil surrounding the wetted areas (rated undisturbed to slightly disturbed in the past) and slightly disturbed by wildlife based on wildlife tracks and scat piles in and around the spring (rated slightly to moderately disturbed in the past). No other natural or human-caused disturbances were observed at Tiptoe Spring in WY2023.
As in past years, we did not observe invasive non-native crayfish or American bullfrog (Lithobates catesbeianus), and we did not observe any invasive non-native plants at Tiptoe Spring in WY2023.
We observed four obligate or facultative wetland plants at Tiptoe Spring in WY2023: bluestem (Andropogon sp., a grass observed in 2017–2022); centaury (Centarium sp., a forb observed in 2022); a member of the rush family (Juncaceae, observed in 2018–2022); and spikerush (Eleocharis sp., a sedge observed in 2018–2022).
Water Quantity
Sensors are deployed and data are downloaded during our annual visit, which takes place in the middle of the water year; the dates of these visits are indicated by black diamonds in the persistence graph (Figure 46). The temperature sensor data are missing due to the loss of the sensor at the spring, so there is no estimate of persistence for WY2023 or the second half of WY2022. A replacement sensor was deployed during the WY2023 visit. In prior water years, the spring was wetted 50–100% of the days measured across entire water years.
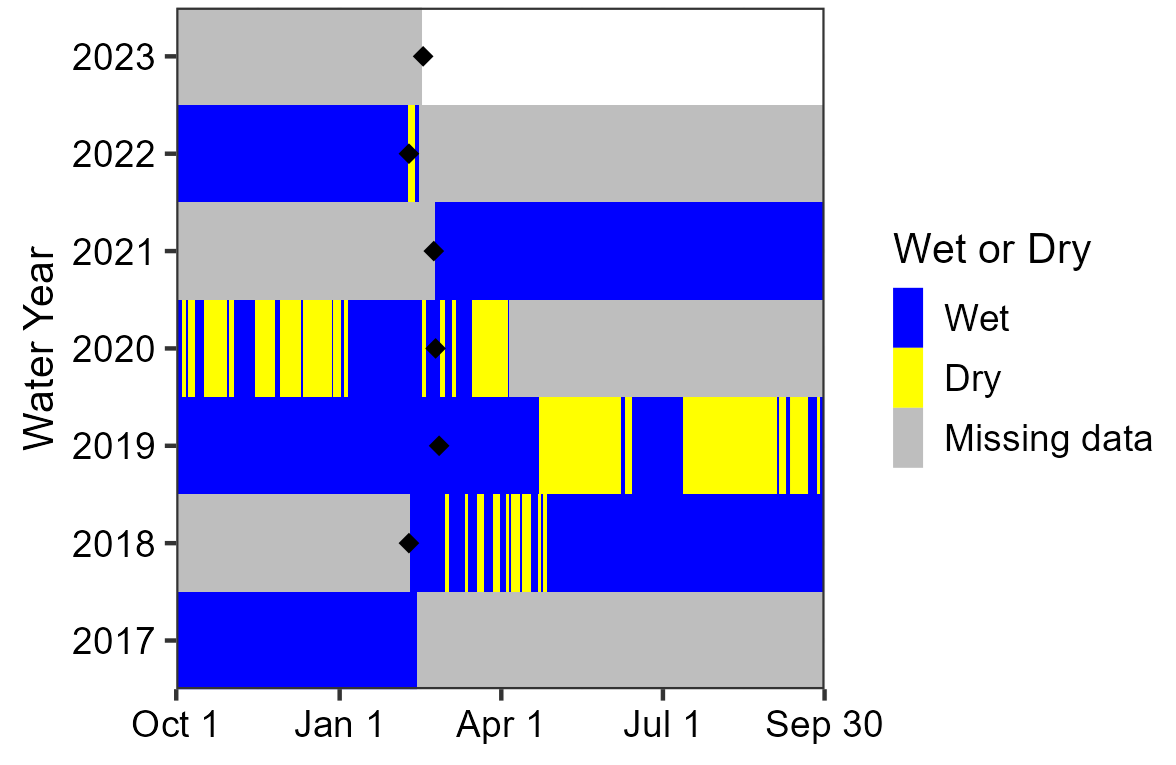
NPS
Discharge was not measured in WY2023 at the primary sampling location because there was no measurable flow. Past data are summarized in Table 62.
Wetted extent was evaluated using a method for flowing water. The total springbrook length in WY2023 was 25.6 m (84.0 ft). In the past, lengths ranged from 22.2 to 75.2 m (72.8 to 246.7 ft). Width and depth along the springbrook averaged 52.2 cm (20.6 in) and 2.4 cm (0.9 in), respectively. Mean depth and length were within historical ranges, but the springbrook was wider on average (Table 63).
Water Quality
Core water quality (Table 64) data were collected at the primary sampling location (#006). The primary sampling location for water chemistry data was location #001 until WY2023, when it changed to location #006 because there was no water at location #001 (Table 65). Since the new sampling location was within 3 m of the prior location in the same channel, we did compare WY2023 water chemistry values to prior values. The values for dissolved oxygen, specific conductivity, and total dissolved solids were higher than previously recorded, while temperature and pH values were within the ranges of prior values. Calcium and magnesium levels were similar to previous measurements. Alkalinity, potassium, and sulphate values were higher and chloride was lower than in prior years.
Tiptoe Spring Data Tables
| Sampling Location | WY2023 Mean (range of prior means) |
Prior Years Measured (# of visits with measurements) |
|---|---|---|
| 005 | c.n.s. (0.4–0.7) | 2019–2021 (3) |
| Measurement | WY2023 Value (range of prior values/means) |
Prior Years Measured (# of visits with measurements) |
|---|---|---|
| Width (cm) | 52.2 ± 30.6 (13.3–50.3) | 2017–2022 (6) |
| Depth (cm) | 2.4 ± 4.0 (0.4–3.2) | 2017–2022 (6) |
| Length (m) | 25.6 (22.2–75.2) | 2017–2022 (6) |
| Sampling Location | Measurement Location | Parameter | WY2023 Value (range of prior values) |
Prior Years Measured (# of measurements) |
|---|---|---|---|---|
| 006 | Center | Dissolved oxygen (mg/L) | 8.91 (3.91)* |
2022 (1) |
| 006 | Center | pH | 8.21 (7.51–8.48) |
2021–2022 (2) |
| 006 | Center | Specific conductivity (µS/cm) | 977 (775–784) |
2021–2022 (2) |
| 006 | Center | Temperature (°C) | 16.1 (7.7–16.4) |
2021–2022 (2) |
| 006 | Center | Total dissolved solids (mg/L) | 635 (504–510) |
2021–2022 (2) |
| Sampling Location (sampling location in prior years) | Measurement Location | Parameter | WY2023 Value (range of prior values) |
Prior Years Measured (# of measurements) |
|---|---|---|---|---|
| 006 (001) | Center | Alkalinity (CaCO3) |
350 (260–310) |
2018–2022 (5) |
| 006 (001) | Center | Calcium (Ca) |
32 (24–40) |
2018–2022 (5) |
| 006 (001) | Center | Chloride (Cl) |
1 (2–43) |
2018–2022 (5) |
| 006 (001) | Center | Magnesium (Mg) |
1 (b.d.l.–17) |
2018–2022 (5) |
| 006 (001) | Center | Potassium (K) |
1.6 (0.4–1.3) |
2018–2022 (5) |
| 006 (001) | Center | Sulphate (SO4) |
112 (74–106) |
2018–2022 (5) |
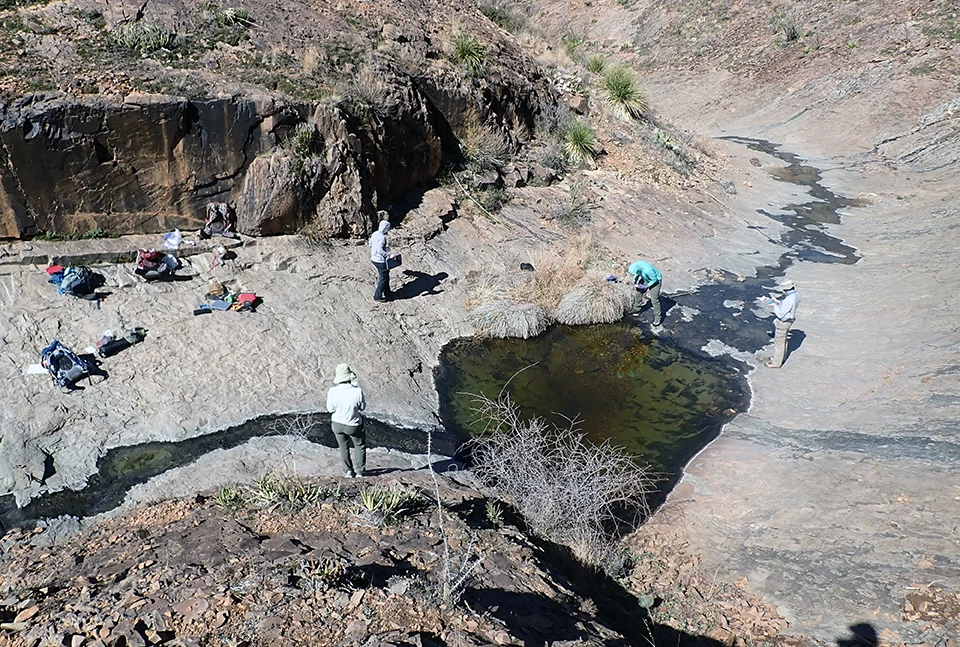
NPS
Water Boy Tinaja
Water Boy Tinaja (Figure 47) is a tinaja (small pool in a rock basin or impoundment) in bedrock located on the northeast side of the Chisos Mountains. The tinaja is typically about 5 m wide by 6 m long, and ranges between 0.5 to 0.9 m deep. Water Boy Tinaja collects runoff from the surrounding bedrock canyon walls, and at times a channel flows out of the pool and continues down the canyon, pooling intermittently in low-gradient areas. Large bunch grasses line the northwest edge of Water Boy Tinaja, and a catclaw overhangs the opposite side. Macroinvertebrate life abounds in this deep, clear pool. The WY2023 visit occurred on 04 February 2023, and the tinaja was wetted (contained water).
Site Condition
In WY2023, we rated Water Boy Tinaja slightly disturbed by hiking trails with evidence of humans cutting a trail up the drainage downstream of the spring (rated undisturbed in the past) and slightly disturbed by feral animals because of a barbary sheep carcass about 100 m upstream of the spring (rated undisturbed in the past). No other natural or human-caused disturbances were observed at Water Boy Tinaja in WY2023.
As in past years, we did not observe invasive non-native crayfish or American bullfrog (Lithobates catesbeianus) in WY2023. We observed one invasive non-native plant at Water Boy Tinaja: 1–5 Lehmann lovegrass plants (Eragrostis lehmanniana, 1–5 plants to scattered patches observed in 2017–2022).
We did not observe any obligate/facultative wetland plants at Water Boy Tinaja in WY2023.
Water Quantity
Sensors are deployed and data are downloaded during our annual visit, which takes place in the middle of the water year; the dates of these visits are indicated by black diamonds in the persistence graph (Figure 48). The temperature sensor indicated that Water Boy Tinaja was wetted for 100 of 102 days (98%) measured up to the WY2023 visit. In prior water years, the spring was wetted 67.9–100% of the days measured across entire water years.
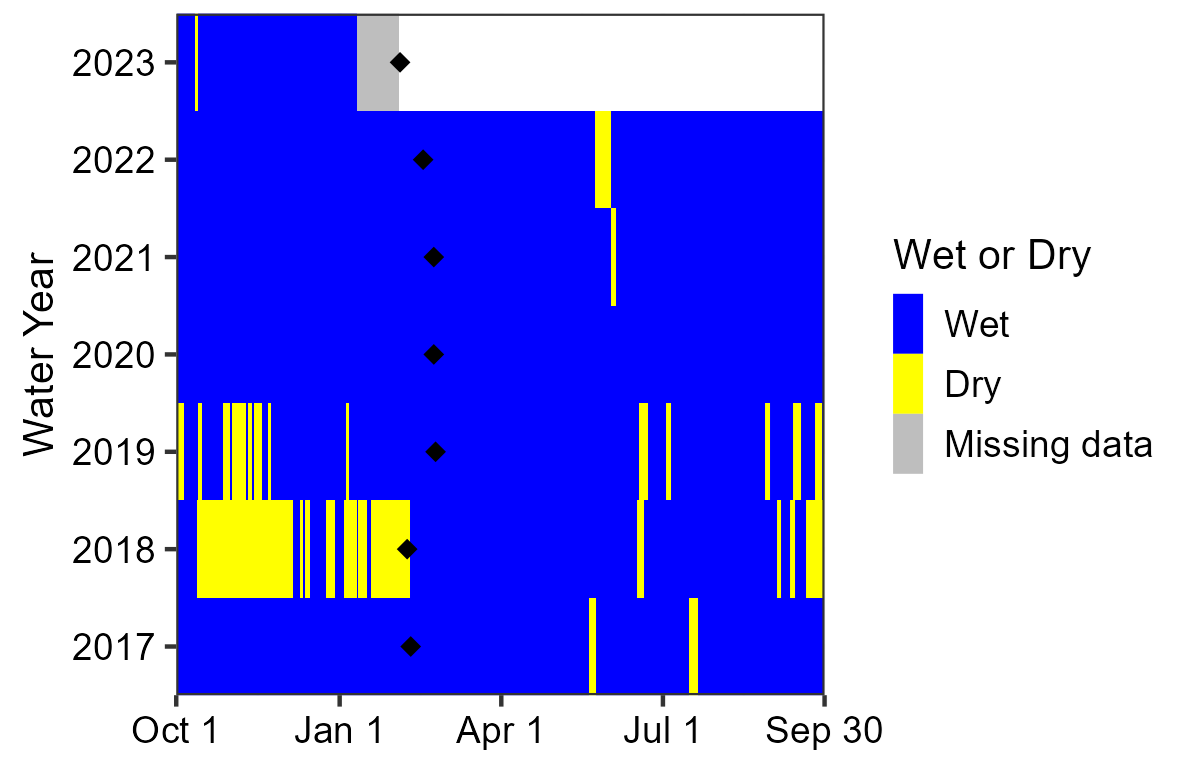
NPS
Discharge was not measurable in WY2023 since the tinaja had no outflow.
Wetted extent was evaluated using a method for standing water. Width averaged 4.8 m (15.7 ft), length averaged 5.9 m (19.4 ft), and depth averaged 75.7 cm (29.8 in) in WY2023. The mean values for width, depth, and length of the spring fell within the historical ranges of prior means (Table 66).
Water Quality
Core water quality (Table 67) and water chemistry (Table 68) data were collected at the primary sampling location in the center of the tinaja in WY2023. Dissolved oxygen, specific conductivity, water temperature, total dissolved solids, and pH levels were within the ranges of prior measurements. Alkalinity, calcium, chloride, magnesium, and potassium values were within prior ranges of values. Sulphate was not detected in WY2023 but was detected in previous years.
Water Boy Tinaja Data Tables
| Measurement | WY2023 Mean (range of prior means) |
Prior Years Measured (# of visits with measurements) |
|---|---|---|
| Width (m) | 4.8 ± 0.4 (4.5–4.9) | 2017–2022 (6) |
| Depth (cm) | 75.7 ± 28.0 (48.2–90.8) | 2017–2022 (6) |
| Length (m) | 5.9 ± 0.6 (5.6–6.3) | 2017–2022 (6) |
| Sampling Location | Measurement Location | Parameter | WY2023 Value (range of prior values) |
Prior Years Measured (# of measurements) |
|---|---|---|---|---|
| 001 | Center | Dissolved oxygen (mg/L) | 10.59 (8.18–11.11) |
2018–2022 (5) |
| 001 | Center | pH | 8.14 (8.08–8.90) |
2017–2022 (6) |
| 001 | Center | Specific conductivity (µS/cm) | 253.9 (33.7–435.0) |
2017–2022 (5) |
| 001 | Center | Temperature (°C) | 7.9 (5.0–14.2) |
2017–2022 (8) |
| 001 | Center | Total dissolved solids (mg/L) | 165.0 (96.0–282.8) |
2017–2022 (6) |
| Sampling Location | Measurement Location | Parameter | WY2023 Value (range of prior values) |
Prior Years Measured (# of measurements) |
|---|---|---|---|---|
| 001 | Center | Alkalinity (CaCO3) |
60 (55–150) |
2018–2022 (5) |
| 001 | Center | Calcium (Ca) |
34 (24–40) |
2018–2022 (5) |
| 001 | Center | Chloride (Cl) |
8 (4–61) |
2018–2022 (5) |
| 001 | Center | Magnesium (Mg) |
12 (3–50) |
2018–2022 (5) |
| 001 | Center | Potassium (K) |
1.3 (0.1–1.8) |
2018–2022 (5) |
| 001 | Center | Sulphate (SO4) |
0 (2–44) |
2018–2022 (5) |
Report Citation
Authors: Susan Singley, Kara Raymond, Arturo Aguilar
Singley, S., K. Raymond, and A. Aguilar. 2025. Climate and Water Monitoring at Big Bend National Park: Water Year 2023. Chihuahuan Desert Network, National Park Service, Las Cruces, New Mexico.
