Part of a series of articles titled Reckoning with a Warming Climate.
Article
Using Satellite Imagery to Detect the Changing Seasonality of River Ice
Christopher D. Arp, Research Associate Professor, Water and Environmental Research Center, Institute of Northern Engineering, University of Alaska Fairbanks
Todd J. Brinkman, Associate Professor, Institute of Arctic Biology, University of Alaska Fairbanks
Barbara A. Cellarius, Anthropologist/Subsistence Coordinator, Wrangell-St. Elias National Park and Preserve, National Park Service
Melanie Engram, Research Assistant, Water and Environmental Research Center, Institute of Northern Engineering, University of Alaska Fairbanks
Mark E. Miller, Ecologist, Wrangell-St. Elias National Park and Preserve, National Park Service
Katie V. Spellman, Research Associate Professor, International Arctic Research Center, University of Alaska Fairbanks
NPS/BARBARA CELLARIUS
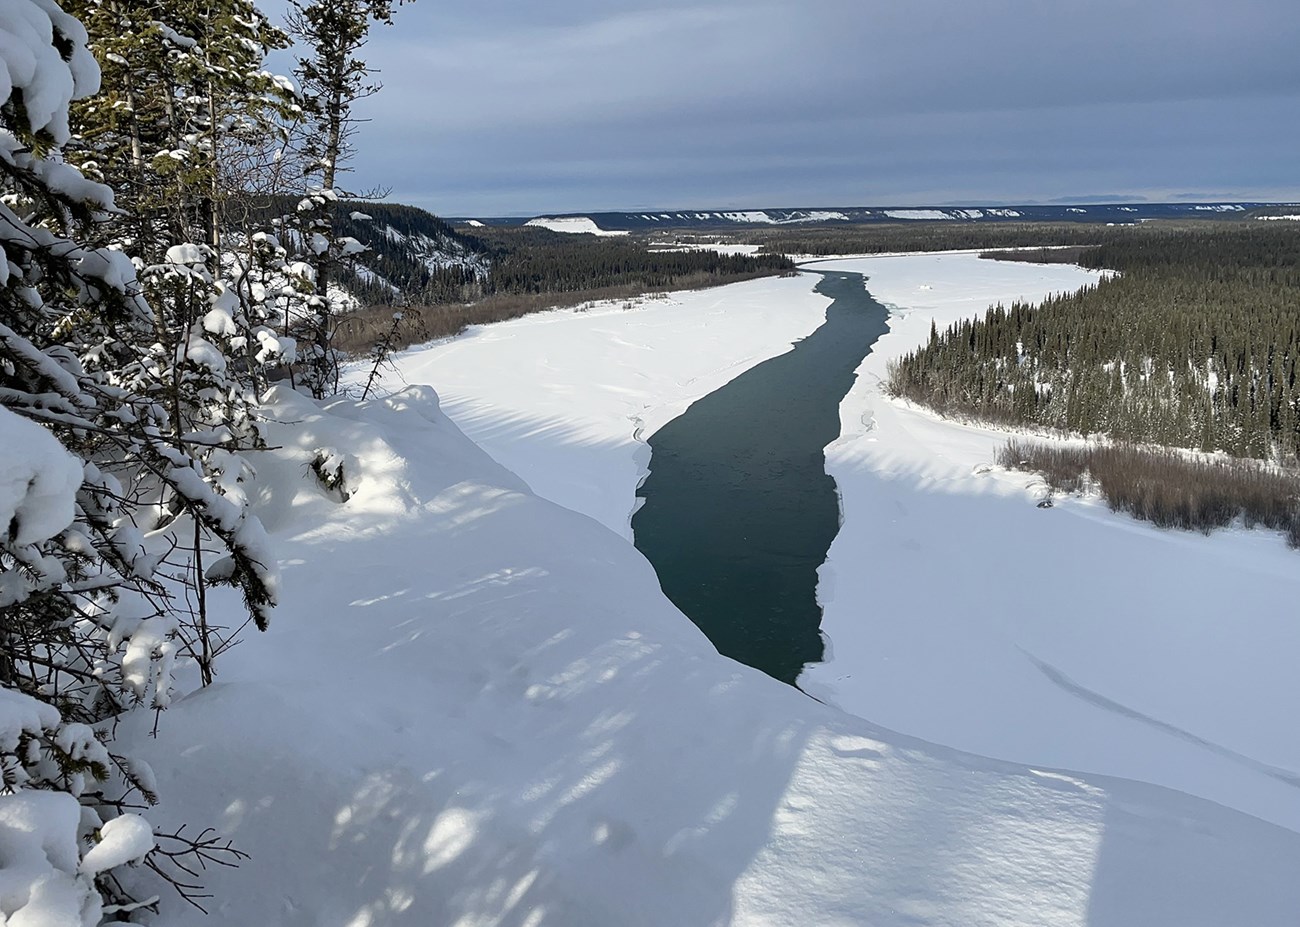
For many Alaskans, rivers are important travel corridors, both in the open-water season and over the ice cover in winter. Rivers provide access to the broader landscape, including hunting, fishing, trapping, and gathering areas that support the traditional harvest of local wild resources (Brown et al. 2022, Wolfe 2004). In areas throughout the state, climate change has negatively impacted river ice conditions for travel, with later and less predictable freeze-up, thinner ice, more open-water leads, and earlier break-up (Brown et al. 2018, Carothers et al. 2014, Cold et al. 2020, Herman-Mercer et al. 2011). These conditions can limit the window of wintertime river ice travel and access to resources, and present serious safety risks to travelers.
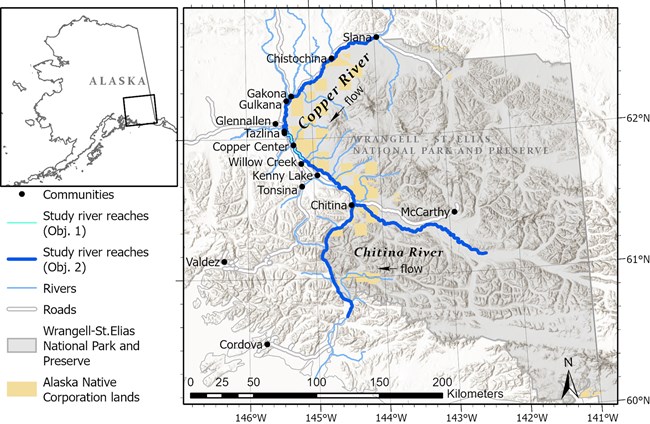
Land status from Bureau of Land Management and Alaska Department of Natural Resources, and topography from Esri, FAO, NOAA, USGS.
The Copper River Basin of Southcentral Alaska is one such area where residents have expressed concern about major changes in river ice conditions and the impacts on their lives. This is a rural area with small communities located along a road network primarily to the west of the Copper River (Figure 1). With only one bridge, local residents must cross the river to access land to the east of their communities. This land is within the traditional territory of the Ahtna people and currently comprises Wrangell-St. Elias National Park and Preserve, with inholdings owned by Ahtna, Incorporated, a regional Alaska Native Corporation, and Chitina Native Corporation, a village Alaska Native Corporation , as well as Native allotments owned by individuals (Figure 1). Several other rivers cross the park, further creating barriers to access when ice conditions are unsafe. Residents recall a time decades ago when they were able to easily and predictably cross ice-covered rivers in winter; however, this has become more difficult with rivers freezing later (or not at all), with unpredictable and unstable ice, and earlier break-up (Miller 2023).
These concerns prompted studies of wintertime access to subsistence resources in the national park and preserve. This study focuses on the use of satellite remote sensing to achieve two main objectives: (1) to document the historical changes in local river ice phenology (i.e., seasonality) and (2) to characterize the geospatial patterns and drivers of open water hazards along rivers. Our goals were to understand how river ice navigability has changed and to foster safe access to traditional lands and resources.
Long-term Change and Variability in River Ice Cover and Accessibility
We investigated changes in river ice cover and navigability using a ~50-year archive of satellite imagery from the Landsat Program. This analysis was focused on a 30-km portion of the Copper River near the community of Copper Center during water years (WY) 1973 to 2021. The water year is defined as October 1 – September 30, and named after the calendar year in which it begins. We chose this reach because it lies within the swath overlap of different satellite passes, which allowed us to maximize the frequency of Landsat observations. We examined variation in weekly ice extents, which we defined into categorical classes to represent the potential for widespread river ice travel (high ice extent) versus relative inaccessibility (low-moderate ice extent; Figure 2). These classifications were based on our visual interpretation of satellite imagery. The high ice extent class was defined as < 25 % of the river reach length affected by open water. Photos submitted by citizen scientists and from time-lapse cameras helped inform and validate our interpretations of the satellite imagery (Figure 2; Bondurant et al. 2022, FEI 2022, GLOBE 2022). Large open-water leads were easily detectable in the satellite imagery, but not all subpixel (<60-m) water features or other ice-related hazards could be identified.
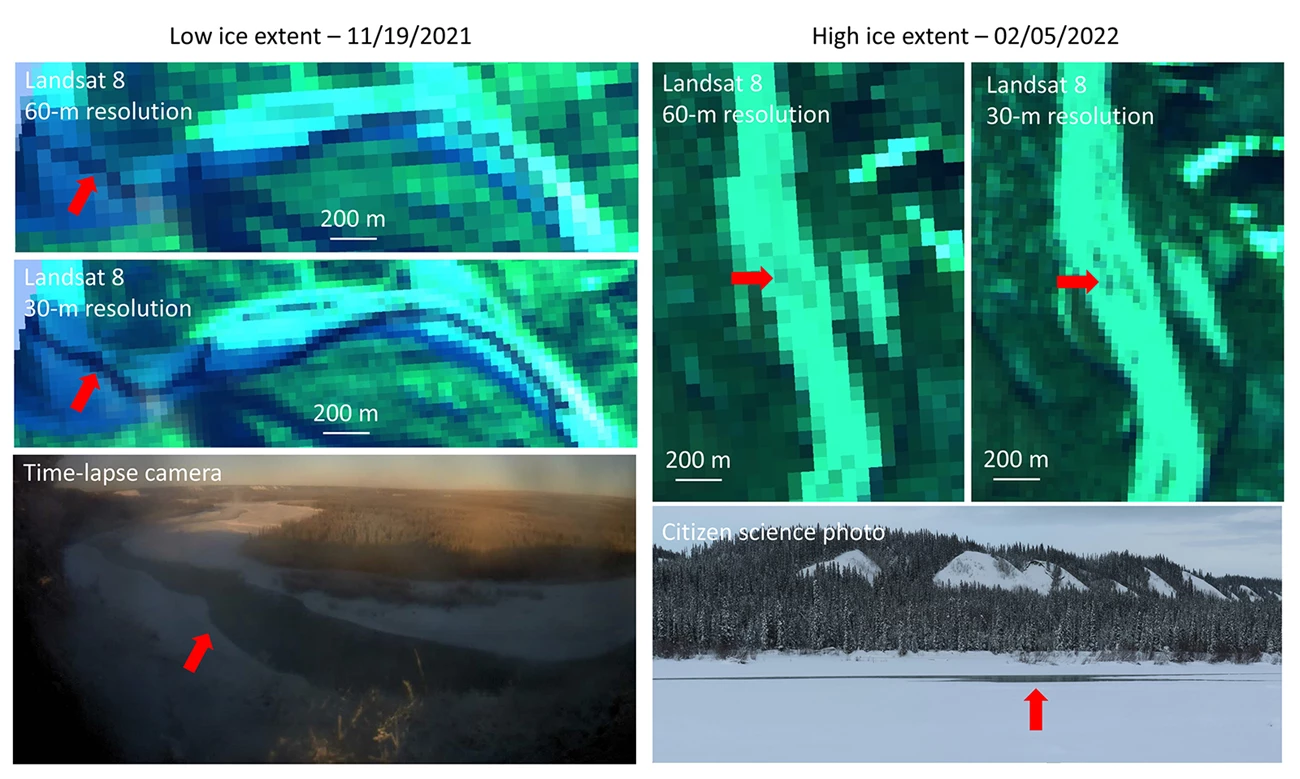
Classes were assigned by interpreting Landsat images at 60-m resolution, consistent across sensors. Landsat 8 images are shown in the resampled 60-m resolution and original 30-m resolution, are displayed with shortwave infrared, near infrared, and green.
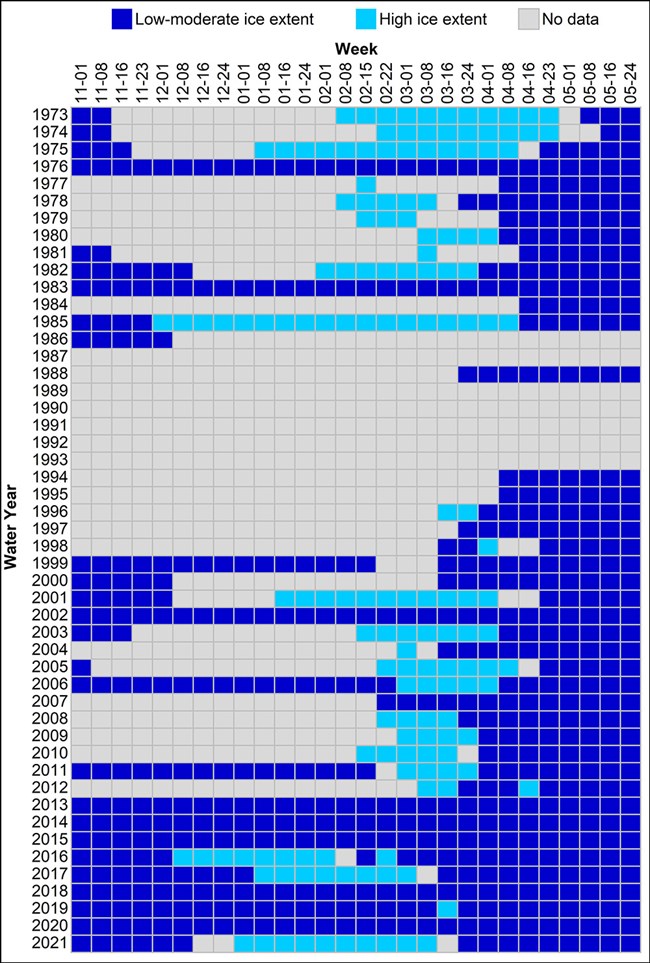
From year-to-year, we observed substantial variation in the timing, duration, and presence of high ice extents that would enable widespread river travel (Figure 3). Winters with incomplete freeze-up, or with only one week of high ice extent, were very common in recent years: WY 2013, 2014, 2015, 2018, 2019, and 2020. Though less common, winters with incomplete freeze-up were documented even in the early years of the Landsat record, including WY 1976 and 1983. However, there were numerous years for which we could not determine the occurrence of incomplete freeze-up, due to historic and seasonal gaps in suitable Landsat imagery.
Comparing weekly ice extent between the approximately equal time periods of WY 1973-1997 with WY 1998-2021, we found that the more recent time period had a consistently lower proportion of high ice extent observations for the full freeze-up through break-up cycle (Figure 4). For the WY 1973-1997 time period, there was an eight-week period (first week of February through last week of March) where the majority of weekly observations (>50%) were of high ice extents. By contrast, the WY 1998-2021 time period only had a two-week period (first and second weeks of March) where the majority of observations were of high ice extents.
To examine trends in weekly ice extent throughout the time series (WY 1973-2021), we used logistic regression to relate the proportion of observed ice extent categories to year on a weekly basis. The seasonal scope of this analysis was limited to late winter through spring (second week of February through second week of April), as only these weeks had a sufficient number of data points in each category. We found significant declines in the probability of high ice extents for each week tested (Figure 5a). Between WY 1973 and 2021, the probability of weekly high ice extent occurrence declined by an average of 53.3 (± 6.6) percentage points (difference in percentages, not the percent change; Figure 5b). For example, the probability of high ice extent between WY 1973 and 2021 declined from 74% to 17% for the second week of February, from 89% to 37% for the second week of March, and from 48% to 1% for the second week of April. For WY 1973, ice extent was most likely high (ranging from 68% to 89% probability) for eight of the nine weeks tested, whereas for WY 2021, high ice extent was unlikely (ranging from 7% to 40% probability) for this same time span.
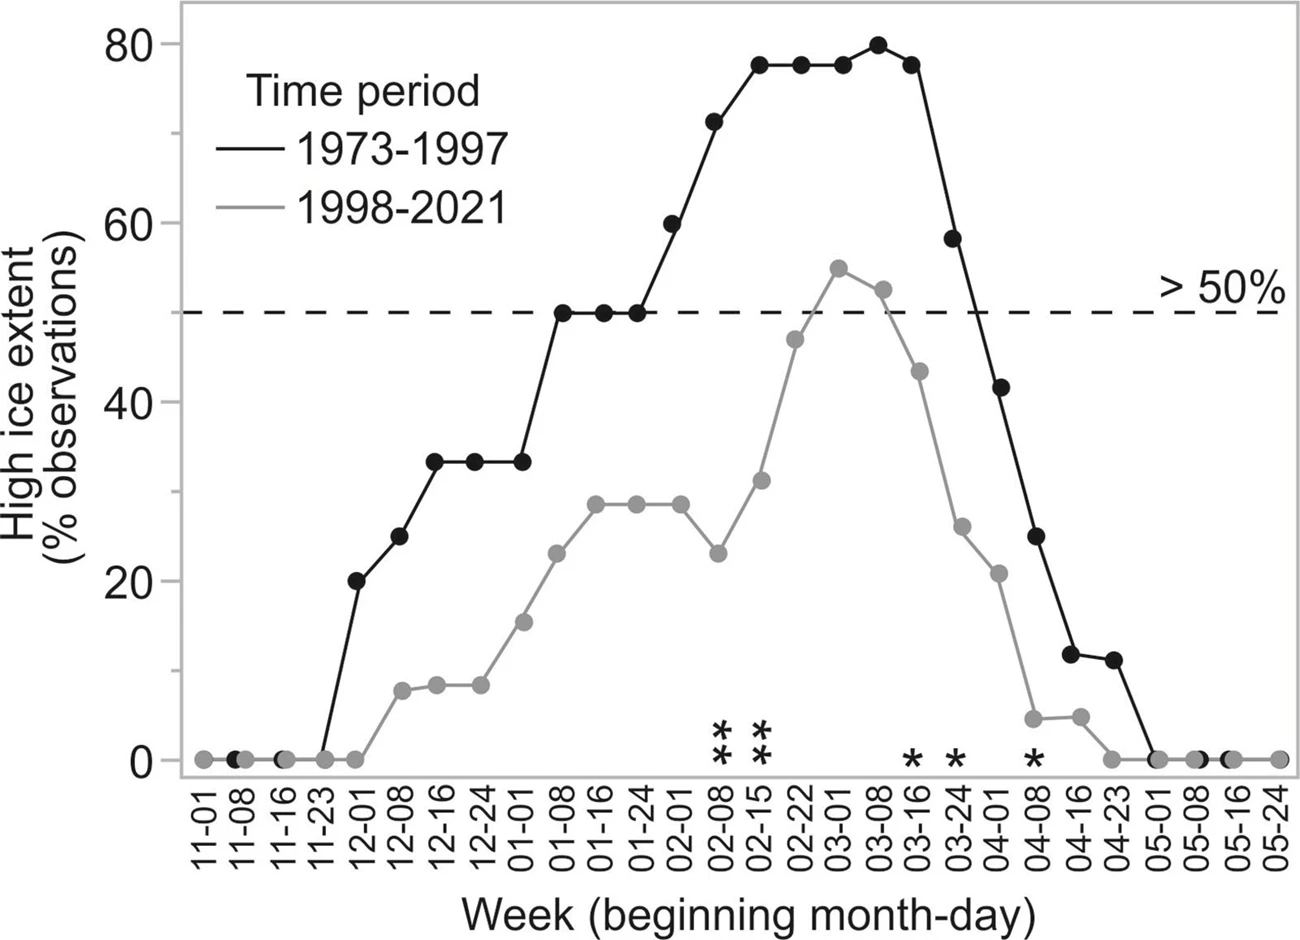
Statistical significance of weekly contingency analyses conducted from 02-08 through 04-08 is denoted as **P < 0.05 and *P < 0.1.
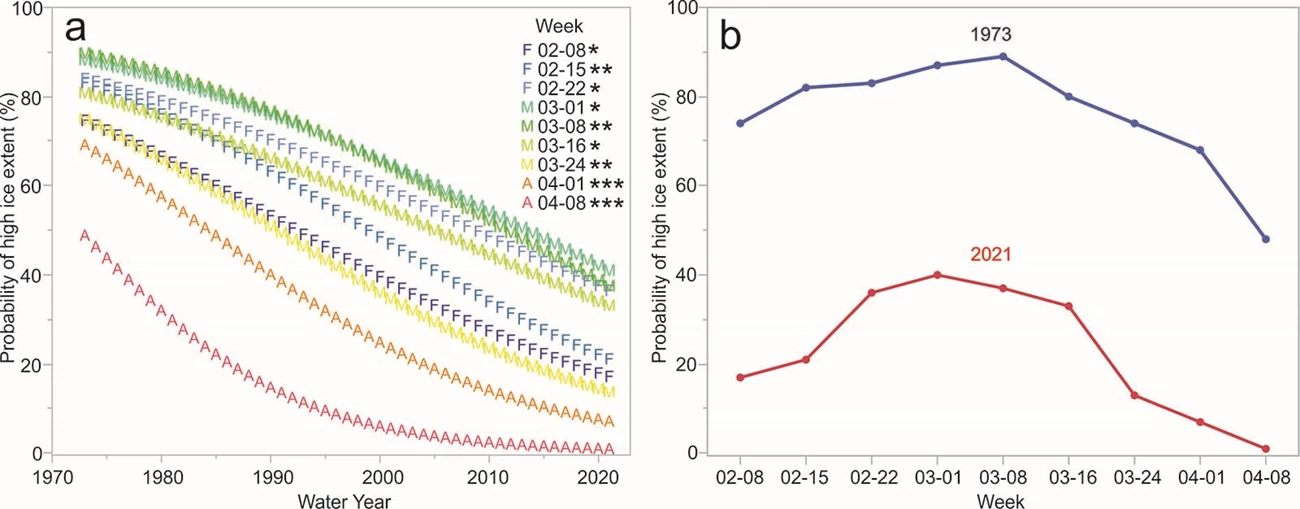
Decreasing trends in probability of high ice extents were found for all weeks tested. Statistical significance is denoted as ***P < 0.01, **P < 0.05, *P < 0.1.
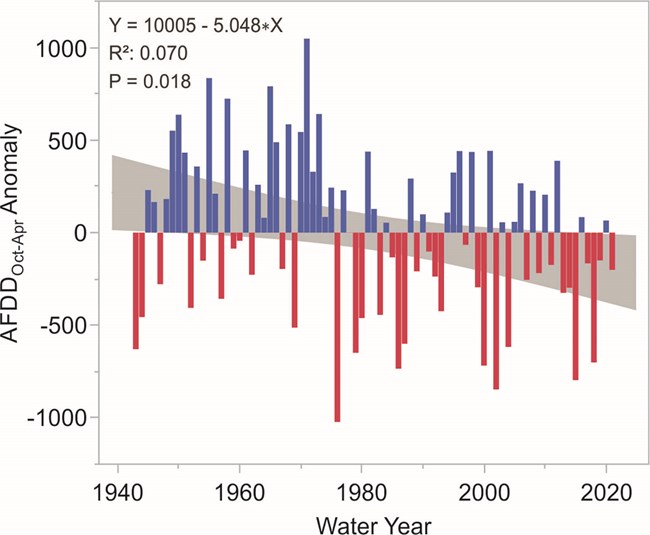
Statistics for simple linear regression are reported, and the 95% confidence interval for the mean response is shown in gray, showing a 15% decline in AFDD[Oct-Apr] and long-term warming trend.
To infer longer-term changes (WY 1943-2021) in ice extent for our study reach beyond the years of the Landsat record, we first examined relationships between our observations and metrics of local air temperature. Daily freezing degree days (FDD) were calculated by subtracting the daily mean air temperature from 0°C. Daily FDD is therefore positive when mean air temperature is below freezing, and negative when above freezing. Accumulated freezing degree days (AFDD) is the sum of daily FDD from the beginning of the water year. We found that AFDD was strongly related to ice extent for eight of the nine weeks tested with logistic regression (early February - early April, P = 0.0003 - 0.02). We therefore used seasonal AFDDOct-Apr for the full potential ice season to represent climatic conditions relevant to the river ice cover. Despite high variability among years, we found that seasonal AFDDOct-Apr decreased by 15% from WY 1943 to 2021 (linear regression, r2 = 0.07, P = 0.02; Figure 6). This trend indicates a long-term change over the last ~80 years towards warmer conditions and reduced ice cover through the freeze-up to break-up cycle.
Together, these analyses suggest that the formation of an ice cover conducive to travel (high ice extent) has shifted to later in the winter, that incomplete freeze-up has become more common, and that break-up has advanced to earlier in the springtime. The reduced and sometimes nonexistent periods of widespread ice cover can seriously limit the ability of residents to cross the river near their communities to access traditional lands and subsistence resources. However, we expected the patterns of open water occurrence to vary along the length of the river, which was the second focus of our study.
Geospatial Patterns in River Ice Cover and Open Water Occurrence
To assess geospatial variation in accessibility, we mapped open water area by river reach using Sentinel-2 optical imagery from late-winter for three recent years (WY 2018, 2020, and 2021). This analysis included approximately 217 miles (350 km) of the Copper River from Slana to south of Chitina. We compared open water area with hydrologic and geomorphic characteristics of the river reaches (Figure 7). We also examined Sentinel-1 Synthetic Aperture Radar (SAR) imagery and mapped water occurrence throughout the winters of WY 2018-2020 to visualize the progression of freeze-up (Figure 8). SAR remote sensing works by sending radar signals from the satellite sensor to Earth and measuring the strength of the signal that is reflected back to the sensor (“backscatter intensity"), which is influenced by the physical properties of the target.
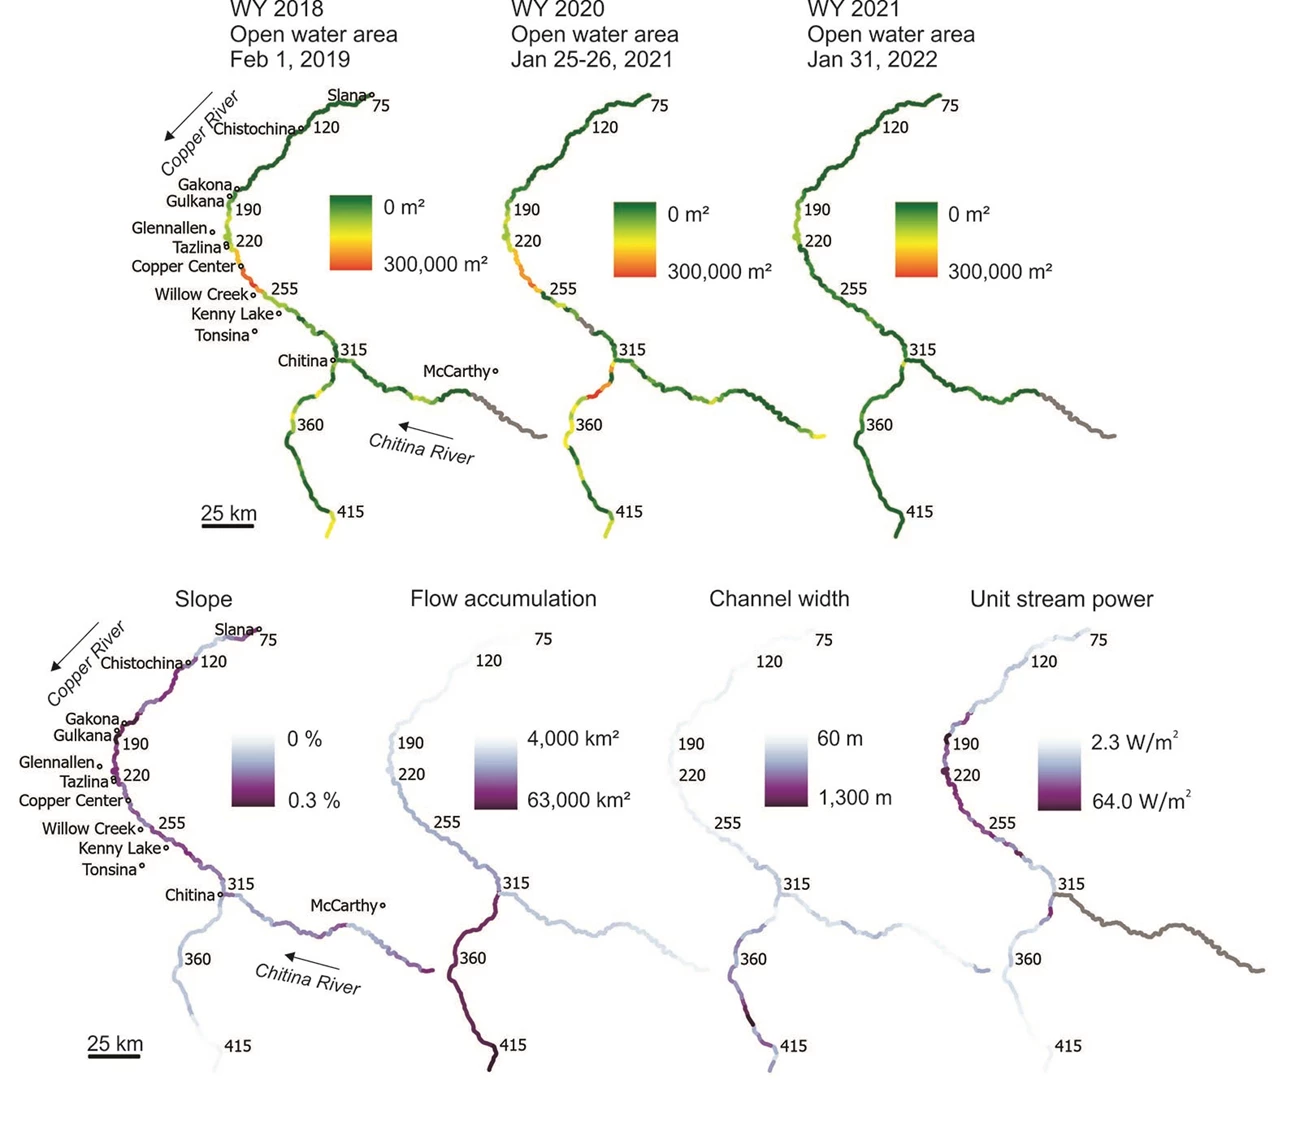
Total areas of open water in late winter were calculated from Sentinel-2 multispectral images acquired in the water year (WY) on dates indicated. Study reaches with no data are depicted in gray.
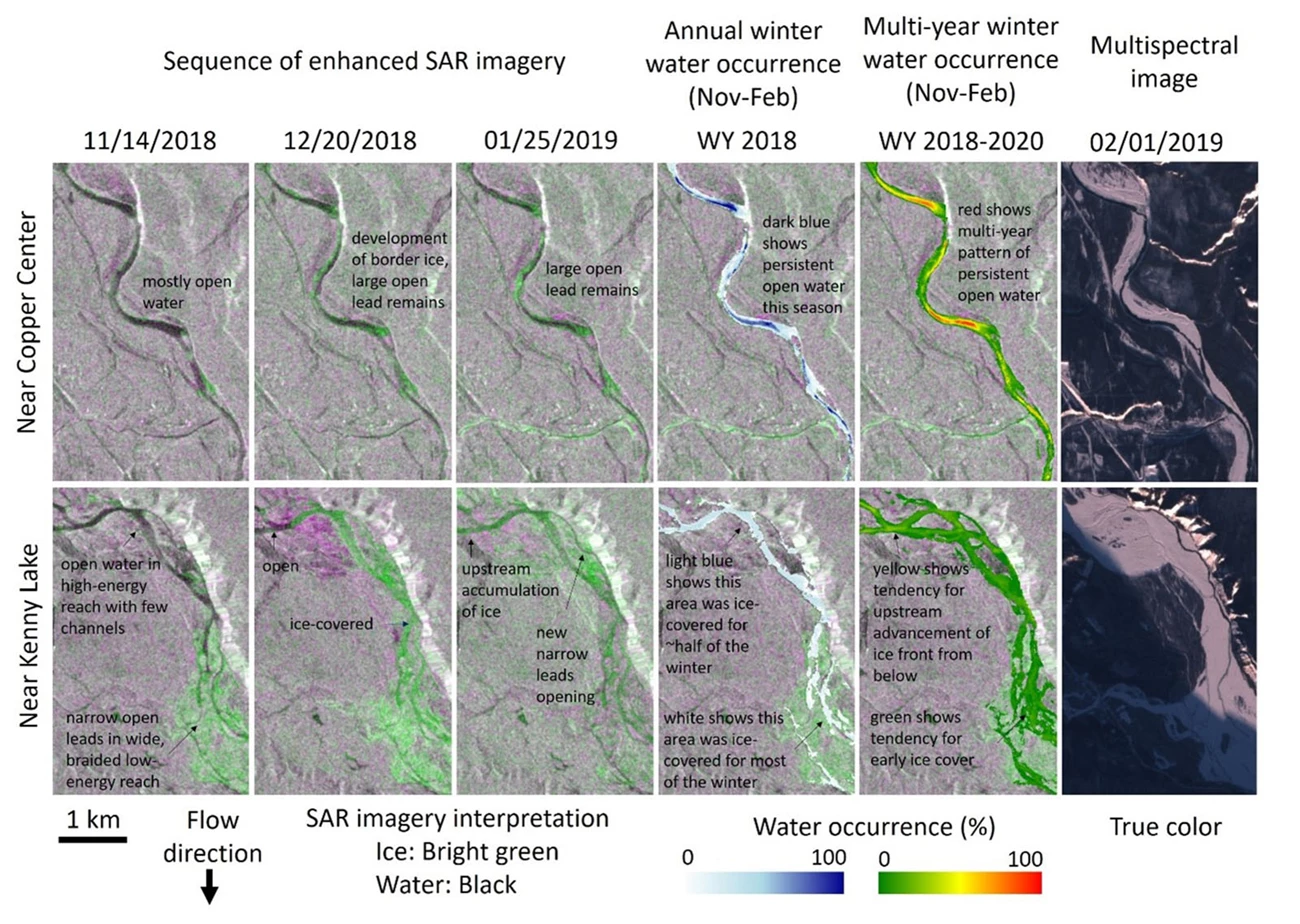
Distance from downstream jamming points influences the timing of freeze-up. Multispectral images (Sentinel-2) were used for validation.
While the extent of open water varied among years, some clear geospatial patterns emerged that can help guide decisions related to local river ice travel and access (Figures 7 and 8). For example, we found that a segment of the upper Copper River between Slana and Gakona had consistently low areas of open water in late winter and may currently provide the most reliable opportunities for community-accessible ice travel and crossings. The area between Kenny Lake and Chitina had low to moderate extents of open water. By contrast, extensive areas of open water and large contiguous leads tended to persist late into winter in the area between Gulkana and Willow Creek, including by Tazlina and Copper Center.
Much of this geographic variation in persistent open water we attribute to patterns of stream flow energy, river morphology, and distance from ice jamming points affecting the development of the ice cover. We quantified flow energy as unit stream power. High river discharge, high channel slope, and narrow channel width can each contribute to high flow energy of a river reach. In general, we found that areas with high flow energy stayed open the longest, and areas with low energy and braided reaches tended to develop an ice cover earlier. Freeze-up typically begins with the development of border ice along banks. This ice cover expands laterally over time as skim ice forms or surface ice floes accumulate. High flow velocity can limit both of these processes (Shen 2010). The physical structure of narrower, sinuous, or braided reaches can accelerate the development of a complete ice cover since the border ice has a shorter distance to span and river bends provide jamming points that fill with flowing ice (Chu and Lindenschmidt 2019, Shen 2010). Once an ice front forms, ice floes can then accumulate and fill the open areas upriver. Multiple ice fronts can co-occur along the length of the river.
Interestingly, we found that ice often bridges a narrow high-energy reach below Chitina at Wood Canyon in early winter. The ice front may then advance rapidly upriver through relatively low energy and braided reaches between Chitina and Kenny Lake, and eventually into the higher energy reaches above as the winter progresses. In warmer winters, however, the advance of this ice front is inhibited and some reaches above Willow Creek (including near Copper Center) remain partially open all season.
Conclusions
This research suggests a severely diminishing season of river ice travel on the Copper River due to increasing air temperatures, including delayed or incomplete freeze-up and early break-up. This finding echoes the experiences of local residents who can no longer predictably and safely access hunting and gathering areas, private land, and public land located across the river from their communities (Miller 2023). With projected increases in air temperature, precipitation, and river discharge in this basin over the next century (Valentin et al. 2018), we can expect the duration and the contiguity of the river ice cover to continue to decline, and the activities that depend on the ice cover to be further challenged.
This study also shows geospatial variation in freeze-up and open water occurrence along the river, patterns that appear to be driven by flow energy, channel form, and the bidirectional effects of ice flow and accumulation. By mapping these patterns, we identified potential winter river ice crossing areas and areas prone to open water, which may help improve the accessibility of the landscape and preparedness for inaccessibility and hazardous conditions. In addition, these river characteristics, in conjunction with climate projections, may provide the information needed to anticipate future river ice conditions to help communities plan for and adapt to a changing climate.
Acknowledgements
A technical version of this manuscript was published in Arctic, Antarctic, and Alpine Research (Brown et al. 2023a). Data, map products, and code for this project are freely available (Brown et al. 2023b). This project was supported by the U.S. Department of Interior, National Park Service (P20AC00031), the National Science Foundation Arctic Observing Network and Navigating the New Arctic programs (1836523), NASA Citizen Science for Earth Systems Program (80NSSC21K0858 and 80NSSC22K1915), and the Interdisciplinary Research for Arctic Coastal Environments (InteRFACE) project through the Department of Energy, Office of Science, Biological and Environmental Research Earth and Environment Systems Sciences Division’s Regional and Global Model Analysis (RGMA) program, awarded under contract grant: #89233218CNA000001 to Triad National Security, LLC (Triad).
We thank Allen Bondurant, Caroline Ketron, and Paul Atkinson for maintaining cameras, all the citizen science ice observers, the Fresh Eyes on Ice team, and the NASA GLOBE Observer program. We appreciate the constructive feedback from David Thoma and anonymous reviewers.
References
Bondurant, A., C. Arp, D. Brown, and K. Spellman. 2022.
Alaska river ice phenology camera network, 2019-2022. Arctic Data Center.
Brown, D. R. N., C. D. Arp, T.J. Brinkman, B. A. Cellarius, M. Engram, M. E. Miller, and K. V. Spellman. 2023a.
Long-term change and geospatial patterns of river ice cover and navigability in Southcentral Alaska detected with remote sensing. Arctic, Antarctic, and Alpine Research 55(1): 2241279.
Brown, D., C. Arp, T. Brinkman, B. Cellarius, M. Engram, M. Miller, and K. Spellman. 2023b.
River ice and open water extent from satellite imagery, Copper River Basin, Alaska (1973-2022). Arctic Data Center.
Brown, D. R. N., T. J. Brinkman, G. P. Neufeld, L. S. Navarro, C. L. Brown, H. S. Cold, B. L. Woods, and B. L. Ervin. 2022.
Geospatial patterns and models of subsistence land use in rural Interior Alaska. Ecology and Society 27(2): 23.
Brown, D. R. N., T. J. Brinkman, D. L. Verbyla, C. L. Brown, H. S. Cold, and T. N. Hollingsworth. 2018.
Changing river ice seasonality and impacts on interior Alaskan communities. Weather, Climate, and Society 10(4): 625-640.
Carothers, C., C. Brown, K. J. Moerlein, J. Andrés López, D. B. Andersen, and B. Retherford. 2014.
Measuring perceptions of climate change in Northern Alaska: Pairing ethnography with cultural consensus analysis. Ecology and Society 19(4).
Chu, T. and K. E. Lindenschmidt. 2019.
Effects of river geomorphology on river ice freeze-up and break-up rates using MODIS imagery. Canadian Journal of Remote Sensing 45(2): 176-191.
Cold, H. S., T. J. Brinkman, C. L. Brown, T. N. Hollingsworth, D. R. N. Brown, and K. M. Heeringa. 2020.
Assessing vulnerability of subsistence travel to effects of environmental change in interior Alaska. Ecology and Society 25(1).
Fresh Eyes on Ice (FEI). 2022.
Ice observer, Fresh Eyes on Ice, University of Alaska Fairbanks. Available at: https://obs.feoi.axds.co/observations/ (accessed July 1, 2022)
Global Learning and Observations to Benefit the Environment Program (GLOBE). 2022.
GLOBE Observer, Global Learning and Observations to Benefit the Environment Program, NASA. Available at: https://observer.globe.gov (accessed May 30, 2022)
Herman-Mercer, N., P. Schuster, and K. Maracle. 2011.
Indigenous observations of climate change in the Lower Yukon River Basin, Alaska. Human Organization 70(3): 244-252.
Miller, O. 2023.
Winter travel, access, and changing snow and ice conditions in Alaska’s Copper River basin. Natural Resources Report NPS/WRST/NRR-2023/2508. Fort Collins, Colorado. Also see: Traditional knowledge of changes in winter conditions in Alaska’s Copper River basin, this issue.
Shen, H. T. 2010.
Mathematical modeling of river ice processes. Cold Regions Science and Technology 62(1): 3-13.
Valentin, M. M., T. S. Hogue, and L. E. Hay. 2018.
Hydrologic regime changes in a high-latitude glacierized watershed under future climate conditions. Water (Switzerland) 10(2).
Wolfe, R. J. 2004.
Local traditions and subsistence: A synopsis from twenty-five years of research by the State of Alaska, Technical Paper 284. Alaska Department of Fish and Game.
Last updated: September 5, 2023
