Part of a series of articles titled Weather & Climate.
Article
2020 Weather in Review: Thomas Stone National Historic Site

NPS / D. Lassman
Weather and climate play significant roles in driving both physical and ecological processes. For example, forest stand dynamics and ecology are affected by meteorological and climatological events such as wind, ice storms, and drought. For research and long-term ecological monitoring, weather and climate data provide the potential for correlations to be made with observed physical and ecological pattern data.
This resource brief provides a summary of both historic and current (2020) weather data for Thomas Stone National Historic Site, Maryland (MD). Information in this brief represents county-scale weather data averaged from the county surrounding the park, Charles County, MD. Individual weather station data may vary from what is reported here. Data are available from the National Climate Data Center.
Temperature
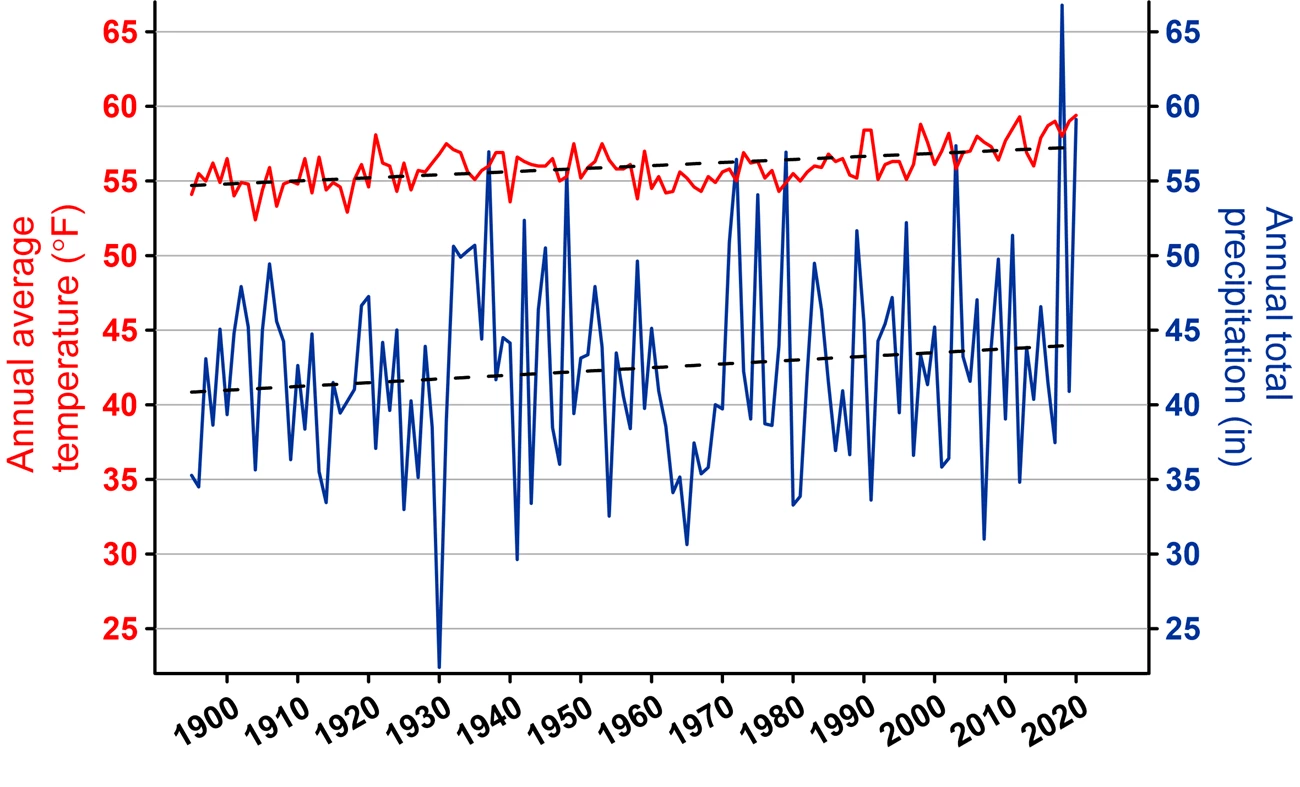
Overall, 2020 was the warmest year on record, with an average temperature of 59.4°F — 3.4 degrees higher than the average annual temperature (Figure 1). Seasonally, summer, autumn and winter fell with “much above normal” temperatures, while spring fell within “near normal” temperatures. Nine months had greater than 2 degrees above the average monthly temperature, including January, February, March, June, July, August, October, November and December, with March having the greatest increase in temperature at 7.0 degrees above average. Only April, May, and September had lower than average monthly temperatures (Table 1).
| Month (2020) | Average temperature (°F) | Departure from long-term average temperature (°F) |
| January | 41.3 | +6.6 |
| February | 43.1 | +6.8 |
| March | 52.0 | +7.0 |
| April | 54.2 | -0.5 |
| May | 62.3 | -2.1 |
| June | 74.9 | +2.2 |
| July | 82.2 | +5.2 |
| August | 78.2 | +2.9 |
| September | 68.6 | -0.4 |
| October | 60.8 | +3.1 |
| November | 53.4 | +6.6 |
| December | 41.4 | +3.7 |
| Annual | 59.4 | +3.4 |
Precipitation
Overall, 2020 was the 2nd wettest year on record with a total of 59.12 inches of precipitation (Figure 2, Table 2). Seasonally, summer and autumn had precipitation levels “much above normal” amounts. Spring was at “near normal” levels while winter fell to a “below normal” level. Eight of the months had higher average monthly precipitation averages, while four had lower. August was the wettest month at 7.93 inches above average, and March was the driest month at -1.44 inches below average.
| Month (2020) | Total precipitation (in) | Departure from long-term average precipitation (in) |
| January | 3.07 | -0.10 |
| February | 2.92 | +0.09 |
| March | 2.15 | -1.44 |
| April | 5.37 | +2.03 |
| May | 3.21 | -0.67 |
| June | 2.70 | -1.25 |
| July | 5.37 | +1.09 |
| August | 12.24 | +7.93 |
| September | 5.80 | +2.16 |
| October | 5.27 | +2.05 |
| November | 5.77 | +2.92 |
| December | 5.25 | +2.01 |
| Annual | 59.12 | +16.83 |
Temperature and Precipitation Trends (1895–2020)
Temperature and precipitation data are gathered from the U.S. Climate Divisional Database, which stores data from January 1895 through 2020, and can be accessed via the National Oceanic and Atmospheric Administration’s (NOAA) National Centers for Environmental Information (NCEI) website (Figure 3). Users can choose different geographic scales (i.e., global, national, statewide), different temporal scales, and display them in various types of graphical formats. Temperature and precipitation data presented in this brief are for Charles County, MD.
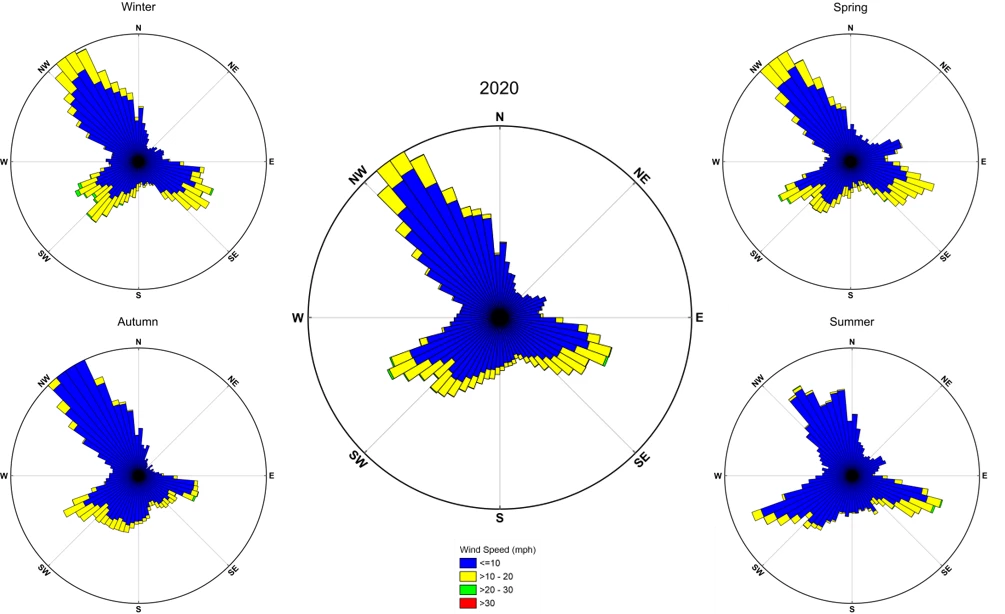
Wind
Wind can impact forest conditions differently depending on wind speed (blow-overs, breakage, root damage) and direction (physiological processes, growth). Wind data are collected from a NOAA weather station located in Dahlgren, VA, and made available through NOAA’sTides and Currents website (Figure 4).
Last updated: March 24, 2021