Part of a series of articles titled Weather & Climate.
Article
2020 Weather in Review: Fire Island National Seashore

NPS/Baranowski
Weather and climate play significant roles in driving both physical and ecological processes. For example, the active processes that shape the North Atlantic coastline are largely the result of meteorological events such as wind-driven waves. For research and long-term ecological monitoring, weather and climate data provide the potential for correlations to be made with observed physical and ecological pattern data.
This resource brief provides a summary of both historic and current (2020) weather data for Fire Island National Seashore (FIIS), New York (NY). Information in this brief represents county-scale weather data averaged from the county surrounding the park, Suffolk County, NY. Because tide levels and wind can be significant for coastal parks, the annual water level and wind data are included. Individual weather station data may vary from what is reported here. Data are available from the National Climate Data Center.
Temperature
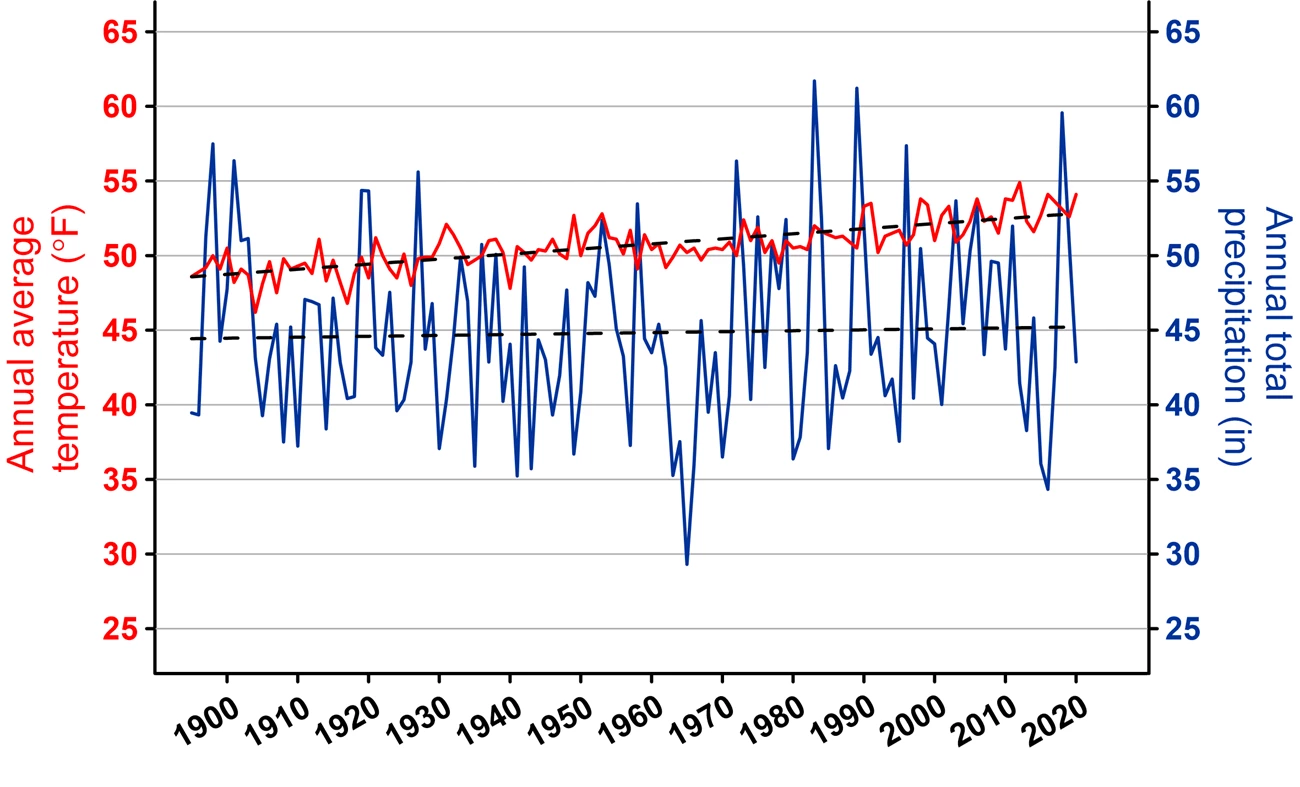
Overall, 2020 was the 2nd warmest year on record with an average temperature of 54.1 °F — 3.4 degrees above average (Figure 1). Spring fell within “near normal” temperatures, while summer, autumn, and winter seasons fell within “much above normal” temperatures. The warmest month was July with an average of 76.5 degrees — 4.3 degrees above the monthly average. Ten out of twelve months had higher temperatures than average, with only April and May having tempertatures below average (Table 1).

| Month (2020) | Average temperature (°F) | Departure from long-term average temperature (°F) |
|---|---|---|
| January | 36.8 | +7.0 |
| February | 37.2 | +7.0 |
| March | 44.0 | +6.3 |
| April | 45.9 | -1.1 |
| May | 56.4 | -0.8 |
| June | 69.3 | +2.9 |
| July | 76.5 | +4.3 |
| August | 74.3 | +3.4 |
| September | 66.2 | +1.6 |
| October | 56.3 | +2.1 |
| November | 48.9 | +5.0 |
| December | 37.3 | +3.1 |
| Annual | 54.1 | +3.4 |
Precipitation
Overall, 2020 was the 51st driest year on record with a total of 42.88 inches of precipitation (Figure 2, Table 2). Seasonally, autumn fell within “much above normal” levels, while winter, spring and summer fell within “below normal” levels. Seven months had less than average precipitation including May which had the least at 1.65 inches — 2.05 inches below average. December had the highest amount of precipitation at 5.76 inches — 1.68 inches above average.

| Month (2020) | Total precipitation (in) | Departure from long-term average precipitation (in) |
|---|---|---|
| January | 1.90 | -1.75 |
| February | 3.32 | -0.15 |
| March | 3.91 | -0.34 |
| April | 4.43 | +0.53 |
| May | 1.65 | -2.05 |
| June | 2.14 | -1.23 |
| July | 3.68 | +0.28 |
| August | 2.90 | -1.04 |
| September | 2.67 | -0.88 |
| October | 5.46 | +1.81 |
| November | 5.06 | +1.19 |
| December | 5.76 | +1.68 |
| Annual | 42.88 | -1.94 |
Temperature and Precipitation Trends (1895–2020)
Temperature and precipitation data are gathered from the U.S. Climate Divisional Database, which stores data from January 1895 to the present, and can be accessed via the National Oceanic and Atmospheric Administration’s (NOAA) National Centers for Environmental Information (NCEI) website (Figure 3). Users can choose different geographic scales (i.e., global, national, statewide), different temporal scales, and display them in various types of graphical formats. Temperature and precipitation data presented in this brief are for Suffolk County, NY.
Wind
Wind data (wind speed and direction) was collected from the NOAA National Water Level Observation Network (NWLON) station 8531680, located at Sandy Hook, NJ. Wind data for the bay side of FIIS was not collected or reported in 2020 due to non-functioning weather stations or buoys in Great South Bay. Each direction is divided up into categories called bins that are color coated to represent the frequency of a certain wind speed. The length of the bin represents the number of times wind comes from a given direction as well as the speed of the wind. The longer the length of the bin, the more frequent the given speed was recorded (Figure 4).

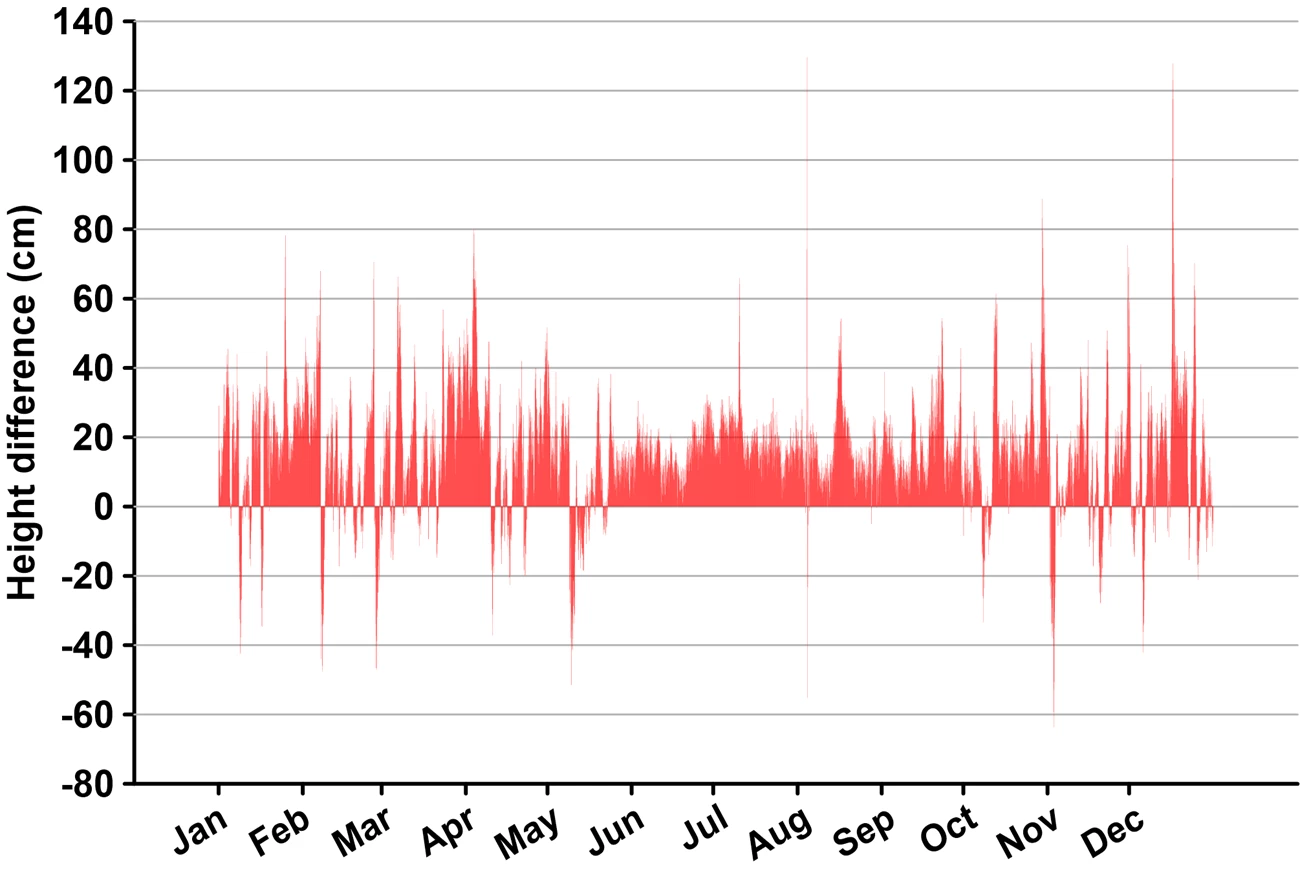
Tide Levels
Water level data for the ocean side of FIIS was also collected from the NOAA NWLON station 8531680 located at Sandy Hook, NJ. Water level data for the bay side of FIIS was not collected or reported in 2020 year due to non-functioning weather stations or buoys in Great South Bay.
The data is graphed to show the difference in the predicted tide level verses what was observed (Figure 5). The offsets in height reflect the effect from storm surge on the normal, astronomically driven tide level.
Last updated: May 13, 2021