Part of a series of articles titled Weather & Climate.
Article
2020 Weather in Review: Colonial National Historical Park

NPS/Baranowski
Weather and climate play significant roles in driving both physical and ecological processes. For example, the active processes that shape the North Atlantic shoreline are largely the result of meteorological events such as wind-driven waves. For research and long-term ecological monitoring, weather and climate data provide the potential for correlations to be made with observed physical and ecological pattern data.
This resource brief provides a summary of both historic and current (2020) weather data for Colonial National Historical Park (COLO), Virginia (VA). Information in this brief represents county-scale weather data averaged from all of the counties surrounding the park units. These counties include James City and York counties, VA. Because tide levels and wind can be significant for coastal parks, the annual water level and wind data are included. Individual weather station data may vary from what is reported here. Data are available from the National Climate Data Center.
Temperature
James City County
Overall, 2020 was the 2nd warmest year on record, with an average temperature of 61 °F — 2.4 degrees higher than the average annual temperature (Figure 1). Seasonally, summer, autumn, and winter fell within “much above normal” temperatures, while spring fell within “below normal” temperatures. Nine out of twelve months had higher than average monthly temperatures, with March having the greatest increase in at 6.9 degrees above average. Only April, May, and September had lower than average monthly temperatures (Table 1).

| Month (2020) | Average temperature (°F) | Departure from long-term average temperature (°F) |
|---|---|---|
| January | 43.8 | +5.2 |
| February | 45.5 | +5.4 |
| March | 54.9 | +6.9 |
| April | 56.8 | -0.1 |
| May | 64.0 | -2.3 |
| June | 75.0 | +0.8 |
| July | 82.6 | +4.3 |
| August | 79.4 | +2.8 |
| September | 70.3 | -0.6 |
| October | 63.2 | +3.2 |
| November | 54.8 | +5.3 |
| December | 42.2 | +1.5 |
| Annual | 61.0 | +2.4 |
York County
Overall, 2020 was the 4th warmest year on record, with an average temperature of 61.4 °F — 2.6 degrees above the average annual temperature (Figure 2). Seasonally, summer, autumn, and winter fell within “much above normal” temperatures, while spring fell within “below normal” temperatures. Ten out of twelve months had higher than average monthly temperatures, with March having the greatest increase in temperature at 6.9 degrees above average. Only May and September had lower than average monthly temperatures (Table 2).

| Month (2020) | Average temperature (°F) | Departure from long-term average temperature (°F) |
|---|---|---|
| January | 44.4 | +5.4 |
| February | 46.0 | +5.7 |
| March | 55.0 | +6.9 |
| April | 56.9 | +0.1 |
| May | 64.1 | -2.1 |
| June | 75.1 | +0.9 |
| July | 82.8 | +4.4 |
| August | 79.6 | +2.8 |
| September | 70.9 | -0.3 |
| October | 63.6 | +3.1 |
| November | 55.3 | +5.3 |
| December | 42.9 | +1.7 |
| Annual | 61.4 | +2.6 |
Precipitation
James City County
Overall, 2020 was the wettest year on record with a total of 69.78 inches of precipitation (Figure 3, Table 3). Seasonally, winter, spring, and autumn fell within “above normal” levels of precipitation while summer and autumn fell within “much above normal” levels. Eight of twelve months had a higher than average monthly precipitation levels, with August having the highest at 11.75 inches — 6.93 inches above average. May was the driest month with 3.14 inches — 0.76 inches below average.

| Month (2020) | Total precipitation (in) | Departure from long-term average precipitation (in) |
|---|---|---|
| January | 3.31 | -0.09 |
| February | 4.93 | +1.76 |
| March | 3.49 | -0.39 |
| April | 5.01 | +1.70 |
| May | 3.14 | -0.76 |
| June | 6.08 | +1.87 |
| July | 4.79 | -0.42 |
| August | 11.75 | +6.93 |
| September | 10.15 | +6.23 |
| October | 6.19 | +2.98 |
| November | 4.54 | +1.70 |
| December | 6.40 | +3.10 |
| Annual | 69.78 | +24.62 |
York County
Overall, 2020 was the wettest year on record, with 67.79 inches of precipitation (Figure 4, Table 4). Seasonally, winter and spring fell within “above normal” levels of precipitation while summer and autumn fell within “much above normal” levels. Nine of twelve months had a higher than average monthly precipitation levels, with August having the highest at 11.31 inches — 6.43 inches above average. May was the driest month with 3.19 inches — 0.60 inches below average.

| Month (2020) | Total precipitation (in) | Departure from long-term average precipitation (in) |
|---|---|---|
| January | 3.28 | -0.10 |
| February | 4.94 | +1.69 |
| March | 3.94 | +0.06 |
| April | 4.77 | +1.50 |
| May | 3.19 | -0.60 |
| June | 5.88 | +1.76 |
| July | 4.24 | -1.05 |
| August | 11.31 | +6.43 |
| September | 9.41 | +5.48 |
| October | 5.37 | +2.16 |
| November | 5.33 | +2.50 |
| December | 6.13 | +2.82 |
| Annual | 67.79 | +22.65 |
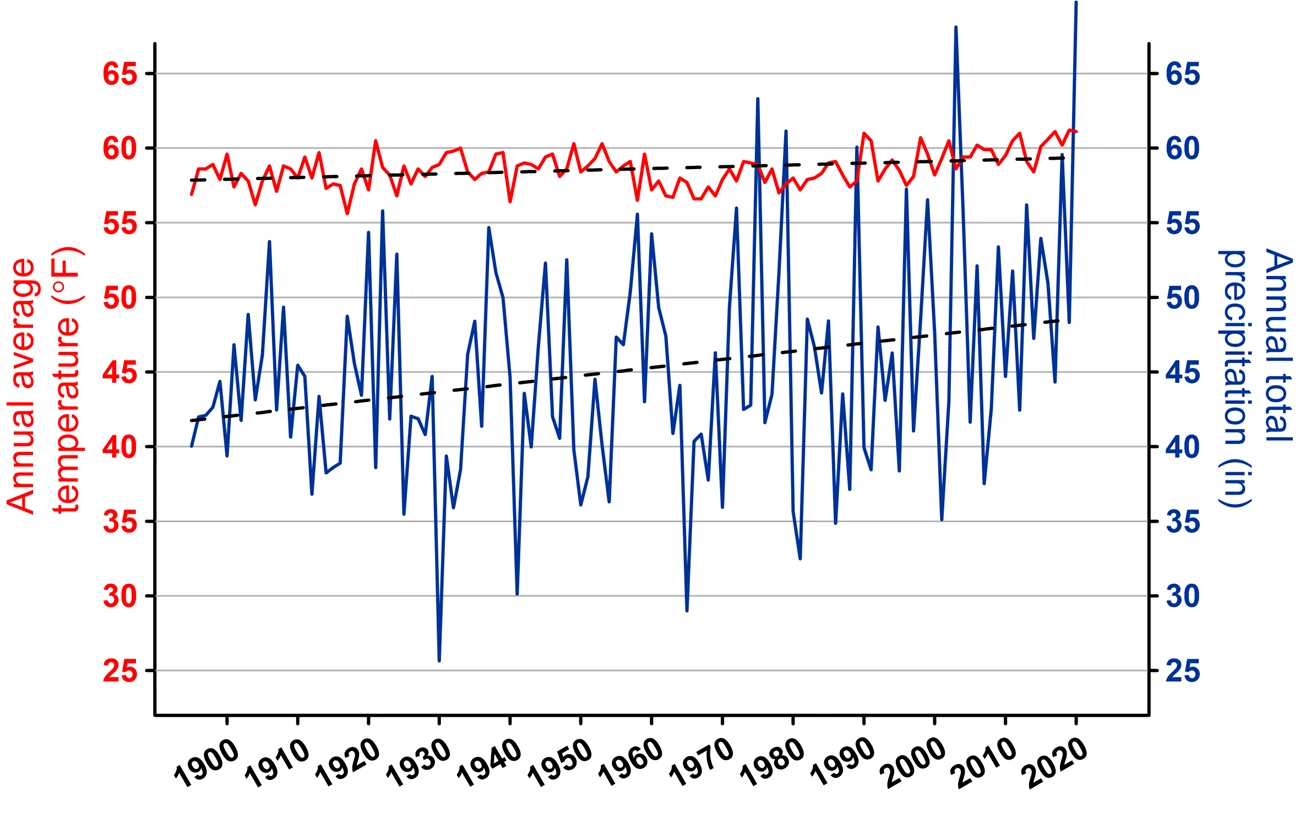
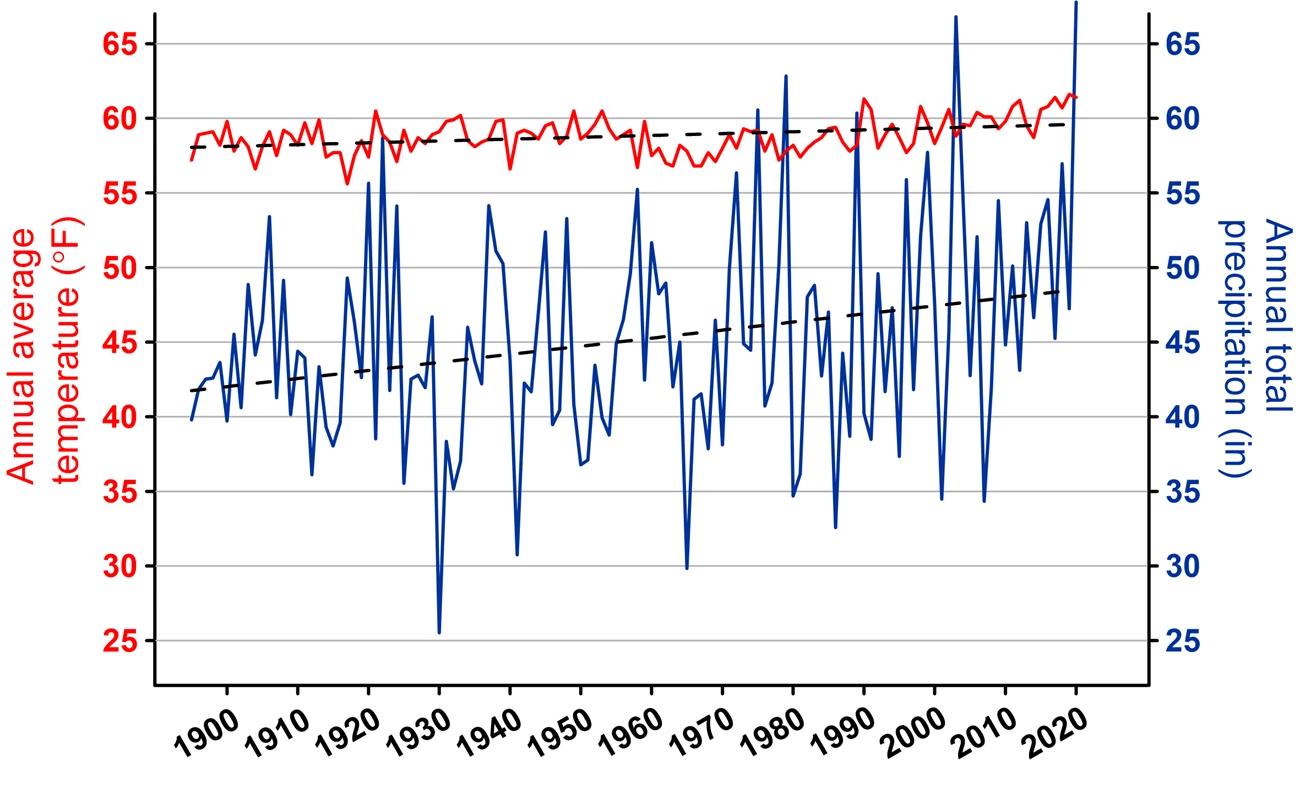
Temperature and Precipitation Trends (1895–2020)
Temperature and precipitation data are gathered from the U.S. Climate Divisional Database, which stores data from January 1895 through 2020, and can be accessed via the National Oceanic and Atmospheric Administration’s (NOAA) National Centers for Environmental Information (NCEI) website (Figures 5 and 6). Users can choose different geographic scales (i.e., global, national, statewide), different temporal scales, and display them in various types of graphical formats. Temperature and precipitation data presented in this brief are for James City and York Counties, VA.
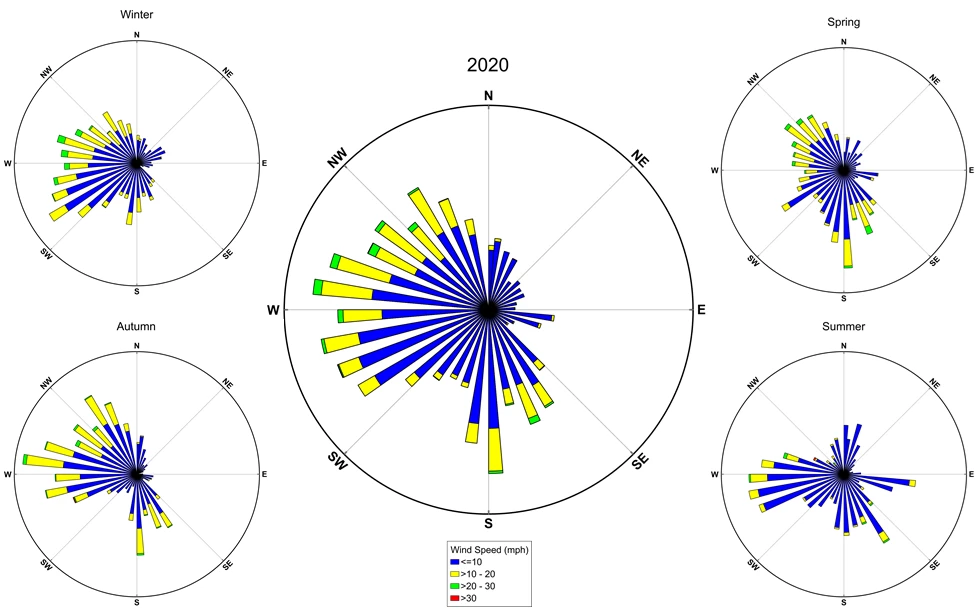
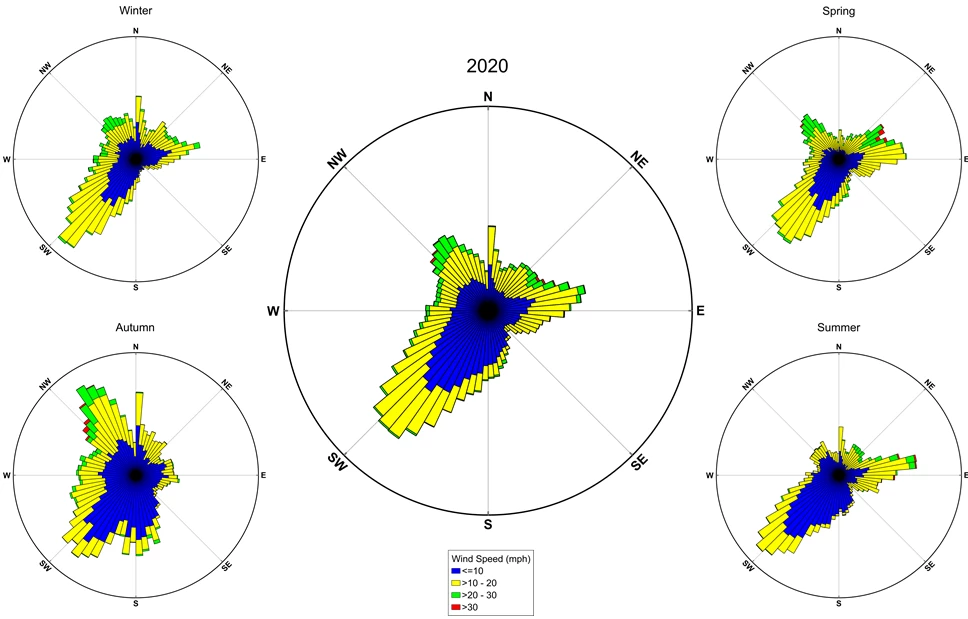
Wind
Wind-generated waves can impact shorelines differently depending on wind speed and direction. Wind data are collected from a weather station at Williamsburg Jamestown Airport, VA, and made available through NOAA’s NCEI website (Figure 7), and at NOAA’s National Water Level Observation Network (NWLON) station 8637689, located at the Yorktown USCG Training Center, VA (Figure 8). Each direction is divided into categories called bins that are color coated to represent the frequency of a certain wind speed. The length of the bin represents the number of times wind comes from a given direction as well as the speed of the wind. The longer the length of the bin, the more frequent the given speed was recorded.
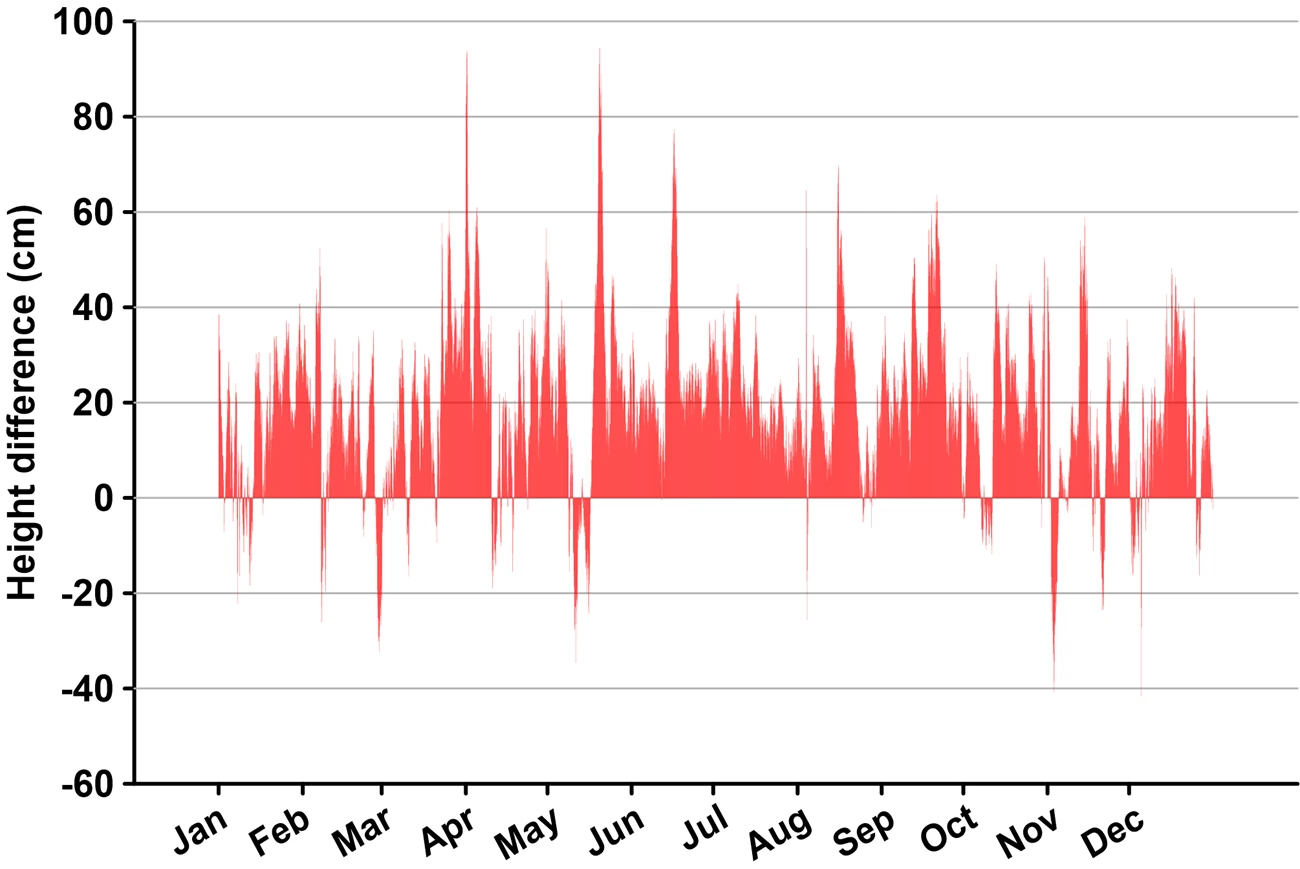
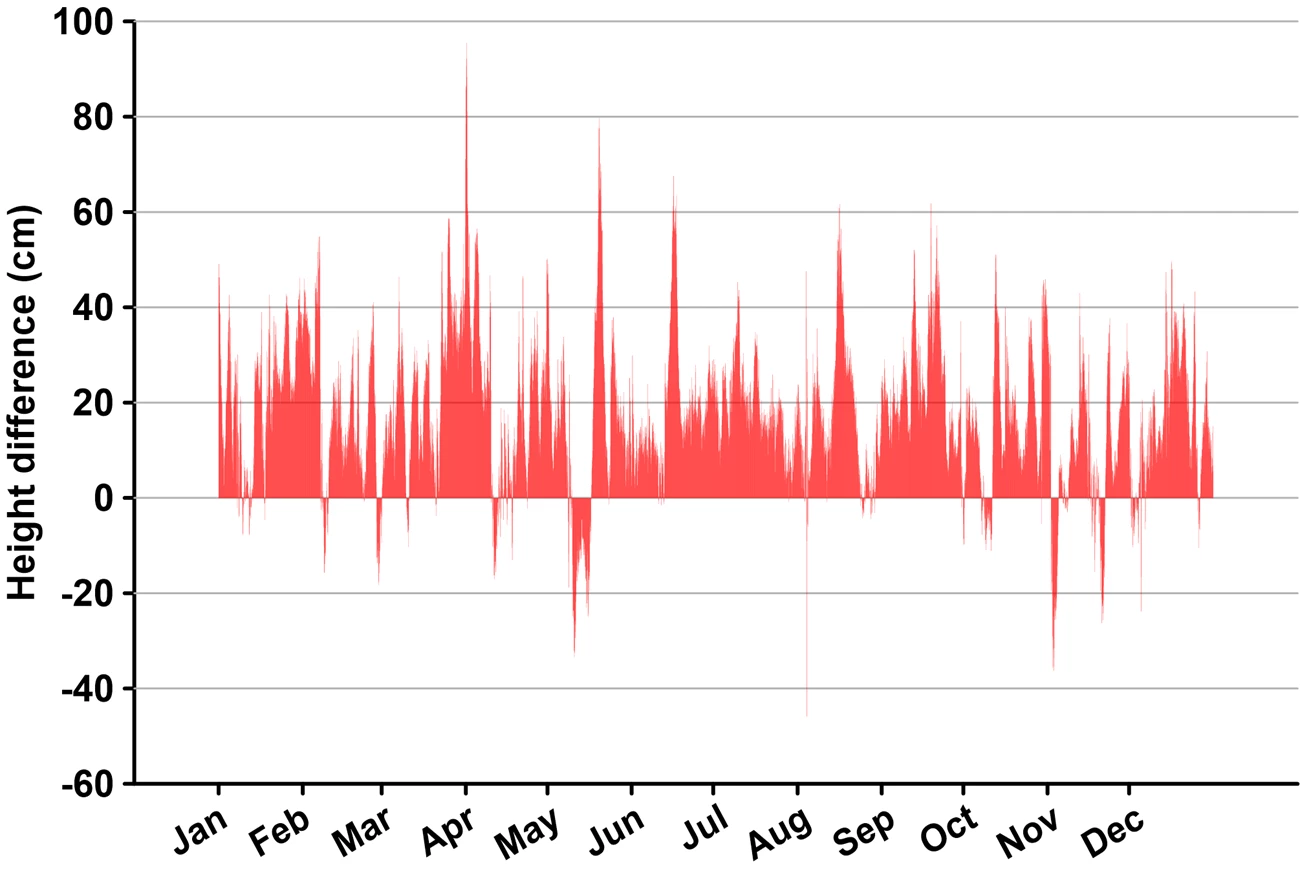
Tide Levels
The extent of Colonial National Historical Park’s shoreline falls along the James and York Rivers, and each has unique tidal characteristics. Therefore, two sources of water level data are used to reflect this dynamic. Water level data are obtained from NOAA station 8637712 located at Jamestown Ferry Wharf, VA, and from NOAA station 8637689 located at the Yorktown U.S. Coast Guard (USCG) Training Center, VA. The station at Jamestown Ferry Wharf began collecting data in 2010, while the station at USCG Training Center has records dating back to 2004.
The data are graphed to show the difference in the predicted tide level versus what was observed (Figures 9 and 10). The offsets in height reflect the effect of storm surge on the normal, astronomically driven tide level.
Last updated: March 26, 2021