Overview
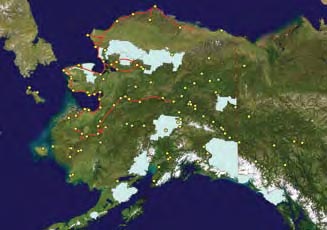
The Permafrost/Active Layer Moni-toring Program is an ongoing project which builds on work begun in 2005 to establish long-term permafrost and active layer monitoring sites adjacent to schools in Alaska and in the circumpolar perma-frost region. Monitoring stations in Alaska are located in communities near national parks and their headquarters, such as Kotzebue, Nome, Fairbanks, Eagle, Circle, Northway, Glennallen, Healy, Cantwell, Anaktuvuk Pass, Noatak, Shishmaref, Ambler, Kiana, and Igiugig. Currently, there are 120 schools in Alaska involved in the project including also Denali National Park and Preserve. The project has both a scientific and outreach component. The monitoring sites collect temperature data on permafrost and the length and depth of the active layer (the layer above the perma-frost that thaws during summer and freezes again during winter).
Most of the monitoring sites are located in remote communities, where the majority of residents depend on a subsistence lifestyle. Changes in climate, length of seasons, and permafrost condi-tions directly impact natural resources and subsistence activities. Changes in permafrost conditions also affect local ecosystems and hydrological regimes, and can influence the severity of natural disasters. In addition to extending our knowledge of the arctic environment, the program involves school-age students in hopes of inspiring a new generation of scientists to continue this study.
K. Yoshikaw
The data gathered from these stations are shared with other schools and made available to the public through our web site (http://www.uaf.edu/permafrost). The data contribute to several widely used science databases, including the perma-nent archive at the National Snow and Ice Data Center in Boulder, Colorado. In addition to working with local borehole data, teachers can compare their data with that from other participating schools at the website. Through this project, students in remote communities learn more about science in a way that is meaningful to their daily lives. In addition, they experience research participation within a larger scientific community, expanding their worldview. This project involves more than 10,000 students and 500 teachers across Alaska.
As part of this project, specialists in outreach education are developing a classroom lesson unit, Permafrost/Active Layer in Alaska, which will be included in a movie series titled “Tunnel Man.”
The Science
Permafrost regions occupy about one-quarter of Earth’s land surface. Permafrost is one of the most impor-tant components of the arctic terrestrial system, and this physical element of the landscape is one of the most sensitive to climatic change. Therefore, observing the interactions between permafrost and other components of the arctic system (climate, hydrology, biogeochemistry, vegetation), especially during a period of possible climatic warming, is among the most important aspects of arctic research. The changing properties of permafrost play an important role in driving the ecosystem balance, as well as affecting carbon and water cycles (Oechel et al. 2000). Additionally, man-made structures built on or near ice-rich permafrost can suffer severe damage from thaw-induced ground settling, which will accelerate if mean annual temperatures continue to rise (Osterkamp et al. 2000, Romanovsky and Osterkamp 2001).
Within the sensitive permafrost region, the discontinuous permafrost zone is the most likely to respond to climatic warming. Most national parks in Alaska are located in this zone. Throughout the circumpolar North, the boreal forest widely overlaps the area of discontinuous permafrost (Péwé 1975). Thermal condi-tions of discontinuous permafrost are quite unstable, as the ground is close to thawing, with temperatures often hovering at 30°F (-1°C) or warmer.
The table in Figure 4 is an overview of the principal permafrost monitor-ing programs in the circumpolar North, with major findings and results summarized. Most notable is the evidence of a warming trend, even with few permafrost monitoring sites.
For maintenance purposes and educational outreach, the majority of our monitoring sites are located at or near schools or national park headquarters (Figure 1). This allows easier accessibility to equipment, provides educational oppor-tunities by involving students and teachers in research, and facilitates data collection.
K. Yoshikawa
Classroom Activities and Lessons
The classroom activities developed for the Permafrost/Active Layer Monitoring Program are differentiated by age group. The program offers teachers unique opportunities to integrate research and education by offering students a chance to work with and learn from experienced permafrost scientists; provides classroom lessons on permafrost and the active layer, an important part of Alaskan geoscience; and distributes by DVD and Internet an entertaining educational movie series called “Tunnel Man.” Educational activities include the following:
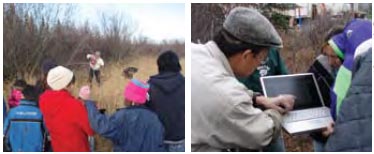
(1) To help students understand permafrost and its impact on the environment, permafrost monitoring sites are established and boreholes are drilled. Scientists introduce the project and guide student discussion, focusing on the question, “Why do we need to monitor permafrost?”
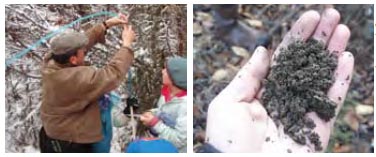
(2) To demonstrate scientific method-ology, design, and fieldwork, frost tubes are installed, data loggers are set up, and scientists calibrate temperature sensors with assistance from students. Students and teachers explore the following questions with scientists’ guidance: “What kind of sensors and instruments are we using?” and “How do these instruments work for us?” We provide teachers with a set of classroom lessons (Figures 5).
K. Yoshikawa
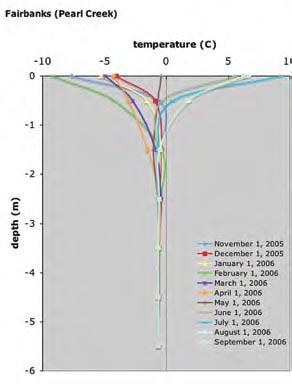
(3) About a year later, during the scientists’ return visit, a second set of lessons is developed in partnership with the teachers and is used to explore the temperature data. After one year of data collection, students use the data to investigate permafrost and frozen ground, climate change impact on permafrost stability, and methods of monitoring changes in permafrost. Teachers download the data and use an Excel spread-sheet to plot monthly profiles, calculate the average temperature for each depth, and estimate active layer thickness. At this point, students focus on the following questions: “What is going on in our village?” and “What is most likely to happen in the future in our village?” (Figures 6-7).
4) A model predicting changes in local permafrost is developed and used by students in the classroom. Students share data, comparing their data with that from different areas all over the world. Our hope is that by this point students will understand many of the issues related to permafrost and how it affects the world around them. Teachers supplement the curriculum with an entertaining and instructional movie, “Tunnel Man.”
(5) For the upper grades and national park visitors, more advanced classroom lectures and demonstrations are available, which offer opportunities for a more com-plex understanding of the interactions between permafrost and climate change. One example of the effects of natural phenomena is the impact of forest (or tundra) fires on permafrost. Fire has a strong impact on permafrost degradation; fires burn away the insulation layer, which changes the thermal condition of the permafrost. Students measure and simulate the impact that wildfires of varying severity can have on permafrost.
Summary
The intellectual merit of this re-search is that it will advance knowledge of our climatic system and the thermal state of permafrost as a complex process that is spatially and temporally quite variable. The arctic climatic system has an important influence on global climate. Monitoring the thermal state of permafrost by measuring borehole temperatures is one of the methods that can be used to understand climatic trends. The degradation of permafrost is triggered by the length of the active layer freezing period; that is, sea-sonal lengths are an important factor. Implicit in many climatic change reports is the desire to develop a sustainable scientific infrastructure to adress needs, among which is the establishment and maintenance of long-term observational networks. The Permafrost/ Active Layer Monitoring Program provides opportuni-ties for field experience and educational participation at levels ranging from elementary school to high school. It will help to provide high-resolution spatial distribution of the thermal state of permafrost, especially in Alaska, and will improve the general knowledge of Earth’s climatic pattern. It also offers an opportunity for students to take part in understanding climatic systems. This project highlights the interaction between permafrost, the active layer, hydrology, and the arctic climate system, and provides a strong educational outreach program involving remote communities.
References
Oechel, W.C., g.L. Vourlitis, S.J. Hastings, R.C. Zulueta, L.D. Hinzman, and D.L. Kane. 2000.
Acclimation of ecosystem CO2 exchange in the Alaskan Arctic in response to decadal climate warming. Nature 406: 978-981
Osterkamp, T.e., L. Viereck, Y. Shur, M.T. Jorgenson, C. Racine, A. Doyle, and R.D. Boone. 2000.
Observations of thermokarst and its impact on boreal forests in Alaska, USA. Arctic, Antarctic, and Alpine Research 32: 303-315.
Pavlov, A.V. 1994.
Current changes of climate and permafrost in the Arctic and Sub-Arctic of Russia. Permafrost and Periglacial Processes 5: 101-110.
Péwé, T.L. 1975.
Quaternary Geology of Alaska. US Geological Survey Professional Paper 835.
Romanovsky, V.e., and T.e. Osterkamp. 2001.
Permafrost: Changes and impacts. In: Permafrost Response on Economic Development, Environmental Security and Natural Resources, edited by R. Paepe and V. Melnikov. Kluwer Academic Publishers. Pages 297-315.
Romanovsky, V., M. Burgess, S. Smith, K. Yoshikawa, and J. Brown. 2002.
Permafrost temperature records: Indicators of climate change. EOS, AGU Transactions 83(50): 589-594.
Part of a series of articles titled Alaska Park Science- Volume 8 Issue 1: Connections to Natural and Cultural Resource Studies in Alaska's National Parks.
Last updated: August 10, 2016
