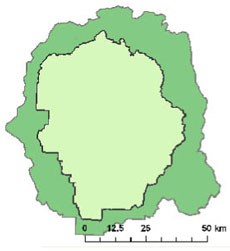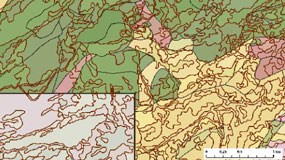

What Is a Vegetation Map? A vegetation map is just what it sounds like: a map that depicts vegetation. A vegetation map is critical information for any land manager, whether the land is managed for agriculture or forestry or recreation, and is relevant to just about every issue a land manager has to face. It provides an in-depth look at plant communities as they relate to elevation, geology, topography, and soils. This baseline data is valuable information to park managers for managing forests, watershed, wildlife, and fire, among other things. A vegetation map of Yosemite National Park and lands immediately adjacent to the park has recently been completed. This Geographic Information System (GIS) project was initiated in 1997. It replaces the vegetation map developed in the 1930s and views vegetation as ecological communities instead of clumps of large trees. For instance, areas mapped in the 1930s as ponderosa pine are mapped today as ponderosa pine with mountain misery, or with shrubs, or with grass, or with no understory (leaf litter). Ecologically, these different types of ponderosa pine communities behave differently. 
How Was the Vegetation Creation of the vegetation map was a complex process, with many phases, through GIS. The vegetation of the project area is incredibly diverse due to changes in elevation, and diverse bedrock, soil types, and moisture regimes within the area: grasslands and chaparral in the west, forests in the mid-elevations, alpine zones in the high elevations, and sagebrush communities in the east. The first phase was to acquire custom aerial photography for the area to be mapped. More than 1,500 photos were taken, and each one had to be individually analyzed. Later phases included delineating polygons (areas) of distinct vegetation types, establishment of ecological plots to relate the aerial photographs to on-the-ground data, development of a classification scheme to assign names to those polygons, and accuracy assessment of the final product. There were 220 types identified over 1.4 million acres as map possibilities, although not all are vegetation types. The vegetation map of Yosemite is a multi-agency project. (See specifics below.) How Will the Vegetation Map Be Used? The vegetation map has many applications for resource managers including:
Learn More about GIS: GIS is used by Yosemite National Park scientists to document the locations of many different types of features--allowing specialists to create, edit, display, and analyze locations of point-, line-, or polygon-type features. 
Institute, Aerial Information Systems, California Native Plant Society, California Department of Fish & Game, The Nature Conservancy, and Nature Serve. |
Last updated: August 22, 2023
