|
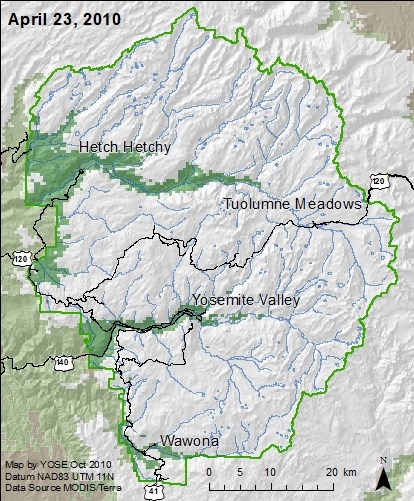
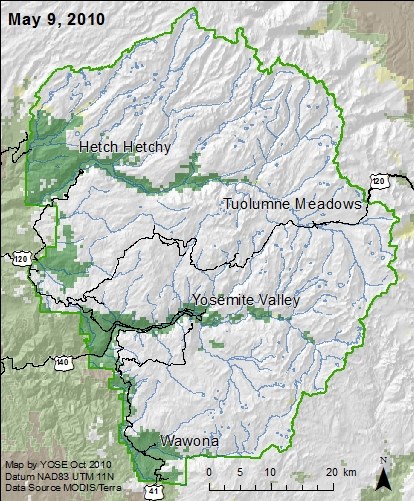
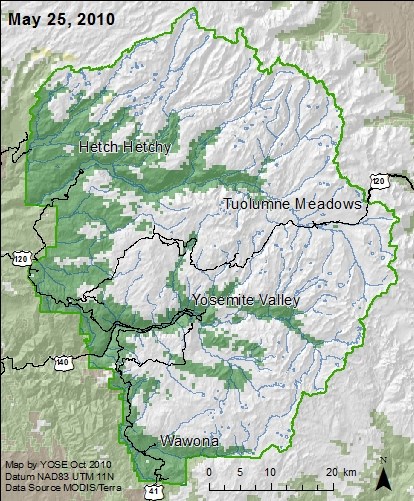
2011 Spring Peak: Merced River peaked at 10.43 feet on June 16. View how Yosemite National Park's snow cover melts throughout a spring season. The following 2010 series of six graphics shows changes in snow-covered areas. In Yosemite and surrounding mountains, most precipitation falls during the winter months as snow that accumulates above 6,000 feet (1,830 meters), making a natural water tower that slowly melts and releases water during the spring and early summer. The area of snow cover shown in each figure represents maximum extent of snow during eight days--including and following the date shown on each figure. Snow-cover data are distributed free of charge by the National Snow and Ice Data Center (NSIDC) and are derived from daily imagery provided by the MODIS sensor on NASA's Terra satellite, one of three satellites in NASA's Earth Observing System (EOS). 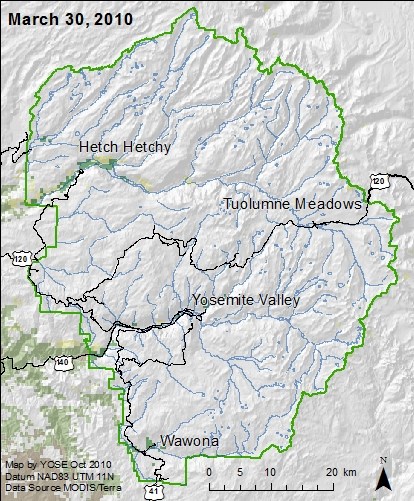
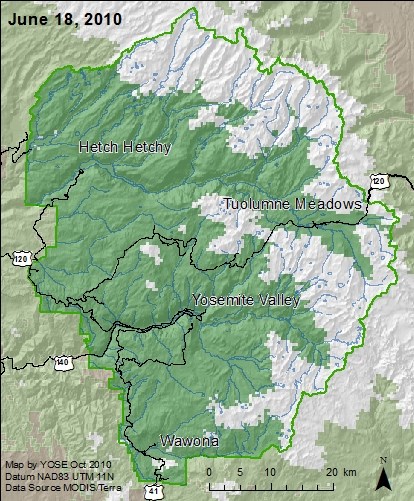
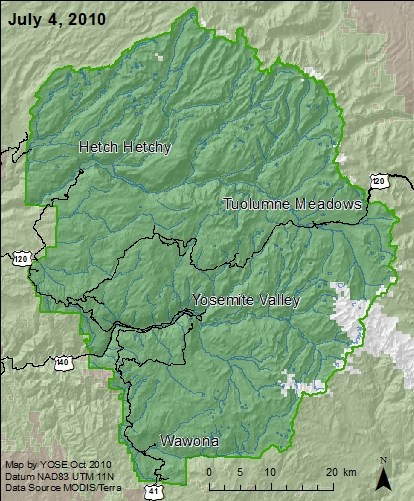

Data Source: Hall, D.K., G.A. Riggs, and V.V. Salomonson. 2000, updated weekly. MODIS/Terra Snow Cover 8-Day L3 Global 500m Grid V004 , January to March 2003. Boulder, CO, USA: National Snow and Ice Data Center. Digital media. |
Last updated: March 1, 2015