
|
Geological Survey Professional Paper 1044—C
The Waters of Hot Springs National Park, Arkansas—Their Nature and Origin |
CHARACTER OF THE SPRING AND WELL WATERS IN THE HOT-SPRINGS AREA
PHYSICAL QUALITY
FLOW OF THE HOT SPRINGS
Flow of the hot springs has been measured at infrequent intervals by several investigators. The first to attempt measurements was William Dunbar, of the Dunbar and Hunter expedition, in 1803, who measured only the largest springs. In 1860, Glasgow determined the hot-springs flow to be 450,480 gal/d (1.97 x 10⁻² m3/s). Probably the first accurate measurement of the total spring flow was made by Weed (1902). Weed, after measuring or estimating the flow of each spring, found the total flow to be 850,000 gal/d (3.72 x 10⁻² m3/s). The flow of all but a few of the hot springs is piped into a central collecting reservoir. Hamilton, in Hamilton and Blood (1931), calculated the maximum rate of filling of the central collecting reservoir to be 960,000 gal/d (4.21 x 10⁻² m3/s). Park Superintendent Libbey, in 1945, recorded that the central collecting reservoir filled with 15 ft (4.57 m) of water in 7 hours, which represents an average flow of 800,000 gal/d (3.50 x 10⁻² m3/s).
The volume of the reservoir per unit change in depth is known and provides a means for periodic calculation of spring flow. One large spring emerges at the bottom of the reservoir. The flow of this spring decreases as the depth of water in the reservoir increases. Also, at depths greater than 16 ft (4.88 m), overflow occurs. Flow calculations are thus made during the filling cycle at depths less than 16 ft (4.88 m). In addition, to avoid variable effect of depth in the reservoir on the flow of springs in the reservoir, the flow calculations are adjusted to a depth of 15 ft (4.57 m) by means of a depth-versus-flow rating curve.
A hydrograph of the average of calculations of monthly flow since September 1970 is shown in figure 3. Spring discharge has ranged from 750,000 gal/d (3.29 x 10⁻² m3/s) to about 950,000 gal/d (4.16 x 10⁻² m3/s). Fluctuations of spring discharge follow a seasonal cycle during the year; discharge is high in the winter and spring and is low in the summer and fall. One would expect the flow of an individual spring to fluctuate seasonally, as does the total spring flow. The flow of the lower display spring (number 32) is shown by hydrograph in figure 3.

|
| FIGURE 3.—Temperatures and flows of the hot springs. |
In addition to seasonal changes in flow, individual springs show long-term changes in flow. Some springs have ceased to flow and new springs have emerged during the last 170 years. These long-term changes in spring flow have not been systematically documented; many changes have doubtlessly passed, unrecorded. Measurements of Weed (1902), Hamilton (1932), and the present study afford samples for comparisons of long-term variations.
Many changes in individual spring flow occurred between 1901 and 1931 because of excavation and construction at spring outlets, opening new springs, and drilling the Fordyce well (fig. 2). Hamilton noted that the flow of springs in group 1, which includes those at higher elevations, declined in flow from 168,000 gal/d (736 x 10-3 m3/s), in 1901, to 124,000 gal/d (5.43 x 10⁻³ m3/s), in 1931 (table 2).
TABLE 2.—Flows of the hot springs in group 1
in 1901 and 1931
[From Hamilton, 1932]
| Spring number | Flow, in gallons per day | |
| 1901 | 1931 | |
| 11 | 28,800 | 9,600 |
| 3, 5, and 8 | 39,218 | 21,800 |
| 7 | 18,516 | 1,760 |
| 10 | 18,514 | 14,400 |
| 22 | 1,723 | 2,460 |
| 23 and 24 | 10,800 | 5,000 |
| 26 | 25,847 | 10,950 |
| 27, 28, and 29 | 24,418 | (1) |
| 47 and 48 | Nonexistent | 13,500 |
| 49 | do | (1) |
| Maurice Spring | do | (1) |
| New | do | 2,400 |
| Total | 167,836 | ~124,000 |
1Not measured individually. | ||
Another group of springs, at lower elevations along the base of a tufa cliff, Showed practically no change in flows from 1901 to 1931. These springs (numbers 2, 4, 6, 9, 11, 13, 15, 17, 19, and two unnumbered springs) discharged 313,500 gal/d (1.37 x 10⁻² m3/s) in 1901 and 315,00 gal/d (1.35 x 10⁻² m3/s) in 1931.
Thirteen springs that were measured by Weed in 1901 were not included in the 1931 collection system described by Hamilton (1932). Two of these springs are on the Arkansas Rehabilitation Center, one of which, number 39, is used for supplying hot water to the Rehabilitation Center. Four springs measured in 1901 were not flowing in 1931. Locations of six springs were unknown in 1931. Presumably, these six springs were nonexistent or had insignificant flows in 1931.
Hamilton lists five springs in his 1931 collection system that were nonexistent in 1901. Two of these (47 and 48) have declined in flows since 1931, and one (49) is now one of the larger springs in the system.
The collection system has not changed since 1931, and no springs have been excavated nor have hot-water wells been drilled, resulting in a relatively stable period of spring locations. However, changes in flow rates since 1931 have been noted.
Flows of several springs were measured or estimated in 1972 after the springs were uncovered for sampling in January. These measurements showed a general decline of flow in the springs located at higher elevations. In 1972 spring number 1 had a very small or no flow—a decline from 25,500 gal/d (1.26 x 10⁻³ m3/s) in 1901 and 9,600 gal/d (4.21 x 10⁻⁴ m3/s) in 1931. Spring numbers 47 and 45 declined from 13,500 gal/d (5.91 x 10⁻⁴ m3/s) in 1931 to 8,600 gal/d (3.77 x 10⁻⁴ m3/s) in 1972. However, spring number 7 declined from 18,516 gal/d (8.11 x 10⁻⁴ m3/s) in 1901 to 1,760 gal/d (7.71 x 10⁻⁵ m3/s) in 1931, but rose to 2,800 gal/d (1.23 x 10⁻⁴ m3/s) in 1972. Spring number 49, which was nonexistent in 1901, had a flow of 58,000 gal/d (2.54 x 10⁻³ m3/s) in 1972.
TEMPERATURES OF THE HOT-SPRINGS WATER
Temperature measurements were the first scientific data collected at the hot springs. William Dunbar and George Hunter, in 1804, recorded 67.8°C (Celsius) (154.0°F) for the hottest spring (Weed, 1902). In 1860, the highest temperature measured by Owen (1860) was 64.4°C (147.9°F). Glascow (1860) recorded a maximum of 65.6°C (150.1°F). The maximum temperature measured by the Geological Survey, in 1972, was 61.8°C (143.2°F)
Measurements of temperatures of individual springs by several investigators from 1890 to 1953 (table 3) show maximum temperatures of 63.9°C (147.0°F) in 1901, 64.4°C (147.9°F) in 1931, and 63.3°C (145.9°F) in 1952. Thirteen of the same hot springs were measured by Haywood (1902), Hamilton (1932), and Kuroda (1953). The average temperatures of these hot springs when measured in 1901, 1931, and 1952 were 58.2°C (136.8°F) 57.3°C (135.1°F) and 58.9°C (138.0°F) respectively.
TABLE 3.—Temperatures, in degrees Celsius, of the hot springs
| Date of measurement | ||||||
| Spring | 1890 (from Branner, 1892) |
1900 (from Haywood, 1902) |
1901 (from Haywood, 1902) |
1931 (from Hamilton, 1932) |
1952 (from Kuroda, 1953) |
1972 (from present study) |
| 1 | 62.6 | 61.9 | 61.7 | --- | 62.0 | 54.6 |
| 2 | --- | 51.9 | 53.9 | 54.5 | --- | --- |
| 3 | --- | 61.7 | 61.3 | 60.0 | 62.2 | 52.2 |
| 4 | --- | 55.9 | 52.4 | 57.2 | --- | --- |
| 5 | --- | 61.4 | 61.9 | 61.1 | 61.7 | --- |
| 6 | --- | 57.5 | 58.3 | 57.2 | 58.6 | --- |
| 7 | --- | 60.1 | 60.8 | --- | 62.2 | 59.3 |
| 8 | --- | 35.2 | 36.2 | 61.1 | --- | --- |
| 9 | 59.6 | 61.1 | 62.4 | 62.2 | 61.2 | --- |
| 10 | --- | 57.4 | 57.2 | 60.0 | --- | --- |
| 11 | --- | --- | 56.8 | 64.4 | 61.2 | --- |
| 12 | --- | 36.2 | 36.2 | --- | --- | --- |
| 13 | --- | --- | 56.3 | --- | 61.2 | --- |
| 14 | 59.6 | 60.9 | 62.8 | --- | --- | --- |
| 15 | 63.6 | 63.9 | 63.9 | 64.4 | 61.2 | --- |
| 16 | --- | 60.8 | 60.9 | --- | --- | --- |
| 17 | --- | 55.4 | 56.4 | 55.6 | 56.9 | 56.0 |
| 18 | --- | 57.3 | 57.3 | 52.8 | 59.6 | --- |
| 19 | --- | 56.4 | 56.1 | --- | --- | --- |
| 20 | --- | 46.3 | 44.5 | 44.7 | --- | --- |
| 21 | 46.6 | 43.3 | 46.0 | --- | --- | --- |
| 22 | --- | 57.1 | 56.5 | 56.1 | --- | --- |
| 23 | --- | 62.0 | 62.4 | 50.0 | 59.6 | 56.2 |
| 24 | --- | 62.3 | 60.3 | 57.8 | 54.3 | --- |
| 25 | 61.6 | 62.7 | 62.9 | --- | 63.3 | --- |
| 26 | --- | 63.4 | 61.4 | 63.3 | --- | --- |
| 27 | --- | --- | 51.9 | --- | 59.2 | --- |
| 28 | --- | --- | 59.8 | --- | 60.0 | --- |
| 29 | --- | 57.1 | 57.8 | --- | 61.1 | --- |
| 30 | --- | 53.9 | 51.9 | --- | --- | --- |
| 31 | --- | 51.4 | 51.4 | 54.4 | 54.0 | --- |
| 32 | --- | 46.0 | 46.5 | 45.0 | 52.5 | 52.5 |
| 33 | --- | 48.3 | 49.2 | --- | --- | 57.6 |
| 34 | --- | 47.9 | 47.3 | --- | 57.5 | --- |
| 35 | --- | 39.0 | 43.0 | --- | --- | --- |
| 36 | --- | 48.9 | 48.8 | --- | --- | --- |
| 37 | --- | 52.9 | 52.6 | --- | --- | --- |
| 38 | --- | 58.8 | 59.8 | --- | 60.3 | --- |
| 39 | --- | 61.4 | 61.4 | --- | --- | --- |
| 40 | --- | 48.9 | 48.9 | --- | --- | --- |
| 41 | --- | 46.8 | 48.3 | --- | --- | --- |
| 42 | 51.6 | --- | 58.3 | 60.6 | 60.8 | 61.3 |
| 43 | --- | 46.1 | --- | 50.0 | --- | --- |
| 44 | --- | 8.0 | --- | --- | --- | --- |
| 45 | --- | 13.0 | --- | --- | --- | --- |
| 46 | --- | 51.5 | --- | 57.2 | --- | 58.3 |
| 47 | --- | --- | --- | 58.6 | 61.7 | --- |
| 48 | --- | --- | --- | --- | 62.2 | 60.0 |
| 49 | --- | --- | --- | 58.9 | 61.0 | 61.8 |
| 50 | --- | --- | --- | 62.8 | --- | --- |
| Maurice | --- | --- | --- | --- | --- | 53.3 |
These particular data indicate that there has been a slight decline in maximum water temperatures with time (0.6°F in 10 years). These data are not conclusive evidence of a general decline in temperatures, because of differences in samplings points, variations in temperatures with flow rates of individual springs, and temperature fluctuations in spring flows due to air temperature.
Temperature fluctuations of individual springs exhibit an annual cycle that seems to be in response to the annual cycle in air temperature. Graphs of the temperatures of four springs are shown in figure 3. For some springs, short-term fluctuations corresponding to the annual cycle are evident from detailed temperature records. The short-time fluctuations are due to external environmental factors. The Fordyce Spring (Spring No. 46, fig. 2) temperature, for example, responds to such factors as heat-load changes, caused by opening the air-tight seals on the chamber enclosing the spring, and effects of mixing of the hot-springs water with seepage from nearby rainfall.
It would be expected that spring temperature increases with increase in spring flow. This relation has been examined by scatter diagrams drawn between flow and temperature for the display springs. A direct relationship is obscured because the effect of ambient air temperature varies seasonally and the high seasonal air temperature occurs during the period of low spring flow.
SILICA CONCENTRATION AS A TEMPERATURE INDICATOR
The solubilities of silica minerals increase with increase in temperature. Silica minerals dissolve until the solution is saturated many times faster than they precipitate from an oversaturated solution. Thus, a thermal water will dissolve silica minerals as its temperature rises, but as the water cools it will not rapidly lose silica. The silica concentration of water can be used as a measure of the maximum temperature reached by the water (Fournier and Rowe, 196.6).
The actual silica concentration of water depends on the particular silica mineral to which the water is exposed, as well as to the temperature and the rate of dissolution. In the hot-springs system, the main sources of silica are the Bigfork Chert and the Arkansas Novaculite. Chert and novaculite are both composed of chalcedony, a cryptocrystalline quartz, and microcrystalline quartz. The solubilities of chalcedony and quartz (R. O. Fournier, oral commun., 1972) are shown in figure 4.

|
| FIGURE 4.—Variation of dissolved-silica concentration with temperature. |
The analyzed silica concentrations of the samples collected for this study are also shown in figure 4. The cold springs and wells are oversaturated with respect to quartz, but are undersaturated with respect to chalcedony. Though it is likely that complex silica-bearing clays or other minerals influence the silica concentration of these waters, it is also possible that, because of their low temperatures, these waters have not had sufficient time to reach saturation with the chalcedony.
The hot-springs waters have a uniform silica concentration (41-42 mg/L). They are oversaturated with respect to chalcedony at their temperature when collected, but the higher temperature springs approach saturation. The constant silica concentration of the springs, together with the similarities in their other chemical properties, strongly suggests that all the hot springs emanate from a single source having a uniform geothermal environment. From the silica concentration (41.5±0.5 mg/L), the temperature of the source can be calculated as 63.2±0.5°C (145.8±0.9°F) The differences in temperatures of the individual springs are presumably a result of differing flow paths and rates of approach to the surface from their common source.
Silica analyses were made on groups of samples collected in 1901, 1952, and for the present study in 1972. These analyses provide a firmer base from which to judge temperature trends with time. The silica analyses of springs in a given group show less variation than overall spring temperatures. As an indicator of maximum temperature, the silica-computed temperature is not affected by external factors such as air temperature and flow of the springs.
Silica concentrations and maximum temperatures calculated from the silica concentrations (Fournier and Rowe, 1966), as well as maximum temperatures recorded at various times, are shown in the following table.
| Year | Maximum temperature measured (°C) |
Average SiO2 concentration (mg/L) |
Number of springs sampled |
Temperature calculated from SiO2 concentration |
| 1804 | 67.8 | --- | --- | --- |
| 1860 | 64.4 | --- | --- | --- |
| 1860 | 65.6 | --- | --- | --- |
| 1901 | 63.9 | 46.6 | 40 | 68.5 |
| 1931 | 64.4 | --- | --- | --- |
| 1952 | 63.3 | 42.7 | 11 | 64.3 |
| 1972 | 61.8 | 41.7 | 9 | 63.2 |
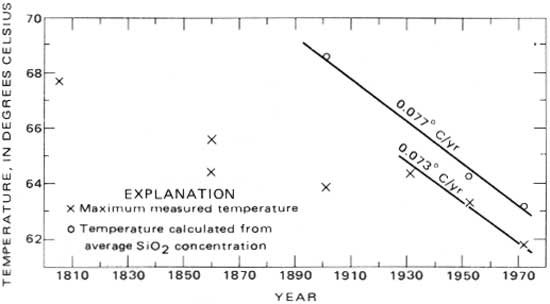
These results are shown graphically in figure 5. According to the silica data, the spring-source temperature has been decreasing at an average rate of about 0.077°C (0.14°F) per year since 1901, although data from 1804 to 1931 indicate a lower rate of decline. Also, measured maximum temperatures from 1931 to 1972—a period in which the springs were undisturbed—have decreased at about the same rate (0.073°C or 0.13°F per year) as the spring-source temperature decline from 1931 to 1972. This coincidence may be a fortuitous circumstance of sample timing and distribution. In addition to reflecting the change in the source temperature, variations in measured temperatures reflect the sampling distribution, seasonal changes in temperature, and changes in temperature because of changes in flow distribution that are due to natural changes in flow distribution or due to man's efforts to enclose and control the springs. Thus, although the temperature observations may be subject to sampling bias, the silica-concentration trend of the hot springs indicates a decline in temperature.
|
| FIGURE 5.—Maximum measured and calculated temperatures of the hot springs. |
TEMPERATURES OF THE COLD SPRINGS AND WELLS
The temperatures of ground water in wells in the vicinity of Hot Springs, other than the hot springs themselves, range from 12.0°C (53.6°F) to 52.8°C (127.0°F) (tables 4, 5; fig. 6). The warmer of these temperatures is the temperature of ground water in the immediate vicinity of the hot springs. The well on the grounds of the Arkansas Rehabilitation Center has a temperature of 52.8°C (127.0°F); the water from a well on the Arlington Hotel lawn, used to supply water to the cooling plant, has a temperature of 32.2°C (90.0°F; the temperature of the water from the well at the Arlington Hotel is reported to be 22.8°C (73.0.°F) ) The high temperatures are associated with the abnormally high geothermal gradient caused by heat conveyed to the surface by the waters of the hot springs.
TABLE 4.—Temperatures of the cold springs
| Spring No. (fig. 6) |
Name | Temperature (°C) |
Date of measurement | Geologic formation |
| S1 | Ozark Lithia | 19.6 | 6-29-72 | Bigfork Chert. |
| S2 | J. L. Bryant (owner) | 15.6 | 6-29-72 | Do. |
| S3 | Arbordale | 26.8 | 6-7-72 | Do. |
| S4 | Burton Sargo (owner) | 17.8 | 9-12-72 | Do. |
| S5 | Echo Valley | 20.5 | 1-27-72 | Do. |
| S6 | Ar-Scenic | 20.7 | 11-2-71 | Do. |
| S7 | Cluster | 20.8 | 1-26-72 | Arkansas Novaculite. |
| S8 | Happy Hollow | 17.5 | 1-24-72 | Do. |
| S9 | Music Mountain | 20.9 | 9-27-72 | Stanley Shale. |
| S10 | Sleepy Valley | 12.0 | 1-28-72 | Bigfork Chert. |
| S11 | McLendon | 18.6 | 9-27-72 | Hot Springs Sandstone Member of the Stanley Shale. |
TABLE 5.—Temperatures of water in the wells
[Thermal gradient = (temp. (°C) - 15)/depth of well (ft)]
| Well No. (fig. 6) | Temperature (°C) |
Date of measurement | Depth of well (ft) |
Thermal gradient (°C/ft) | Geologic formation |
| W1 | 15.6 | 6-29-72 | 26 | 0.023 | Bigfork Chert. |
| W2 | 17.8 | 9-13-72 | 30 | .093 | Do. |
| W3 | 16.4 | 6-6-72 | 61 | .023 | Do. |
| W4 | 16.1 | 7-14-72 | 170 | .065 | Do. |
| W5 | 16.9 | 7-14-72 | 92 | .021 | Do. |
| W6 | 16.7 | 7-14-72 | 30 | .057 | Do. |
| W7 | 15.6 | 6-6-72 | 89 | .0067 | Do. |
| W8 | 16.1 | 6-6-72 | 93 | .012 | Do. |
| W9 | 15.3 | 6-7-72 | 42 | .0071 | Do. |
| W10 | 16.7 | 6-7-72 | 20 | .085 | Do. |
| W11 | 16.7 | 6-6-72 | 101 | .017 | Do. |
| W12 | 17.4 | 9-25-72 | 44 | .054 | Do. |
| W13 | 15.3 | 9-12-72 | 67 | .0045 | Do. |
| W14 | 15.6 | 6-7-72 | 126 | .0048 | Do. |
| W15 | 17.6 | 9-25-72 | 140 | .019 | Do. |
| W16 | 15.6 | 6-2-72 | --- | --- | Do. |
| W17 | 15.0 | 6-2-72 | 38 | .0 | Do. |
| W18 | 15.8 | 6-6-72 | 78 | .010 | Do. |
| W19 | 16.1 | 6-2-72 | 235 | .0047 | Do. |
| W20 | 16.1 | 6-2-72 | 263 | .0042 | Arkansas Novaculite. |
| W21 | 20.4 | 9-27-72 | 120 | .045 | Do. |
| W22 | 16.7 | 11-2-71 | 90 | .019 | Bigfork Chert. |
| W23 | 16.1 | 11-2-71 | 46 | .024 | Do. |
| W24 | 18.8 | 1-22-72 | 300 | .063 | Do. |
| W25 | 18.6 | 1-28-72 | 89 | .040 | Do. |
| W26 | 18.0 | 1-24-72 | 28 | .11 | Do. |
| W27 | 22.8 | 3-8-70 | 202 | .039 | Hot Springs Sandstone Member of the Stanley Shale. |
| W28 | 52.8 | 8-8-72 | 336 | .11 | Do. |
| W29 | 32.2 | 3-4-70 | 200 | .086 | Do. |
| W30 | 18.0 | 9-22-72 | 300 | .010 | Arkansas Novaculite. |
| W31 | 16.7 | 9-22-72 | 140 | .012 | Bigfork Chert. |

|
| FIGURE 6.—Locations of the cold springs and wells. (click on image for a PDF version) |
The temperatures of ground waters in and near areas considered as potential for recharge to the hot-springs system (outcrop area of Bigfork Chert and Arkansas Novaculite) range from 15.0°C (59.0°F) to 26.8°C (80.2°F). These temperatures, considered in relation to the average annual air temperature of 17.7°C (63.9°F) indicate that some of the waters in and near the recharge area are heated by geothermal processes. Ground-water temperatures, in the range of 15.0°C (59.0°F) to 16.7°C (62.1°F), indicate a minimum of geothermal heating and reflect the fact that most recharge occurs during the cooler seasons of the year. These temperatures indicate that there is a rapid rate of movement of water downward from the surface and proximity to the recharge-source area.
Low ground-water temperatures, lower than the average air temperature, occur in the area northeast of the springs and in the outcrop of the Bigfork Chert and the Arkansas Novaculite. Water temperatures from several wells in the area are higher than the average air temperature. The higher temperatures indicate geothermal heating due to a long residence time of the water in the aquifer. Of the five wells sampled having temperatures higher than the average air temperature, four are flowing artesian wells.
The cold-water springs in the area are generally warmer than the well waters. The spring temperatures range from 15.6°C (60.1°F) to 26.8°C (80.2°F) The designation of "cold-water" to these springs is for the purpose of distinguishing them from the hot springs of Hot Springs National Park. The warmer springs in this cold-water group could be correctly classified as thermal springs.
CHEMICAL QUALITY
The ground water of the hot springs contains a variety of chemical species in solution. Knowledge of the chemical types and concentrations is useful in interpreting patterns of ground-water movement, source of the water, and in determining whether there has been a change in the chemical concentration of the water through the years. Chemical analyses may also hold clues to the longevity of the hot springs.
There has been little change in the chemical quality of the hot-springs waters during the period of record from 1890 to 1970. A small change in the silica concentration is indicated, and its significance has been discussed. Minor variations in other constituents are consistent with normal variations in most ground water.
As part of this study, samples for chemical and isotope analyses were collected in 1972 from 15 cold wells and springs in the Hot Springs region and from 9 hot springs. Table 6 gives the results of the chemical analyses made for this study. The concentration of certain dissolved constituents may change between the time of field collection and the time of laboratory analysis owing to loss of gases, temperature changes, and precipitation of solids. To insure that the analyses would represent the natural chemistry of the water as closely as possible, certain analyses were made in the field, and parts of the samples were treated before being sent to the laboratory, to prevent changes before analysis.
TABLE 6.—Chemical analyses of water from the
hot springs, cold springs, and wells
(Results in milligrams per liter, except as indicated)
(click on image for a PDF version)
Temperature was measured at the collection site using thermometers readable to 0.1°C (0.18°F). Alkalinity, pH, and dissolved oxygen (DO) were also measured as part of the sample collection procedure because they are liable to change by exchange with atmospheric CO2 or O2 gas when a water sample is shipped or stored. The precautions mentioned by Barnes (1964) were observed in the pH and alkalinity measurements. The pH values are considered accurate to ± 0.02 units. The dissolved oxygen analytical procedure was that described by Brown, Skougstad, and Fishman (1970, p. 126). A separate bottle of each sample was acidified at the time of collection and taken to the laboratory for analyses for aluminum (Al), iron (Fe), manganese (Mn), zinc (Zn), calcium (Ca), magnesium (Mg), and strontium (Sr). Analyses for these seven ions, as well as for sodium (Na) and potassium (K), were made by atomic absorption spectroscopy. All determinations were made by using methods standard in U.S. Geological Survey laboratories (Brown and others, 1970). The analyses of aluminum for samples collected in September 1972 were made from a larger aliquot than was used for the analyses of the samples collected earlier. Thus the precision reported in table 6 is greater for the samples collected in September 1972. The precision of all analyses is estimated to be plus or minus one-half of the last reported digit. That is, a reported 2.1 mg/L implies a concentration of between 2.05 and 2.15 mg/L. A reported 0.00 mg/L means that analysis was made for that constituent but the constituent was not found in concentrations greater than 0.005 mg/L.
The chemical analyses given in table 6 are arranged approximately in order of increasing total dissolved-solids concentration. U.S. Geological Survey station numbers of the sampling points are given in table 7. Two, or possibly three, of the analyses given in table 6 are not of particular use in describing the chemical history of the hot-springs-area ground waters. Music Mountain Spring issues from Stanley Shale, and its chemical characteristics, particularly its silica and chloride concentrations, are unlike those of waters in the hot-springs-flow system. The R. B. Yates' well, although in the geographic and geologic area of interest, is very shallow, and the water has a high concentration of nitrate (NO3=8.3 mg/L) and chloride (Cl=6.4 mg/L). This chemistry and the location of the well suggest that the water is influenced by man's activity and does not represent the natural conditions of interest in this report. The water from Bill Sargo's well, too, has slightly high chloride and nitrate concentrations (3.6 and 1.7 mg/L, respectively) and may not be completely representative of natural conditions.
TABLE 7.—Station numbers of wells and springs given in table 6
| Station number | Name of well or spring |
| 343110093025301 | Happy Hollow Spring |
| 343252091002301 | Belvedere Country Club well |
| 343204093005501 | Frank Thompson's house well |
| 343211093011501 | Sleepy Valley Spring |
| 343227093002201 | Bill Sargo's well |
| 343327093000401 | R. B. Yates' well |
| 342954093070101 | Music Mountain Spring |
| 343033092584901 | Cluster Spring |
| 343105092572001 | McLendon Mineral Spring |
| 343130093020801 | Gulpha Gorge well |
| 343347092594201 | Elizabeth Brown well |
| 343052093040802 | Whittington Avenue Spring |
| 343056093040601 | Whittington Park well |
| 343231093012801 | Echo Valley Spring (Big Chalybeate) |
| 343112093033601 | Diamond Mineral Spring (Lithox) |
| 343051093031101 | Maurice Hot Spring |
| 343057093031301 | Hot Spring No. 17 |
| 343053093031101 | Hot spring No. 23 |
| 343051093030901 | Hot Spring No. 33 (Upper Display) |
| 343049093031101 | Hot Spring No. 46 |
| 343058093030803 | Hot Spring No. 48 |
| 343055093031201 | 80,000-gallon reservoir |
| 343047093031001 | Hot Spring No. 42 (Health Services) |
| 343035093031001 | Hot Spring No. 49 |
The water from the hot springs is distinctive chiefly by its relatively low mineral concentration (table 6). The mineral concentration of the water probably is low because the rocks associated with the hot springs are made up of only a few minerals, each of which has a low solubility. Most ground water in Arkansas contains from two to to three times more dissolved minerals than the hot-springs water.
GEOCHEMISTRY OF HYDROGEN AND OXYGEN ISOTOPES
The elements hydrogen and oxygen have several naturally occurring isotopes. Hydrogen has stable isotopes of mass 1, common hydrogen or protium (H or 1H), and of mass 2, deuterium (D or 2H). A radioactive isotope of hydrogen, tritium (3H), also occurs in the environment and is discussed below. Common oxygen has a mass of 16 (16O), but oxygen of mass 17 (17O) and mass 18 (18O) also occur.
As absolute isotopic abundances or ratios are difficult to analyze with precision, it is customary to measure and express isotopic variations as deviations from an arbitrary standard. These deviations are expressed in delta notation where
| δ = ( | R sample |
- 1 ) X 1,000. |
| R standard |
Here, R is the isotopic ratio (D/H; 18O/16O), and δ is in parts per thousand, or per mil (‰) The delta notation is less difficult to use than it seems.
The standard to which natural-water isotopic
measurements are referred is Standard Mean Ocean Water (SMOW) (Craig,
1961a). The concentrations of the various isotopic molecular species in
this standard are H218O  2,000 mg/L,
H217O 420 mg/L, and
H216O
316 mg/L. H216O makes up the remainder, and all other
species total less than 1 mg/L. Knowledge of the 17O
concentration of a sample provides no more information than knowledge
of the 18O concentration; there fore, the 17O
concentration is generally not reported. The stable isotopic chemistry
of water is thus expressed in terms of δD and δ18O.
2,000 mg/L,
H217O 420 mg/L, and
H216O
316 mg/L. H216O makes up the remainder, and all other
species total less than 1 mg/L. Knowledge of the 17O
concentration of a sample provides no more information than knowledge
of the 18O concentration; there fore, the 17O
concentration is generally not reported. The stable isotopic chemistry
of water is thus expressed in terms of δD and δ18O.
Natural waters are generally depleted in D and 18O relative to SMOW—that is, their δD and δ18O values are negative. This depletion occurs because the vapor pressure of water molecules containing the heavier isotopes is slightly less than that of common water, H216O. During evaporation and condensation in the hydrologic cycle, molecules containing heavier isotopes are concentrated in the liquid phase. As water evaporates from the ocean, the vapor is depleted in D and 18O and the amount of depletion becomes greater as the temperature of evaporation decreases. Further isotopic fractionation takes place as water is condensed and reevaporated during atmospheric transport, and the amount of fractionation is inversely proportional to temperature.
The D and 18O concentration of meteoric water—that is, water of recent atmospheric origin—varies regularly over the land surface of the Earth. A great number of measurements show that for meteoric water not subject to much evaporation, δD and δ18O are related by the expression by Craig (1961b):
δD=δD18O+10. (1)
The amount of depletion also increases with altitude, latitude, and distance from the ocean. The general pattern of isotopic distribution in North America has been mapped (Sheppard and others, 1969).
Figure 7 shows the variation of δD and δ18O from several hydrothermal localities and the trend line for meteoric waters, equation 1. The meteoric waters from the localities shown illustrate the tendency for increasing depletion from the oceanic isotopic composition with latitude, altitude, and distance.

|
| FIGURE 7.—Comparison of isotropic composition of waters from the cold and hot springs of Arkansas and of hydrothermal waters elsewhere (after White and others, 1973, fig. 1). |
Figure 7 illustrates that the 18O content of many thermal waters is enriched relative to normal meteoric waters of the same D content. An explanation for this shift might be that the hot waters represent mixing between meteoric water and water emanating from hot or molten rock at great depths within the earth—that is, magmatic water, the isotopic composition of which is not precisely known but which may well be in the range shown in the figure. Were this explanation correct, there should be a shift in δD, as well as in δ18O toward whatever isotopic composition may be typical of magmatic water. As is particularly well illustrated by the Nevada and Yellowstone Park series, such a deuterium shift does not occur. Because a deuterium shift is absent and because of the existence of another process to explain the 18O shift, magmatic waters are probably not significant contributors to hydrothermal systems.
The process bringing about the 18O shift is probably an isotopic-exchange reaction between the water and rock in a system. Such a reaction for a silica mineral can be written as
Si16O18O÷H216O→Si16O2+H218O.
Because 18O in most igneous minerals is enriched relative to SMOW, the effect of this reaction is to drive the δ18O in exchanging waters toward positive values. Also, because of the low hydrogen concentration of most of the rock, the δD of waters is relatively unchanged.
Isotopic-exchange reactions, as in all chemical reactions, proceed faster at high temperatures, and their effects are generally detected only in systems in which the water temperature approaches or is higher than 100°C (212°F). Because of the utility of stable isotopes inpervious interpretative work in such systems, D and 18O measurements were made on several samples from the hot-springs system.
Isotopic analytical results are given in table 8 and shown in figure 7. Deuterium in the cold waters has an average δD = -228.6‰, whereas the average of the hot springs is insignificantly different at -28.3‰. These values agree with previous estimates (Sheppard and others, 1969) that deuterium in meteoric water in the central Arkansas region should be within a few per mil of -30. The coincidence of values for the hot- and cold-water sampling points is strong evidence that there is no detectable source of meteoric water contributed to the hot springs from outside the region.
The average δ18O of the hot springs is -5.2‰, and the average of the cold springs is -5.1‰. The lack of oxygen shift shows that there is no oxygen-isotope exchange between the hot springs and oxygen-bearing minerals in the aquifer. This lack of oxygen-isotope exchange could be true only if (1) the maximum temperature within the hot-springs system is not much higher than the springs' surface temperatures and (or) (2) the flow rate of the waters through the hottest part of the system is relatively high, so that there is little time for exchange.
In summary, the deuterium and 18O data suggest that the concept given elsewhere in this report concerning the hydrology of the Arkansas hot springs is reasonable and that (1) virtually all the water in the hot springs is of local, meteoric origin—any theories implying long-distance (that is, many tens or hundreds of miles) water movement, or the presence of juvenile or magmatic water in the springs, must be disregarded—and that (2) the maximum temperature reached by most of the hot-springs water cannot be many tens of degrees higher than the springs' surface temperature; also (3), the resident time of the hot springs waters in the heated part of the system is a relatively short time, that is, not more than perhaps a few hundred years. The silica concentration of the hot. springs water, discussed in a previous section, and the 14C concentration, discussed in the following, refine these conclusions further.
The isotope of hydrogen is tritium (H3 or T), which has an atomic mass of 3 and is radioactive, with a half-life of about 12-1/4 years. Tritium is formed continuously by cosmic rays impinging on the upper atmosphere. This natural tritium is present in precipitation at levels of from 1 to 10 T atoms per 1018 H atoms. Tritium is measured by analyzing its rate of radioactive decay in a water sample, and the results are expressed as tritium units (Tu), one of which is equal to a T/H ratio of 1018. Thus, natural tritium is present in the range of from 1 to 10 Tu.
Large quantities of tritium are produced by nuclear devices, and the atmospheric testing of such devices—particularly fusion devices (hydrogen bombs)—from the early 1950's through 1962 raised the level of tritium in precipitation to many times its natural level of from 1 to 10 Tu. Peak tritium levels occurred in the spring of 1963, when precipitation at St. Louis, for example, reached levels of more than 2,500 Tu. Since then, tritium levels have been decreasing at about 30 percent per year. During the 1950's, tritium levels were in the range of several hundred tritium units, also well above natural levels.
The tritium concentrations of samples collected from the hot springs are given in table 8.
TABLE 8.—Hydrogen- and oxygen-isotope concentration of waters in the hot-springs area
| Well or spring No.1 (fig. 6) |
Name | Date of collection in 1972 |
δD SMOW ‰ |
δ18O SMOW ‰ |
Tritium (TU±1σ) |
| S8 | Happy Hollow Spring | Jan. 24 | -30 | -5.8 | 1.1±0.6 |
| W19 | Belvedere Country Club Well | Sept. 25 | -23 | (2) | 41.8±2.0 |
| W20 | Frank Thompson's house well | Sept. 24 | -28 | (2) | 85.3±1.6 |
| S10 | Sleepy Valley Spring | Sept. 28 | -30 | -5.5 | 34.1±2.1 |
| W17 | Bill Sargo's well | Sept. 24 | -30 | (2) | 91.8±4.7 |
| W16 | R. B. Yates' well | Sept. 25 | -28 | (2) | 27.7±1.6 |
| S11 | McLendon Mineral Spring | Sept. 27 | -29 | (2) | 1.5±0.8 |
| W21 | Gulpha Gorge well | Sept. 27 | -30 | (2) | 1.3±0.4 |
| S7 | Cluster Spring | Sept. 26 | -30 | (2) | .7±0.6 |
| W26 | Whittington Avenue Spring | Jan. 24 | -26 | -4.1 | 2.8±0.5 |
| W25 | Whittington Park well | Jan. 28 | -29 | -5.3 | 1.2±0.8 |
| S5 | Echo Valley Spring | Jan. 27 | -30 | -5.1 | 3.1±0.6 |
| W12 | Elizabeth Brown well | Sept. 24 | -29 | (2) | .9±0.5 |
| W24 | Diamond Mineral Spring | Jan. 22 | -29 | -4.9 | 1.5±0.4 |
| Maurice Hot Spring | Jan. 20 | -27 | -3.9 | 1.2±0.3 | |
| Hot Spring No. 17 | Jan. 25 | -30 | -5.4 | 3.0±0.5 | |
| Hot Spring No. 23 | Jan. 26 | -28 | --- | .7±0.8 | |
| Hot Spring No. 33 | Jan. 26 | -28 | -5.4 | .9±06 | |
| Hot Spring No. 46 | Jan. 18 | -29 | -5.5 | 3.1±0.6 | |
| Hot Spring No. 48 | Jan. 25 | -28 | -5.7 | .7±0.4 | |
| 80,000-gallon reservoir | Jan. 27 | -29 | -4.9 | 1.0±0.7 | |
| Hot Spring No. 42 | Jan. 19 | -28 | -5.4 | 2.7±0.3 | |
| Hot Spring No. 49 | Jan. 21 | -28 | -5.6 | 9±0.4 | |
1U.S. Geological Survey numbers of wells
and springs are given in table 7.
2Not analyzed. | |||||
Results of radioisotope measurements of tritium and also 14C, that are discussed below, are expressed with a statistical-error term corresponding to one standard deviation (18). There is a probability of two in three that the true value of a quantity is within the 18 range. For Diamond Mineral Spring (table 8), with tritium shown as 1.5±0.4 Tu, there is a 67-percent probability that the true tritium concentration is between 1.1 and 1.9 Tu, and a 95-percent (2σ) chance that it is between 0.7 and 2.3 Tu.
Of the nine hot springs, four have tritium levels that are so low that they may, within a 95-percent confidence limit, contain no tritium; that is, the 2σ range of their analyses includes zero. The rest of the hot springs contain tritium, but not more than 3 Tu. A sample that contained 3 Tu could be water that fell as rain in the 1940's that had an initial tritium concentration of about 10 Tu. This explanation is unlikely, though, because evidence discussed below suggests that the hot-springs waters have ages of thousands of years, and there is another explanation for the 3-Tu level which also accounts for the different tritium concentrations of the several springs.
It is possible that some of the hot springs include a small proportion of water of very recent origin which mixes with the main flow of heated water near the springs' outlets. Such water could contain water from the 1960's that has tritium levels of several hundred or more tritium units. An admixture of less than 1 per cent of such water would raise the tritium level to that measured, and such an amount would be too small to measurably affect any other characteristics of the sample. Thus, the tritium level suggests that there is no significant amount of water less than several decades old in any of the hot springs.
Of the 14 cold wells and springs, 5 have tritium levels higher than 25 Tu and the rest have levels lower than 3 Tu. Those with little tritium, such as the hot springs, contain no significant amounts of recently recharged water, whereas those with high tritium concentrations contain significant quantities of water recharged within the past 15 years. Their high tritium concentration reinforces the preceding conclusion that the chemistry of Belvedere Country Club well and Frank Thompson's house well is that of recharge to the system and that Bill Sargo's well and R. B. Yates' well could be influenced by man's activity. The fact that Happy Hollow Spring, although chemically identical with the high-tritium Belvedere Country Club well and Frank Thompson's house well, contains only 1.1±0.6. Tu is somewhat puzzling. A possible explanation is that the water in this spring fell as rain at, say, 5 Tu in the prebomb era (pre-1953) and has no component of post-1953 water. Sleepy Valley Spring shows only slight effects of mineral-water reactions, and its high tritium concentration is therefore not unexpected.
CARBONATE GEOCHEMISTRY
The most common inorganic, carbon-bearing chemical species are carbon dioxide (CO2), a gas which readily dissolves in water, bicarbonate (HCO3-), the predominant carbon species in most waters in nature, and carbonate (CO3-2), found in such minerals as calcite (CaCO3) but also present in low concentrations in solution. The prevalent species in a given solution depend on the hydrogen-ion (H+) concentration of the solution. The pH of a solution is a measure of its H+ activity (pH = -log a H+). A solution having a low pH has a relatively high H+ activity, or is acidic; one having a high pH represents an alkaline solution, one having a relatively low H+ activity.
The interreactions among the three carbonate species are:
CO2(gas) + H2O → H2CO3, (2)
H2CO3 → H+ + HCO3-, (3)
and
HCO3- → H+ + CO3-2. (4)
Water in contact with a gas phase containing CO2 will dissolve CO2, according to reaction 2, in an amount proportional to the partial pressure of CO2 in the gas (PCO2). Some of the H2CO3 so formed will dissociate, by reaction 3, to bicarbonate and hydrogen ion, which will lower the pH of the solution. If an alkaline substance is present, the H+SO formed will be removed from solution, permitting more HCO3- to form. Carbonate minerals are common alkaline substances and are dissolved by H+ by the reaction
CaCO3(solid) + H+ - Ca+2 + HCO3-. (5)
If a water originally charged with CO2 is brought into contact with a carbonate mineral, the reaction
CO2 + H2O + CaCO3 → Ca+2 + 2HCO3- (6)
will occur. This reaction is the most important in controlling the chemical character of waters in the hot springs area, and together with the solution of silica, discussed previously, also controls the chemistry of the hot springs themselves.
In discussing the carbonate chemistry of these waters, the term "total dissolved carbonate" is often used. This term refers to the molar sum of the dissolved carbonate species H2CO3, HCO3-, and CO3-2. This is not an analyzed value, but is calculated from the HCO3- and pH values given in table 2, and the equilibrium-constant expressions corresponding to reactions 2, 3, and 4. These calculations were made using the computer program WATEQ (Truesdell and Jones, 1974). The total dissolved-carbonate concentrations so calculated for the waters sampled are given in table 9.
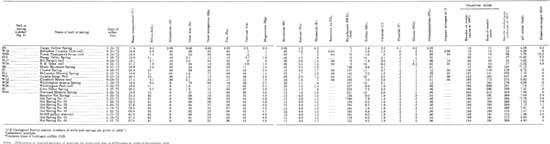
TABLE 9.—Carbon-isotope date for waters in the hot-springs
area
(click on image for a PDF version)
Some of the wells and springs were sampled for analyses of their dissolved-gas concentration. Figure 8 shows the relation between the analyzed partial pressure of CO2 (PCO2), with the PCO2 calculated from the values of pH and HCO3- given in table 6. Some of the analyzed values are larger than the calculated values, but most agree within 25 percent. Although this may appear a large error, it introduces very little error into the much larger calculated total dissolved-carbonate concentration, which is the parameter of interest.

|
| FIGURE 8.—Relation between analyzed and calculated partial pressures of CO2. |
Water entering a ground-water system is exposed to gases from the Earth's atmosphere and from the gas phase in the soil zone. The soil air is the last gas phase to which the water is exposed before it enters the water-saturated zone, so the composition of the soil air controls the type and amount of gases initially dissolved in ground water. The main difference between the open atmosphere and soil air is that the soil air contains considerably more CO2. In the open atmosphere, the partial pressure of CO2(PCO2) is about 3 x 10⁻⁴ atm (atmospheres). Water in contact with this PCO2 at 17°C (62.6°F) contains about 1.3 x 10⁻² millimoles per liter (mmol/L) H2CO3, or about 0.8 mg/L. In soils, though, much of the CO2 is produced by plant-root respiration and by decay of plant debris, so the PCO2 in soil air is one or more orders of magnitude higher than that in the open atmosphere.
Because of differences in soil and plant types, the soil air PCO2 may differ from place to place, but should be reasonably constant within a given area. An analysis of the composition of the gas dissolved in Happy Hollow Spring, one of the waters containing dissolved material which, except for silica, is probably derived mainly from atmospheric precipitation, showed its PCO2 to be 3 x 10⁻² atm, equivalent to an H2CO3 concentration of about 1.4 mmol/L, or 87 mg/L. Gas analyses were not made for the other two most dilute samples—from Frank Thompson's well and the Belvedere Country Club well—but analyses of their HCO3- and H+ (pH) concentrations were made. From these data and from the known equilibrium constants for the reactions between carbonate species (1 and 2 above), the PCO2 of the gas in equilibrium with them can be calculated (Truesdell and Jones, 1974). For the water from Frank Thompson's well, the PCO2 so calculated is about 2 x 10⁻² atm. The average total dissolved carbonate (H2CO3+HCO3-) in these three samples was 1.15 mmol/L.
The chemistry of the remaining cold waters sampled differs from that of atmospheric precipitation, as represented by Happy Hollow Spring, Frank Thompson's well, and the Belvedere Country Club well, primarily in having higher alkaline-earth (Ca+2, Mg+2, and Sr+2) and bicarbonate (HCO3-) concentrations. Reactions representing the solution of mineral carbonate are written in terms of an idealized CaCO3 mineral. In nature, CaCO3 may contain other elements of the alkaline-earth group such as magnesium (Mg+2) and strontium (Sr+2), replacing calcium. These substitutions have little effect on the carbonate in the ground water, and so in discussing the measured water chemistry, the total alkaline-earth concentration (Ca+Mg+Sr) is used, whereas in discussing reactions, only the idealized-Ca+2 form is used.
Figure 9 is a graph showing the concentrations of alkaline-earth against total dissolved-carbonate concentrations (H2CO3+HCO3- + CO3-2). On this graph, the point at zero alkaline-earth concentration is at the average total-carbonate concentration of the three most dilute samples (1.15 mmol/L). From this point, lines are drawn showing the trend of compositions which would result from solution of carbonates by reactions 5 and 6. Three of the samples—Sleepy Valley Spring, Cluster Spring, and Whittington Avenue Spring—fall near the line of reaction 6. In these samples, the dissolved carbonate in excess of that in the recharge water is half from solution of carbonate minerals and half from solution of further soil-zone-derived CO2. The other samples plot between the two lines, and a greater proportion of their excess carbonate is from solution of carbonate minerals alone.
To adjust 14C (radiocarbon) measurements on ground waters so that they can be used to calculate ground water ages, it is necessary to know the proportion of total dissolved carbonate that has come from solution of soil-zone CO2. This factor can be derived from the chemical information in figure 9, but before describing the method, a discussion of the isotopic chemistry of carbon is appropriate.

|
| FIGURE 9.—Relation of alkaline-earth concentration to dissolved-carbonate concentration. |
ISOTOPIC CHEMISTRY OF CARBON
The element carbon has three naturally occurring isotopes with masses of 12, 13, and 14. Carbon of masses 12 (12C) and 13 (13C) are stable isotopes, whereas carbon of mass 14 (14C) is radioactive. In any chemical reaction such as the solution of CO2 to form HCO3-, or the formation of carbohydrates from CO2 by plants during photosynthesis, the light isotope (13C) reacts faster than the heavier isotope (13C) The isotope ratios of reactant and product species are different, and isotopic fractionation occurs. Carbon-isotope ratios are measured relative to an arbitrary standard, a calcite of marine origin known as PDB and expressed in the δ-notation, as are hydrogen- and oxygen-isotope ratios.
δ13C values for samples from a single type of carbon-bearing material are relatively constant, but one material may have quite different δ13C values from another. Marine limestones, for instance, have δ13C values close to zero (because a marine carbonate is used as the standard), whereas atmospheric CO2 and plants typical of the hot-springs region are depleted in 13C and have δ13C values of about -7‰ and -24‰, respectively. These large differences make δ13C measurements valuable in determining the sources of dissolved-carbonate species (Pearson and Hanshaw, 1970).
The naturally occurring radioisotope of carbon (14C) has a half-life of about 5,730 years. Natural 14C is formed by cosmic-ray reactions in the upper atmosphere and is found at virtually a constant concentration in atmospheric CO2. 14C concentrations are measured and reported as percentages relative to a standard whose 14C concentration is that of an ideal plant, grown in 1950, in the absence of any atmospheric CO2 of industrial origin. 14C is produced as a byproduct of nuclear explosions, and in the last 25 years the 14C level in the atmosphere has risen considerably higher than its natural level (100-percent modern).
Plants using atmospheric CO2 assimilate 14C. When a plant dies, the amount of 14C it contains decreases because of radioactive decay, and the amount remaining, relative to that of an ideal living plant, measures the time that has elapsed since its death. This is the principle on which the radiocarbon (14C)-dating method is based.
The equation for radioactive decay is
| Asm |
= exp(-λt), |
| Astd |
where Asm/Astd is the ratio of sample to standard activity, λ is the decay constant of the isotope (1/8,266 for 14C), and t is the age in years. (The half-life of an isotope is the value of t when Asm/Astd = 0.5; that is, t1/2=ln 2/λ=5,730 years for 14C) For calculation, the decay equation is often written using natural logarithms (ln) as
| t = -8,2.66 ln ( | Asm |
) |
| Astd |
As discussed, the CO2 in the soil air is a product of plant respiration and decay. Because of its plant origin, soil-air CO2 has the same carbon-isotopic composition as plants; its δ13C value is about -24‰, and its 14C concentration is close to 100 percent (in the prebomb era). Soil CO2 dissolved by ground water will also inherit its plant isotopic character, and if soil CO2 were the only source of carbonate dissolved in a ground water, its 14C concentration would directly reflect the age of the ground water—that is, the time that has elapsed since the water left the soil zone.
Ground water generally contains mineral carbonate, which is commonly of marine origin and has a δ13C value near 0‰. Because of its great age relative to the half-life of 14C, mineral carbonate has no 14C. Solution of 14C-free carbonate lowers the measured -14C concentration of carbonate dissolved in ground waters and gives the water a falsely old apparent age. However, if the relative amounts of soil-derived and mineral carbonate are known, this effect can be corrected.
For example, consider a water of an age of zero years, with a total dissolved carbonate of 4.00 mmol/L, of which 3.00 mmol/L is from soil CO2 (14C=100 percent) and 1.00 mmol/L from carbonate minerals (14C=0 per cent). The measured -14C concentration of this water will be
| ( (3.0 x 1.0)+(1.0 x 0.0) ) |
= 75-percent modern, |
| 4.0 |
and its apparent age will be
t = -8,266 ln (75/100) = 2,380 years,
instead of its real age, zero years.
By knowing the proportions of the sources of carbonate to a ground water, it is possible to adjust the measured -14C concentration to its correct value and so obtain a corrected age. The adjustment factor, P, is the ratio of soil-air-derived (=plant) carbonate concentration to total dissolved-carbonate concentrations:
| P= | Cplant |
. (7) |
| Ctotal |
For this example,
| P= | 3.00 |
= 0.75. |
| 4.00 |
The adjusted 14C concentration is
| 14C (adjusted) = | 14C (measured), |
| P |
and for this example
| 14C (adjusted) = | 75 percent |
= 100 percent, |
| 0.75 |
corresponding to an age of zero, as specified.
Chemical information on ground water can often be used to determine the proportion, P, of soil-air-derived carbonate to total carbonate. A graphical representation of changes in water chemistry, such as that given in figure 9, can be useful. Consider Whittington Avenue Spring. The total carbonate concentration of this sample (3.85 mmol/L) is the sum of (1) carbonate dissolved by atmospheric precipitation in the recharge area, here taken as the average of the three very dilute samples, Happy Hollow Spring, Frank Thompson's well, and the Belvedere Country Club well shown in figure 9, or 1.15 mmol/L, and (2) additional carbonate from the reactions
CaCO3+H+→Ca+2+HCO3- (5)
and
CO2+H2O+CaCO3→Ca++2HCO3- (6)
or, 2.70 mmol/L.
Note that in reaction 5 all the bicarbonate is from the solution of mineral carbonate and that an equivalent amount of alkaline earth (Ca) also appears in solution. In reaction 6, half of the bicarbonate is of mineral and half of gaseous (plant and soil-air) origin. In reaction 6, twice as much bicarbonate as alkaline earth is produced, but the amount of mineral carbonate added still equals the amount of alkaline earth, as in reaction 5.
The Whittington Avenue Spring contains 1.34 mmol/L of alkaline earth in solution, and from the preceding paragraph, this will be the amount of mineral carbonate dissolved, as well. That is, of the 2.70 mmol/L total carbonate present in excess of that in the recharge, 1.34 mmol/L is of mineral origin and 1.36 mmol/L (2.70—1.34) of plant origin.
To sum these considerations algebraically,
Ctotal = Crecharge + Cmineral + Cgaseous, (8)
where C is the carbonate concentration from the subscript sources. Crecharge and Cgaseous are of plant (=soil-air) origin and Cmineral=Calkaline earth. Equation 8 becomes
Ctotal = Cplant + Calkaline earth,
or
Cplant = Ctotal + Calkaline earth. (9)
The 14C-adjustment factor, equation 7, can now be solved:
| P = | Cplant | = | Ctotal - Calkaline earth |
= 1 - ( | Calkaline earth | ) (10) |
| Ctotal | Ctotal | Ctotal carbonate |
For the Whittington Avenue Spring,
| P = 1- ( | 1.34 |
) = 0.65. |
| 3.85 |
The stable carbon-isotopic composition of the total carbonate dissolved in a ground water sample also reflects the proportions of the source carbon. As discussed, the δ13C value for plants is about -24‰, whereas that for marine mineral carbonate is about 0‰. The δ13C value of a sample will be in proportion to the amounts and isotopic compositions of its carbonate sources:
| δ13Csample = δ13Cplant ( | Cplant |
) + δ13Cmineral ( | Cmineral | ). |
| Ctotal | Ctotal |
Because δ13Cmineral = 0‰, the last term is zero and
| δ13Csample=δ13Cplant ( | Cplant | ). (11) |
| Ctotal |
which, on recalling equation 7 and substituting an average value for δ13Cplant, becomes
δ13Csample = -24P. (12)
Carbon-isotope data and calculated total carbonate concentrations of samples in the hot-springs area are given in table 9. For each, a value for P, the proportion of plant carbonate, calculated using equation 10, is shown. Also, δ13C values, calculated from equation 12, are given for comparison with the measured δ13C values.
Agreement between measured and calculated δ13C values is excellent, suggesting that the geochemical processes, described in the preceding paragraphs, adequately model the field situation. The average value of the differences between the calculated and measured δ13C values is 0.75‰, and the average value of the measured δ13C values themselves is 16.7‰. The error associated with the calculated values of P can be estimated as 0.75/16.7 x 100 = 4 percent. This is larger than the 14C-analyzed errors and corresponds to an error band of ±500 years for a sample of 4,000 years and of ±1,000 years for a sample of 9,000 years.
The adjusted ages of the cold wells and springs that were sampled are consistent with inferences previously drawn from their chemical character and their tritium concentrations. The Belvedere Country Club well and Frank Thompson's well, which represent water recharging the system, have 14C concentrations near 100-percent modern. The R. B. Yates' well, which on chemical criteria is suspected to include recent water showing man's influence, has both 14C and tritium levels found only in the last 20 years.
The adjusted ages of the remaining cold-water samples range from 3,700 to 8,900 years and increase in age with increasing total carbonate concentration.
AGE OF THE HOT-SPRINGS WATER
As the analyses in table 6 show, the hot springs have almost identical chemical characteristics, suggesting that they have a common origin. The only detectable differences among them are in their carbonate concentrations, shown by the different HCO3- and pH values in table 6, and in the total carbonate concentrations calculated from these values and given in table 9.
Calculations have been made to determine whether the waters of the hot-springs system are saturated with respect to the mineral calcite (CaCO3)—that is, to determine whether the calcium and carbonate concentrations of the waters are such that they will dissolve more calcite or deposit calcite from solution. The mineral calcite (CaCO3) dissolves according to the reaction
CaCO3→Ca+2+CO3-2.
At saturation, the product of the thermodynamic activities of the dissolved materials ( αCa+2, αCO3-2 ) equals a constant (KT), the value of which is a function of temperature. That is, at saturation
[αCa+2] [αCO3-2] = KT.
It is convenient to express the degree of saturation of a water in terms of the logarithm of the ratio of the activity product (AP) to the equilibrium constant (KT). The AP of an undersaturated water is less than one, so log (AP/KT) is negative. Conversely, log (AP/KT) of an oversaturated water is positive.
In the previous general discussion of carbonate chemistry, equations 2, 3, and 4 were given showing the interreactions among the carbonate species CO2 (gas), HCO3-, and CO3-2. According to these equations, a change in any one of the carbonate species will produce a change in the others. Combining equations 2, 3, and 4, for example, gives
2HCO3-→CO2(gas)+CO3-2+H2O,
which shows that if CO2 gas leaves water, responding to a decreasing (PCO2), the CO3-2 concentration may increase. This reaction in turn will increase the AP for calcite and thus the degree of saturation of the water with respect to calcite.
Certain of the hot springs visibly evolve gas where they emerge at the Earth's surface, and because this gas is in part CO2, the carbonate chemistry of individual springs should differ as a function of the amount of gas evolved. Measured and analyzed CO2 partial pressures (PCO2) from some of the springs are shown in figure 8. Comparison of this figure with the total dissolved-carbonate data in table 9 shows that a spring such as number 23 that has a low PCO2 value, which presumably results from evolution of a significant amount of dissolved gas, has a lower total dissolved-carbonate concentration than such springs as numbers 42 and 49 that have higher PCO2 values. The PCO2 of these waters is as high as 0.035 atm (fig. 8), whereas the PCO2 of the Earth's atmosphere to which they are exposed at the surface is only 0.0.003 atm. The hot-springs waters certainly could lose CO2 to the atmosphere as they approach the surface.
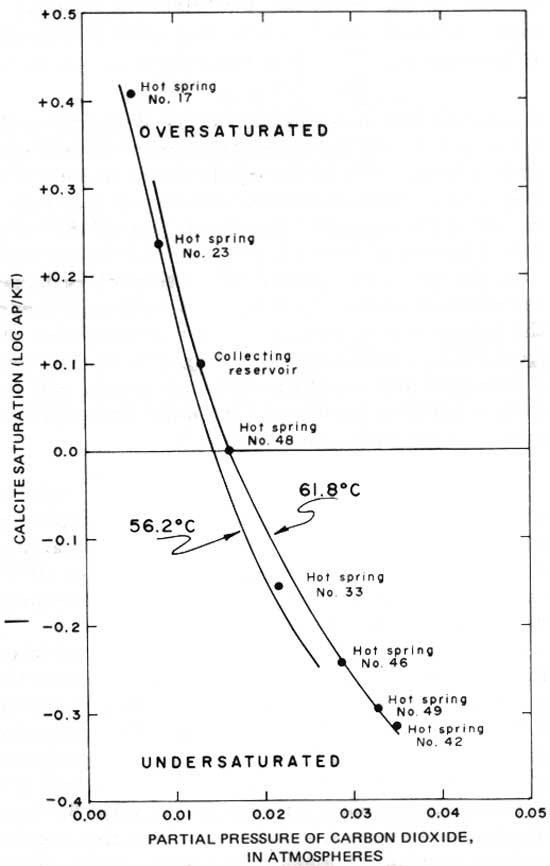
To follow the influence of CO2 outgassing on the overall carbonate chemistry of the spring water, calculations of log (AP/KT) at various values of PCO2 were made for a relatively cool spring (No. 23, 56.2°C (133.2°F)) and for a hot spring (No. 49, 61.8°C (143.2°F)). The results of these calculations are shown in figure 10. The path of decreasing calcite saturation with increasing PCO2 for spring number 23 is slightly offset from that of number 49 because of the temperature difference between the springs. More important, the points corresponding to the other springs sampled lie on or between the two calculated lines. From this comparison we conclude that the differences among the hot springs in pH and HCO3- (table 6), in total dissolved carbonate (table 9), and in PCO2 (fig. 8) are superficial and due only to different amounts of outgassing in the near-surface distributary system to the springs.
Figure 10 shows that certain of the springs are over-saturated with respect to calcite. Table 6, though, shows that the calcium concentration of the springs is identical (44.5±0.5 mg/L) and that the springs that were sampled had not yet begun to deposit calcite, though they have the potential to do so. If allowed to flow freely on the surface, all the springs would continue to lose CO2 and thus would deposit calcite. The tufa associated with the springs shows such deposition does occur.
|
| FIGURE 10.—Relation between calcite saturation and partial pressure of carbon dioxide in the hot springs. |
One significant difference between the hot-springs waters and the cold wells and springs in the region is their sodium (Na) concentration. The average sodium concentration of the 12 relevant cold-water samples is 1.8. mg/L (0.08 mmol/L), whereas that of the hot springs is 4.0 mg/L (0.18 mmol/L). There is no difference between the carbonate, sulfate, or chloride concentrations of the cold and hot springs to balance the additional sodium as there would be if the sodium were a product of the solution of some mineral. Instead, the sodium must result from a reaction by which it is exchanged for some other positively charged dissolved ion. Such a reaction can be written
Ca+2+Na2 X  Ca X 2Na+, (13)
in which Ca+2 represents an alkaline earth and Na2 X and Ca X represent solids, perhaps clay minerals, in the aquifer system, with X the substrate on which the exchange occurs.
This exchange reaction must be considered in calculating the proportion of plant to total carbonate to adjust the measured 14C concentrations of the hot springs and to determine their water ages. To calculate this proportion for the cold springs, the expression
| P = 1 ( | Calkaline earth |
) (10) |
| Ctotal carbonate |
was used. In deriving equation 10, it was assumed that only mineral carbonate solution affected the alkaline-earth concentration of the waters, and the validity of this assumption was borne out by the agreement between the calculated and measured stable carbonisotope concentration (δ13C) of the samples. In the hot-springs waters, the alkaline-earth concentration is dependent on exchange reaction 13, as well as on the carbonate chemistry, thus equation 10 cannot be used.
In discussing the carbonate chemistry of the cold springs, the relationship between the stable carbon isotope concentration (δ13C) of a sample and the proportion of plant to mineral carbonate,
| δ13Csample=δ13Cplant ( | Cplant | ), (11) |
| Ctotal |
was presented. This equation can be used directly to find the 14C adjustment factor, P:
| P = ( | Cplant |
) = | δ13Csample |
. (14) |
| Ctotal | δ13Cplant |
By using an average δ13Cplant = -24‰ as before (eq. 12), this becomes
P = δ13Csample / -24‰.
Isotopic fractionation takes place between
CO3-2, HCO3-, and
CO2 (gas) as outgassing and
CO3-2 production from HCO3-
occur. However, at the temperature of these springs (62°C)
the fractionation accompanying the reaction
HCO3-→H+→CO2+H2O is
nearly equal to and opposite that of the reaction
HCO3-→H++CO3-2 (Pearson and
others, 1972). Thus isotopic fractionation will not interfere with the
calculation of P by equation 14.
Because the hot springs are chemically and isotopically so similar, their average adjusted 14C concentrations and ages were calculated (table 9). Only those samples for which both 13C and 14C data are available were used in this average. As table 9 indicates, the proportion of plant carbonate to total carbonate in them, from equation 14, is 0.608, and their adjusted 14C concentration is 58.5-percent modern, corresponding to a water age of 4,430 years.
Although the total carbonate concentration of the hot-springs water before near-surface outgassing of CO2 is not known, it certainly cannot be lower than the highest value measured—3.18 mmol/L. This value is plotted with the adjusted age on figure 11 for comparison with the ages and carbonate concentrations of the cold wells and springs. That the hot springs, cold springs, and wells are part of the same group is clear and is additional evidence that all are part of the same hydrologic system.
A hydrologically important inference can be drawn from figure 11. The hot springs are on a trend line defined by both older and younger cold-water samples. Thus, it is probable that the age of the hot-springs water is due largely to its resident time in the cold-water part of the flow system, rather than to an extended period in a zone of heating. A rapid traveltime through the heated part of the system is in keeping with earlier conclusions from oxygen-isotope (18O) exchange, suggesting no prolonged period of heating. That the surface temperatures of the hot springs closely approach their probable maximum temperatures, as calculated from their silica concentrations, also implies rapid flow which prevents significant heat loss as the heated water rises to the surface.

|
| FIGURE 11.—Relation between adjusted carbon-14 age and total carbonate. |
RADIOACTIVITY OF THE WATERS IN THE HOT-SPRINGS REGION
The radioactivity of the waters of the hot springs has been studied by several investigators. The first study was by Haywood (1902), followed by Boltwood (1905), Schlundt (1935), and Kuroda, Damon, and Hyde (1953). Much of the early interest was because of the balneological use of the water. In 1953 studies by Arndt and Damon (1953) were sponsored by the U.S. Atomic Energy Commission, whose interest was the radon concentration and the source of the radioactivity.
The presence of radium in the waters of the hot springs was established by Schlundt (1935) when he determined an average value of 1.38 picograms per liter (1.35 picocuries per liter) of radium for three samples. Recent (July 1973) analyses of the waters by the U.S. Environmental Protection Agency show a radium concentration of 2.1±0.22 picocuries (10-12 curie) per liter. Radon, a gas that is a radioactive decay product of radium, was analyzed in the hot springs by Boltwood (1905), Schlundt (1935), and Kuroda, Damon, and Hyde (1953). Boltwood (1905) reported the radon concentration of 45 springs, ranging from 0.017 to 9.03 nanocuries (1.0-9 curie) per liter, with modal value of 0.466 nanocurie per liter. Schlundt found the radon concentration of six hot springs to range from 0.125 to 0.46 nanocurie per liter, with a modal value of 0.32 nanocurie per liter. Kuroda, Damon, and Hyde (1953) reported the radon concentration of 25 hot springs to range from 0.14 to 30.5 nanocuries per liter, with a modal value of 0.82 nanocurie per liter.
The variations from spring to spring found by each investigator reflect the combined influence of differences in analytical methods and natural variations.
The source of radium and radon in the hot-springs waters is not definitely known, nor have the waters been analyzed for the presence of other radioactive elements. The presence of radium and radon in the region is not peculiar to the waters of the hot springs. Waters from deep wells at Hope, 68 mi (109.4 km) southwest of Hot Springs, and at Prescott, 53 mi (85.3 km) southwest of Hot Springs, ranged in radon concentration from 0.05 to 1.88 nanocuries per liter (Kuroda, 1953). Waters from the warm and cold springs near Caddo Gap, 33 mi (53.1 km) west of Hot Springs, ranged in radon concentration from 0.13 to 1.85 nanocuries per liter (Kuroda, 1953). Cold springs in the immediate vicinity of Hot Springs also contained radium and radon. The U.S. Environmental Protection Agency reported a radon concentration of Happy Hollow Spring of 1.0±0.15 picocuries per liter and a radon concentration of Whittington Avenue Spring of 0.58±0.12 picocuries per liter. Kuroda (1953) reported the following radon concentrations, all in nanocuries per liter: Whittington Avenue Spring, 0.36; Whittington Park well, 0.03; Happy Hollow Spring, 0.74; and Sleepy Valley Spring, 4.37 and 2.80. In addition, Kuroda (1953) reported the radioactivity of four samples of rainwater ranging from 2.72 to 6.37 nanocuries per liter. Radon concentration of spring waters issuing near the uranium-vanadium-niobium bearing deposit is at Potash Sulphur Springs, 6 mi (9.65 km) southeast of Hot Springs, averaged about 15 nanocuries per liter (Arndt and Damon, 1953.)
| <<< Previous | <<< Contents >>> | Next >>> |
pp/1044-C/sec2.htm
Last Updated: 09-Mar-2009