|
NATIONAL PARK SERVICE
Visual Preferences of Travelers Along the Blue Ridge Parkway |

|
CHAPTER SEVEN:
HISTORICAL OVERVIEW AND LANDSCAPE CLASSIFICATION OF VISTAS AND RURAL LANDSCAPES ALONG THE BLUE RIDGE PARKWAY
Richard C. Smardon, Timothy R. Day, James F. Palmer, Tad Redway, and Lawrence Reichardt
State University of New York
Syracuse, New York
This chapter reports on two different contributions of the State University of New York (SUNY) College of Environmental Science and Forestry to the Blue Ridge Parkway study. The first is a brief historical analysis of vegetation management practices along the Blue Ridge area by people living there at different periods of time. Second, a professionally derived biophysical landscape classification system is presented and compared with Hammitt's perceptual classification described in Chapter 2. This classification is used to assess how representative particular scenes are of the overall set of scenes of the Blue Ridge Parkway.
Historic Vegetative Management Practices
Introduction to Historic Analysis
The initial construction funds for the Blue Ridge Parkway were allocated under the authority of the National Industrial Recovery Act of June 13, 1933. An act establishing the parkway under administration of the National Park Service was passed by Congress on June 30, 1936 (see Land Tenure Chart, Table 7.1). The idea of a Blue Ridge Parkway first began prior to World War I, but the concept of a scenic road connecting Shenandoah and Great Smoky Mountains National Parks developed mostly during the Great Depression.
Table 7.1. Land Tenure Chronology.
| Period | Geographic Location |
Land Tenure Practice | Ethnic Group |
Source(s) |
| Late 1600's | Virginia and Carolinas | plantation settlement, extensive agricultural practice, free-ranch of livestock, crude structures, cash cropping | English w/Scot/Irish servants | Stilgoe (1982) |
| Pre-1716 | Shenandoah Valley | timber burned to increase game habitats | Native Americans | Kercheval (1902) |
| Early 1700's | Appalachia | tree girdling, rough plowing between dead stands | Scot/Irish | Kercheval (1902) |
| 1718 Stilgoe (1982) |
Pennsylvania Great Valley North Carolina Piedmont and Blue Ridge |
small patch farming trees girdled—left standing or burned, corn and tobacco crops |
Scot/Irish | Graeff (1941) Opie (1980) Kercheval (1902) |
| 1775 | North Carolina | German movement continues from Pennsylvania into western counties and highlands of North Carolina | Germans | Bittenger (1901) |
| 1776 | Blue Ridge North Carolina |
Blue Ridge and Alleghenys open up for settlement by continental colonies | ||
| 1700's | Pennsylvania | permanent meadows were plowed, pasturing occurred May 1-Nov. 1, vegetable gardening on warm side of house, neatly fenced; efficient farm practices, tilled intensively, rotated crops, manured farmstead kept orderly and clean; frequently cattle and sheep turned into newly cut overland to subdue it for cultivation, prevailing practice was to pasture livestock on wornout field reverting to succession; fewer farmers laid down land in grass after taking two to four grain crops, upland meadows pastured several years before reverting to crop rotation; apple orchards common fences symbolize good farming | Germans | Long (1972) |
| 1700's | Pennsylvania | German farm distinguished from Scot/Irish by superior size of barns, plain compact form of houses, height of enclosures, extent of orchards, fertility of fields, luxuriousness of meadows, appearance of plenty and order | German | Rush (1875) Long (1972) |
| 1700—1800's | North Carolina and Toe Valley | naturalist Andre Michaux taught valley settlers how to prepare wild ginseng for the Chinese market | Scot/Irish | Sheppard (1936) |
| 1700—1800's | Appalachia | houses built on bottom lands near streams; slopes farmed (called perpendicular farming) | Scot/Irish | Weller (1965) |
| 1700—1800's | Appalachia | unfamiliar with manuring or soil conditioning; hillside patches cleared as lower fields depleted | Scot/Irish | Kollmorgen (1942) |
| 1700—1800's | Appalachia | principal crops, corn and tobacco | Scot/Irish | Weller (1965) Stilgoe (1982) Sheppard (1935) |
| Mid-Late 1800's | Blue Ridge North Carolina |
exploitation by lumber and mining companies result in large tracts of cut-out, burned-out, washed-out lands; feldspar and mica primarily, small operations. | Scot/Irish | Sheppard (1935) |
| 1935 | Blue Ridge North Carolina |
area consolidated and bought by U.S. Forest Service | Smathers (1982) | |
| 1952-Present | Blue Ridge | governance by National Park Service | Smathers (1982) | |
One of the prime goals then, as well as today, was to provide Americans with a living museum of natural and manmade form. The problem in pursuing this goal lay in the difficulty of maintaining the open quality along the Blue Ridge. Rapid vegetal growth from highly conducive environmental conditions can eventually block the visitors' view from the road.
The purpose of this section is to present (1) a clear picture of the most historically significant cultures of the Blue Ridge settlement, (2) the land management techniques used by native Americans and settlers, and (3) the relationship of these techniques, where applicable, to the management practices of the National Park Service today.
Blue Ridge Culture and Management Practices
The first known party to have explored the Blue Ridge Mountain area was DeSoto in 1560, followed by the Brickell Party in the 1730s (Smathers, 1982). In addition to finding Indians inhabiting the area, these explorers found a pristine landscape enscribed as "beautiful valleys covered with woods, pastures, and savannas" (see Land Tenure Chart, Table 7.1). They also found an extensive trail system developed by the Indians, particularly on the slopes and summits where they set up summer camps. Some evidence indicates that camp sites, referred to as "balds," still exist today because of their intensive use by Indians and later settlers (Mitchell, 1848; see Figures 7.1 and 7.2).
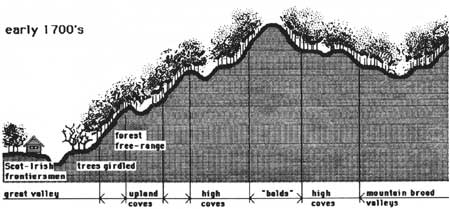
|
| Figure 7.1. Land use patterns in the Blue Ridge Mountains in the early 1700s. |
|
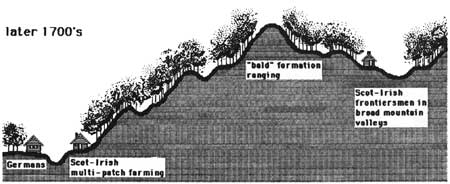
| Figure 7.2. Land use patterns in the Blue Ridge Mountains in the late 1700s. |
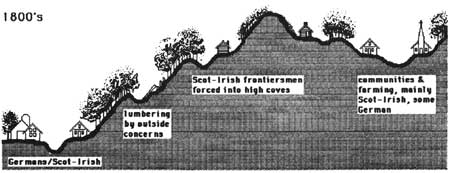
By 1850 the Blue Ridge was sparsely settled in isolated family farming units (see Figure 7.3). The land, like most of the South and Northeast at this time, was managed as large, irregular-shaped gardens rather than fields. Hillsides were cleared by girdling and burning for pasturing sheep, cattle, and mules (Stilgoe, 1982; see Figures. 7.2 and 7.3). In 1848 Mitchell explains that in addition to the Indian summer encampment, over-grazing may explain the "bald" formations.
|
| Figure 7.3. Land use patterns in the Blue Ridge Mountains in the 1800s. |
Most of the early mountaineers were agrarian. Consequently, the process of finding suitable lands for farming and pasturing involved the analysis of vegetative cover where scrub, grasslands, and coniferous trees indicated poor soils; hickory, walnuts, oaks, and honey locust indicated very fertile soils; chestnut indicated gravelly soils; and sycamore, red elm, and birch indicated loose valley soils (Stilgoe, 1982).
Among the early mountaineers, the Scot/Irish (see Land Tenure Chart, Table 7.1) rapidly adopted the Indian ways of cultivation. They used the simple technique of slash and burn but with no replenishment of the soil (Riddel, 1974). Following the Germans, they settled first in the bottom lands where soil and game were best. They seemed to prefer soils underlain by shale and avoided limestone altogether. However, after they moved into the smaller coves where the soil was shallower, widespread erosion led the U.S. Department of Agriculture (USDA) to proclaim 100,000 farms unfit for agriculture (Jolley, 1969).
Unlike the Scot/Irish, the Germans' goal was to own the land and manage it efficiently. They laid out and built barns and out-buildings in an orderly cluster separated from the house to maximize economy of effort. They chose land heavily timbered in hardwoods in valleys composed of limestone soils similar to their homeland (Long, 1972). They planted small gardens in which they grew vegetables, including beets, parsnips, radishes, carrots, leeks, cauliflower, parsley, asparagus, cucumbers, and peas. In addition, they usually planted orchards of fruit trees in the first cleared field. The Germans consolidated some of the abandoned cleared patches left by the Scot/Irish, and following their European traditions, allowed cattle and sheep to graze to subdue the land for several years prior to cultivation. After a period of intense tillage, crops were planted and rotated, followed by more manuring to increase its fertility. Cattle were routinely allowed to free-range after the fields became permanent.
Management Techniques
Each of these cultures—Indians, Scot/Irish, and Germans—carried its own land management ideas into the Blue Ridge, and each has determined how the Blue Ridge looks today. Our research indicates four major categories of utilization/management. They were sometimes used alone but most often in combination with other techniques.
Girdling. The most prevalent form of vegetative management during the mid-1800s to early 1900s was girdling, which was used primarily by the Scot/Irish. The technique involves simply removing a band or belt of a tree's bark and cambium layer inhibiting the flow of moisture and nutrients to the upper stems. The point in girdling is to eliminate the shade-producing canopy of the tree without removing the entire tree. This allowed grasses to grow for forage or cultivation.
Slash Burning. The goal of this German technique was to super-enrich the soil. Deciduous trees were felled in summer, and conifers were felled in winter. The limbs and slabs were then piled evenly across the ground and fired, singeing the soil. Then rye was planted and harvested. More limbs were spread and fired followed by a planting of grains. The technique was repeated every five or six years. A byproduct of burning was the resumption of successful growth. Large areas called "colicks" were formed after the fields became deficient and even today are composed of a dominant cover of compact heath shrubs.
Grazing. The early settlers raised a variety of domestic animals, including sheep, cattle, and mules. Because of the thinness of the upland soils, evidence indicates that many of the so-called "grassy" balds were maintained and extended by constant trampling. The succeeding grasses, mostly mountain oat grass (Danthonia ompressa) and the species Rumex acetosella, outcompeted most tree or shrub reproduction (Smathers, 1982).
Natural Selection. The natural selection process is exhibited by the ongoing emergence of plant species. It is seen most dramatically following severe disturbances such as cutting and burning, high winds, or soil erosion. For example, deep erosion can occur on the less fertile subsoils in the margins of old fields. Masses of heath or broomsedge and asters can compete with other grasses, and they usually replace them quickly in the warm months of the year.
Growing in sparse stands, broomsedge (Andropogon spp.), for example, survives as a monoculture until enough ground litter is produced to support other grasses and woody vegetation (Baker, 1972). At the time of this writing, the authors have not found enough reference material to indicate the length of time -efore other pioneering plants outcompete broomsedge on abandoned farmland. However, this native plant appears to have potential applications in a vegetation management policy for the parkway.
Broomsedge is a free-standing, narrow-stalked plant that does not pose the same entangling and overgrown characteristics of kudzu or other exotic woody pioneering plants. It thrives essentially as a monoculture outcompeting other pioneering species for available nutrients. It presents a fine-textured, uniform vegetal mass for an extended period of time. Its maintenance needs are minimal.
Summary
Any vegetative management technique used should be preceded by a thorough analysis of the goals and objectives to be accomplished and the environment in which the technique will take place. The practicality of the Park Service's goal to provide the viewer with a living museum is not discussed here but is taken as a given. Since the primary thrust of our research involved the human cultural aspect of viewing from the Blue Ridge Parkway, as discussed in Chapter 8, physical parameters should also be considered.
Basically, viewing from the Blue Ridge Parkway involves two major physical components: the position of the viewer and the scene to be viewed. The viewer position generally means either viewing at a scenic overlook standing or sitting, or viewing along the road while moving in a car. The speed of the car and the road configuration are important also because a view is more likely to be seen on a straight road at slow speed than on a curve. This also means that the amount of vegetation to be managed should be determined not only by what is viewed but also by whether the viewer is moving or standing still.
Once the analysis of physical parameters determines where vegetative management should take place, only techniques that are consistent with these parameters and other goals and objectives should be implemented. While girdling, cutting, and burning could be implemented and rationalized as management methods historically accurate to the Blue Ridge, the visual result of these techniques would probably have little chance of being publicly accepted. Grazing and natural selection, on the other hand, have potential applications.
We learned from parkway managers early in this study that the prime concern along the parkway is keeping vegetation from intruding into a scene. Techniques of controlled burning and cutting or mowing are required not only to keep long vistas open but also to maintain a defense against severe erosion on steep slopes in soils that are often thin, well drained, and of low fertility.
Although native broomsedge can serve as a visually-enhancing, historically accurate, and maintenance-free method of managing vegetation in areas of disturbed or nutrient-poor soils along the parkway, its universal application is questionable. Preparing roadside land for broom sedge introduction would mean deliberately engaging in poor soil management practices. Cleared land would have to be grubbed and constantly re-cleared, allowing nutrients to leach out of the soil. Serious erosion and sedimentation would no doubt result.
As discussed earlier, one of the environmental results of "cutting and burning" used by the Germans to enrich the soil was the formation of "colicks" Another environmental result found in this study centers on the formation of what is known as the Blue Ridge "balds." While much speculation surrounds the origin of the "balds," many investigators believe they were caused by a combination of intense use by the early settlers, including overgrazing, on thin, fragile soils (Smathers, 1982; Wells, 1937).
The dilemma these examples pose is obvious. The abuse of the soil to control vegetal growth and promote the growth of more compact, self-maintaining plant species may or may not be advisable in all management situations. Additionally, little research exists documenting the process required for the controlled abuse of soil to regulate vegetation height.
Clearly, a more practical approach would be to use specific types of native plants. Basically, they should have characteristics adaptable to the existing environment, including the soil and micro-climate. Their physical characteristics should be compatible to the surrounding vegetal and topographic context of the view. Bailey (1978) classifies the Blue Ridge Parkway area as within the Eastern Deciduous Forest Province of the Hot Continental Division and the Humid Temperate Domain. Perennial vegetation should contain the following characteristics: First, since most soils on steep slopes and ridge lines are thin and low in nutrients, plants should be shallow-rooted, fibrous and able to absorb and hold nutrients for extended periods of time. Second, since the climate is humid and temperate and rainfall is abundant, plants should be able to withstand the potential erosive effects of heavy rainfall, snow, and sedimentation.
Physically, plants should be complementary in terms of form, size, and texture. More importantly, the height of the plant should be self maintaining and predictable because placement on a given slope with respect to the viewer position is crucial in maintaining the desired view. In most cases, native grasses such as broomsedge could be used in near foreground areas; but if the slope falls away sharply, native shrubs with a stronger root system should be used.
Landscape Classification
Introduction
When asking subjects to respond to certain images delineating vegetative management alternatives, one needs to know how representative these scenes are of the entire Blue Ridge Parkway. Over 250 scenic overlooks have been established along the 470 miles of the parkway. Because of logistical and financial constraints, as well as the tolerance levels of questionnaire respondents (Zeisel, 1981), simulation of vegetation management techniques at every overlook was beyond the scope of this project. Therefore, it became necessary to select several overlook scenes representative of the range of visual experiences encountered along the entire parkway.
To begin this selection process, we obtained a library of Ektachrome slides from the University of Tennessee. The photographic library of 298 slides contained a shot from each of the established parkway overlooks and a number of duplicate photographs made to compensate for poor lighting conditions or technical problems.
Our slide selection process involved four sequential steps:
1. Formulation of a landscape classification system.
2. Classification of each of the slides in the photographic library.
3. Grouping of overlook scenes based on similar landscape components.
4. Selection of 1 or 2 representative slides from each of the established groups of overlook scenes based upon degree of photographic quality and suitability for simulation purposes.
Each of these four steps is explained in greater detail.
Formulation of a Landscape Classification System
The first consideration was to determine the classification methods most appropriate for the grouping and selection of scenes most representative of the variety of overlook scenes along the parkway. A review of the existing literature in visual analysis revealed that several classification systems had been specifically developed for mountainous regions (Elsner and Smardon, 1979). However, most of these were designed to determine relative levels of scenic quality. Clearly, scenic judgments are simply too limited for broadly describing the nature of the distinct landscape types inherent to the Blue Ridge Mountains. Most mountain landscape classifications were formulated for ranges in the western United States. Topographic relationships, vegetation, and atmospheric effects differ dramatically between the eastern and western mountain landscapes. Many of these approaches could be used as references or models, but direct application to the Blue Ridge problem was inappropriate. A classification system would have to be tailored to the specific characteristics of the Blue Ridge Mountains.
A second supposition critical to the development of an appropriate classification method involved the issue of reliability. The system would have to be formulated so that the same results would be produced regardless of who the reviewer was or the number of times the slide library was subjected to examination. Related to this issue was the recurring problem of insuring that objectivity was maintained during classification procedures.
Our classification approach is based on the precept that the visual character of the physical landscape is determined primarily by: (1) the nature of the landscape's topography and (2) the type of natural and/or man-made cover overlying that terrain (Anderson, 1979). The interaction of the form, line, color, and texture of the landforms and the land cover/land-use produce a multitude of visual patterns that can be categorized on the basis of their similarities and distinctions. It is a biophysical classification that may be compared to Hammitt's perceptual classification (Chapter 2).
Most of the documented applications for similar systems have involved classification of physiographic landscapes at a larger regional scale. Although the Blue Ridge Mountains represent one such physiographic landscape (North Atlantic Regional Water Resources Committee, 1972), we needed a classification method that would be effective in discerning landscape distinctions at a smaller scale within the Blue Ridge context.
The landscape series/unit framework is essentially a method for analyzing three-dimensional landscape character from a two-dimensional planimetric data base. In addition, the system presumes that the landscape character will remain essentially similar regardless of where a potential observer stands within the specific series/unit type. Clearly, this assumption is justified when the system is used for general landscape planning purposes at a larger scale. However, for describing landscape character from specific observation points with views of three-dimensional space, these assumptions are inappropriate. The work of Gibson (1979), Felleman (1979), Litton (1968), and others indicate that depending on such environmental factors as viewing height, sight line orientation to the landscape, interposition of landforms and objects, as well as factors affecting the mechanics of vision such as distance and atmospheric clarity, landscape elements may not be perceived by the observer as they actually exist. For example, a highly serrated ridgeline with gentle side slopes that is in the background of the observer's picture plane and oriented parallel to the viewer's sight line may, in fact, appear to be a series of steep individual peaks because of the degradation of visible detail occurring with distance and the impact of atmospheric effects. Similarly, the spatial enclosure of a valley may be perceived to be considerably less than it actually is because of visual reduction of scale occurring as the viewer's height increases above the terrain.
With these basic suppositions in mind, we examined the existing landscape literature in an attempt develop a classification system. Since the slide library revealed a broad spectrum of vegetation types, land uses, and terrain, we determined that the framework of our classification system should be modeled on the landform series and land use/land cover unit system employed by Anderson (1979), Smardon and Mahon (1980), and the 1972 North Atlantic Regional Water Resources Study (NAR). In an effort to understand the variables affecting perception of three-dimensional landscape character, we developed a series of "form modifiers" that were incorporated into the classification matrix (see Figure 7.4). These form modifiers assumed four basic positions in the system:
1. Viewer position of the overlook scene in context to the surrounding landscape.
2. Division of the picture plane into three distance zones—foreground, midground, and background.
3. Established dimensions describing the spatial configuration of objects and open spaces in the land cover/land use units.
4. Axial orientation of terrain to the viewer's sight line in the landform series.
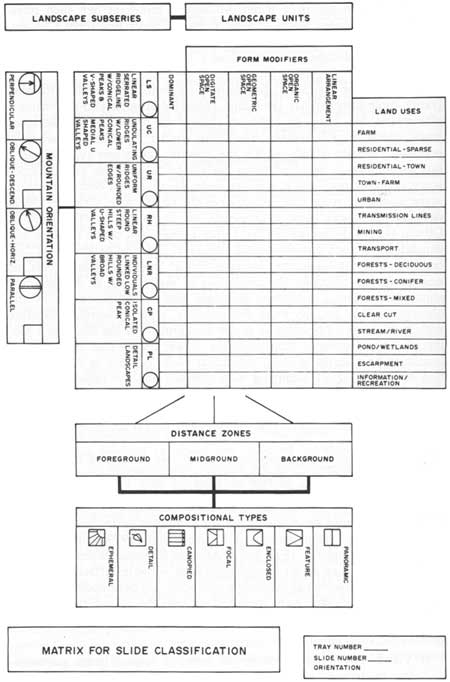
|
| Figure 7.4. Matrix for slide classification. |
Furthermore, in a three-dimensional viewing experience, the landscape, as a holistic entity, exhibits a particular compositional character. Litton (1968) documented seven specific landscape compositional types that recur among all forested environments which, in turn, are supported by perceptual research findings. Since Litton's compositional classification scheme represented a potential dimension for grouping similar overlook scenes, it was incorporated into our Blue Ridge Classification System as well.
Definition of Components of the Classification System
The finalized classification system, as shown in Figure 7.4, operated on five levels and two sublevels of analysis: (1) viewer position, (2) compositional types, (3) distance zones, (4) land cover units and the sub-unit form modifiers, and (5) landform series and the landform orientation sub-series. For purposes of clarity and potential future application of the system, the criteria for each of the identified dimensions are presented in detail.
Viewer Position. As previously discussed, the observer's position in relation to the landscape view is critical to categorizing the type of visual experience encountered. Adapted directly from Litton's typology, three conditions are recognized (Figure 7.5):
Viewer inferior—the viewer is essentially below the surrounding landform.
Viewer normal—an essentially level sight line is maintained by the viewer to survey the landscape.
Viewer superior—conditions under which the observer's sight line drops below the level sight line to peruse the surrounding terrain.

|
| Figure 7.5. Viewing positions (after Litton, 1968). |
Compositional Types. Again, Litton's typology was directly applied to this classification section. Each type is only briefly defined here. For a more comprehensive explanation of each type, refer to USDA Forest Research Paper PSW-49 (Litton, 1968).
Panoramic Landscape: Line emphasis in the picture plane is essentially horizontal. View is essentially unbounded; both distance and peripheral vision are unencumbered.
Feature Landscape: Domination of the landscape by a strong visual element(s) (usually vertical) while the remainder of the landscape is visually subordinate.
Enclosed Landscape: Counterpart of the feature, this landscape is represented by "bowl-like forms with a continuity of sides around a central base plane."
Focal Landscape: The parallel alignment of lines, objects, or land forms that appear to converge upon a single focal point at the horizon.
Canopied Landscape: The predominance of views in which the forest upperstory or canopy provides a visual overhead plane.
Detailed Landscape: Scenes of a very small scale in which detailed components such as individual rocks, plants, water, and animal tracks occupy the observer's attention, while the surrounding landscape context is usually not visible.
Ephemeral Landscape: Dynamic, transitory effects that significantly alter or dominate the visual character of the landscape. Weather conditions, atmospheric conditions, light and reflections represent the most common ephemeral effects.
Panoramic, Feature, Focal, Enclosed, and Detailed landscapes constituted the fundamental or larger-scale compositional types identified in the Blue Ridge slide library. Canopied and Ephemeral landscapes usually served as secondary types or compositional qualifiers. As such, any particular scene could be classified by more than one type. An example would be an isolated peak wreathed with a blue atmospheric haze that might be categorized as both a Feature and Ephemeral landscape. This dual classification was not limited to secondary compositional types. In several cases during pre-test, various scenes appeared that could not be adequately described by one of the primary landscape types. Rather than roughly "pigeon-holing" the scene, it was decided that two primary types could be cited if the scene exhibited approximately equal attributes to the two compositional categories. Theoretically, one unusual overlook scene could be classified with two fundamental compositions and the two secondary types. During the process of classifying the slide library, no more than two primary and one secondary types were ever encountered.
Distance Zones. Distance of the observer from elements in the three-dimensional landscape is critical to how the viewer perceives the character of the visual display. A universally recognized axiom states that as sight-line distance increases, the visual significance of surface features (both in form and texture) decreases (Gibson, 1979). In response, visual resource managers have commonly divided the visible picture plane into three distinct distance zones derived from art definitions—foreground, midground, background. Boundaries separating these three zones in measurable distances have varied significantly between physiographic regions and individual researchers.
Although the Forest Service and the Bureau of Land Management have prescribed specific sight line distances for western landscapes, Felleman (1982) warns that significant differences between landform relief, vegetation types, and ambient atmospheric conditions make it inappropriate to apply these same standardized distances to forest environments in the eastern United States. Felleman proposes that in lieu of standardized distances, distance zone criteria be established for each regional area.
This suggestion is applicable to the Blue Ridge range, where dynamic fluctuations in atmospheric haze can play havoc with both perceived and real sight distances on a day-to-day basis. Under these conditions, we determined that standard measured distances were irrelevant. Rather, distinctions of visible clarity as indicated by standard elements in the landscape proved to be a more accurate approach to resolving the distance zone problem.
Litton (1968) and Bailey (1978) proposed descriptive characteristics specific to each of the distance zones. Foreground is defined as the part of the visual field containing the observer where maximum discernment of color, scale relationships, and landscape detail is possible. Mid-ground is characterized mainly by the emergence of overall shapes and patterns in the landscape, visual discernment of the relationships between landscape units, the visual simplification of detail into texture, and the potential for aerial perspective. Background areas are classified as the sector of the picture plane where extreme visual simplification of landscape elements reveals only outlines of shapes, little to no texture, and color reduced to monochromatic hues distinguished by light and dark tones.
Armed with these criteria, we examined approximately 80 slides to establish concise, reliable, and replicable standards for determining distance zones. Being the predominate land cover of the Blue Ridge range, woody vegetation was initially identified as the one indicator. After repeated analysis, a recurring pattern developed in which the emergence of overall landscape patterns and vegetation texture coincided with that visual threshold at which individual leaves and branch complexes of vegetation were no longer discernable. Similarly, a second visual threshold was observed at the reduction of vegetation texture and the recognition of only landform outlines and tones of monochromatic colors. Consequently, the following definitions were established for each distance zone in this classification:
| Foreground: |
The sector of the picture plane from the observer to the point at which individual leaves and/or vegetation branches were no longer discernable. |
| Midground: |
The section of the view from the point where individual leaves/branches are discernable to the point where texture in vegetation masses is no longer discernable. |
| Background: |
From the textural threshold to the horizon line. |
Land Cover/Land Use Units
The land cover/land use unit continuum was developed directly from repeated examination of the slide library. Every type of man-made land use and natural land cover observed from the slides was recorded and then consolidated into the following classes:
| Farm | — | all structures including barns, sheds, farmhouses, fences, livestock, mechanized equipment, and open spaces, whether in pasture, fallow, or cultivation, usually associated with agricultural activities. Gardens in the backyards of residential dwellings not associated with any of the above criteria were not included in this category. |
| Sparse Residential | — | all residential structures (single-family and two-family) and contiguous yard areas not associated with agricultural uses. Density of structures is limited to scattered development with no more than six units in close proximity to one another. Multi-family units were indiscernable from the slide library. |
| Town | — | all residential and non-residential structures exceeding the six-unit criteria in the sparse residential category. Land use patterns exhibited in the slide library appeared as either scattered single dwelling units or clustered hamlet development. The hamlet pattern was designated in this category. All roads, driveways, and visible sidewalks and paths with associated vegetation were also collapsed into this category. In most cases no more than four roadways were evident. Clustering usually occurred around one principal highway. |
| Town/Farm | — | similar to the land pattern exhibited in the town classification with the exception that agricultural uses were evident within and/or immediately surrounding the hamlet center. |
| Urban | — | high density residential and non-residential development, rectilinear layout of streets, more than four visible streets, and limited amounts of open space. |
| Transmission | — | high voltage transmission lines suspended from towers exceeding the height of residential utility poles; radio towers. |
| Mining | — | land subjected to either active or inactive strip mining and quarrying procedures. All associated structures, processing equipment, utility service, and access roads were included in this category. |
| Transport | — | all highways and roads not directly associated with any previously defined category or the Blue Ridge Parkway; railroad lines and their appurtenant structures were included. |
| Deciduous Forest | — | all wildland forests not associated with human uses (such as windbreaks, street and yard trees, and buffers) and dominated by deciduous species. |
| Coniferous Forest | — | all wildland forests not associated with human land and dominated by coniferous species. |
| Mixed Forest | — | wildland forests not associated directly with human land uses and containing at least a 70%/30% mixture of both deciduous and coniferous species. |
| Clear-Cut | — | open space in forested stands where evidence exists that lumbering activities have occurred. |
| Stream/River | — | all observable watercourses in which photographic evidence suggests channelized water movement. |
| Pond/Wetland | — | all observable impounded water bodies and wetlands. |
| Escarpment | — | open space containing rock outcrops formed by natural geologic processes. |
| Information/Recreation | — | all informational signs, recreational and informational structures (such as information booths, rest rooms, interpretative centers associated with developed recreational areas), open space developed for recreational activities including hiking and bicycle trails, picnic tables, etc. |
| Blue Ridge Parkway | — | incorporating both the pavement and mowed shoulders of the parkway. |
Spatial Characteristics. As previously discussed, the unit modifiers were designed to identify those three-dimensional factors that characterize the land cover/land use units within the visual field. Ideally, these modifiers could include such dimensions as form, line, color, texture, scale, spatial enclosure, and edge definition. However, because of a variety of circumstances, it was either unnecessary or infeasible to consider all these factors in establishing the parameters of the modifiers.
Land cover in the Blue Ridge range is dominated by dense stands of mature, second, and third-growth woody vegetation. As a result, non-forested land cover appears as open space carved out of the woodland carpet. Most of these non-forest land use/land covers appeared in the midground-background zones of the slides. Consequently, reduction of visual clarity and recognition resulting from distance and atmospheric effects made color, form, scale, and, to a degree, textural attributes considerably less distinguishable and, therefore, less of a factor in determination of landscape character. The configuration and complexity of open space and the edge definition at the forest/non-forest interface remained considerably clearer, and therefore, a more potent factor to characterizing the landscape.
Newby (1971) and other researchers seem to substantiate this observation. Edge definition is recognized as one of the principal sources in the landscape critical for spatial organization and information processing.
Based on our examination of scenes in the slide library, the following unit modifier categories were formulated:
| Linear Space | — | the land cover is observed in the visual field to be aligned in a linear corridor. Originally, this modifier was further subdivided into linear and curvilinear categories. However, in the interest of maintaining a manageable set of variables, the two conditions were later collapsed into one category. |
| Geometric Space | — | land cover appearing in geometric form with angular edge definitions. |
| Organic Space | — | land cover assuming an organic configuration. Edges are not angular but predominated by arcs. Edges are fairly regular and not overly complex. |
| Digitate Space | — | land cover is essentially organic, yet edge is highly complex, punctuated by islands and peninsulas of forest protruding into the open space. |
| Dominant | — | the space occupied by the land cover/land use is dominant in the visual field and may be punctuated by other land covers of one of the preceding unit modifiers. For the most part, the forest seemed to exclusively occupy this category. |
In rare situations in which forest was not the dominant land cover, the above categories still applied to the configuration and edge condition of the land.
Landform Series
The North Atlantic Regional Water Resources study (1972) identifies only two distinct topographic series for the Blue Ridge Mountains: (1) linear, rounded hills of varying height and (2) continuous linear ridges with occasionally scattered peaks. Derived from planimetric topographic maps, these descriptions do, indeed, summate the general, regional morphology of the range within the context of the eastern United States. However, within the context of the Blue Ridge Mountains, a broader spectrum of distinct landform types is encountered. The need for a more inclusive landform series is further substantiated by the fact that visual distortions produced by dramatic atmospheric effects and the observer's position within the three-dimensional landscape can present a perceived image of landform that differs significantly from the actual form of the terrain.
In an effort to develop a landform series applicable to the overlook scenes, the research team took the same approach that was used to formulate the land cover/land use units. The slide library was examined, and every perceivable landform type was inventoried. Over twenty categories were established. Upon pretest, it became evident that an unwieldly number of variables were being generated and a number of landform associations (especially certain valley-hill complexes) were recurring. The original 20 landform categories were collapsed into the following nine categories (see Figure 7.6):
Linear serrated ridgelines with conical peaks and intervening v-shaped valleys.
Undulating ridgelines with flanking lower, secondary conical peaks. Valley forms occupied a medial range between v-shaped and u-shaped.
Uniform ridgelines with rounded edges. No concave forms were associated, since these ridges were usually observed to be perpendicular to the overlook sight line. Thus, valleys were not visible because of interposing land forms.
Linear, steep, and rounded hills with u-shaped valleys. Often, these valleys were connected to broader flatlands.
Individual and linked, low rounded hills, usually associated with broad valleys.
Broad valleys with gentle, rolling floors.
Broad valleys with flat floors.
Side slopes—this series developed in response to the limited cone of vision inherent in the format of 35-mm photography. Often spurs from ridgelines, or the slope falling away from the overlook site would appear in the slide frame without revealing the nature of the parent landform.
Detailed landscapes—this category accommodated all scenes in which close-up views of signs, water courses, and forest pathways showed no discernable landform pattern.
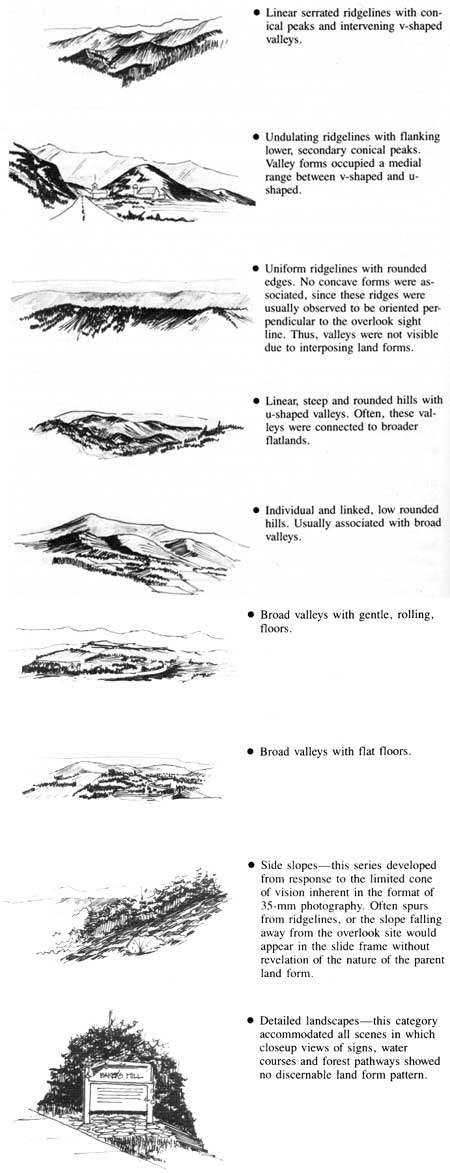
|
| Figure 7.6. Landform categories for the Blue Ridge Mountains. |
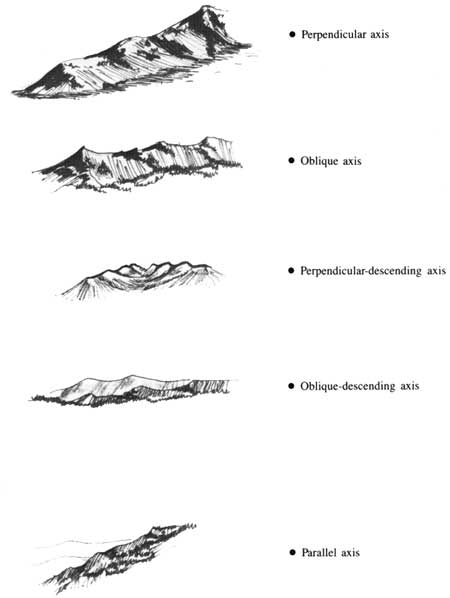
Landform Orientation. The need for providing series modifiers arose from a recognition that the landform categories could provide a generic description of the basic form but failed to account for the manner in which these forms were arranged in three-dimensional space. Different arrangements and juxtapositions of landforms in relation to the viewer's sight line created different landform textures, spatial enclosure, and ridgeline vividness—hence, different landscape characteristics.
Our analysis proposed that the identification of landform orientation in relation to the observer would serve as the principal indicator in differentiating landform series arrangements. For example, undulating ridgelines parallel to the line of sight revealed interposed valleys. The scene would be marked by an accentuated spatial enclosure. In addition, the axial lines of parallel ridgetops and valley floors would lead the viewer's sight through the scene. Conversely, the same undulating ridges perpendicular to the sight line obstruct the view into interposed valleys, resulting in less evidence of enclosed space and the creation of strong horizon lines. Oblique landforms represent the median between parallel and perpendicular.
The landform modifiers defined for the classification system include (see Figure 7.7):
Perpendicular axis
Oblique axis
Perpendicular-descending axis
Oblique-descending axis
Parallel axis
|
| Figure 7.7. Land form modifiers for the land form categories of the Blue Ridge Mountains. |
Operation of the Classification System. The presence or absence of all elements in the final classification system was noted. We began the process by first determining the viewer position and the appropriate compositional type(s). Next, boundaries between the three distance zones were established. Beginning with the foreground of the picture plane, observations of land cover/land use units and corresponding modifiers and then the landform series and corresponding modifiers were checked off if present within the distance zone. This rating process was then replicated for the midground and background distance zones. Hypothetically, each overlook scene could contain 446 classification characteristics or variables.1
1The number of variables in the classification system totaled 446. Although, hypothetically all compositional types, land cover units and landform series variables could be observed in a single scene, only one viewer position was possible.
The binary rating approach served two basic purposes: (1) to minimize the opportunity for the researcher's personal biases to enter into the system and (2) to process a large slide sample in the shortest amount of time. By simply confining the range of the researcher's input to either "observed" or "not observed," the binary system offered a high degree of objectivity. In addition, definite boundaries between variables were established from the onset, thereby increasing the replicability and reliability of the system.
It should be noted that an alternative rating procedure was considered, in which the slides would be projected onto a uniform grid target, and physical measurements of the landscape variables could be quantified. Although this alternative method would have provided a finer-grain dimension in the differentiation of landscape character, it was abandoned because of the prohibitive amount of time required to quantify 446 potential variables in a sample of 298 cases.
Classification of the Slide Library
Setup. Prior to the classification of each scene in the slide library, several setup procedures had to be completed. The slides (N = 298) were rearranged and numbered in the sequential order that a motorist, traveling south from the parkway entrance in Virginia, would encounter each overlook. Each slide was then assigned a copy of the classification form (see Figure 7.4) and labeled with the corresponding identification number.
Classification Procedures. Two researchers were each assigned the responsibility of classifying one-half of the slide library (including duplicates) using the binary rating system and criteria outlined previously. Upon completion of this task, the two researchers exchanged their classified forms and slides in order to check for reliability and replicability. In the few instances in which a rating disparity arose, the entire research team was assembled to arrive at a solution.
Discussion. As expected, unaccounted gray areas between certain variables did arise during the classification procedure—especially among the land cover/land use units. These problems occurred mostly in the mid-background in which distance and atmospheric effects obscured the land cover/land use character of open spaces. In such cases, dual modifiers were assigned (e.g., forest-dominant-digitate open space).
Although a statistical analysis was not conducted, the results of an interobserver reliability check seemed to show little variance between the ratings of the two researchers. This observation indicates that after a brief training period, the system affords a high degree of reliability and consistency. More extensive tests involving a larger sample of raters will be necessary to further substantiate the replicability of the classification method.
Comparison of Hammitt's Landscape Typology to Bio-Physical Classification
While our bio-physical landscape classification system attempted to keep track of multiple variables involved with viewer position (3), land cover/land use types (17), spatial characteristics (5), landform types (9), and landform orientations (5) Hammitt's system essentially broke the Blue Ridge Parkway into three sections and by factor analysis of viewer responses generated four major vista dimensions with each of the sections (see Table 7.2). Thus, Hammitt's system is not as much a landscape classification as a typology of major psychometric vista dimensions that may or may not relate to the many bio-physical factors previously listed. Clearly, many of the vista dimensions do relate to landform and vegetative and land use cover. It would clearly be desirable at some point to try to correlate bio-physical variables against psychometric vista dimensions to attempt to find significant relationships. By knowing these relationships, researchers and managers would know which environmental factors would be important to inventory or monitor for the optional management of the Blue Ridge Parkway.
Table 7.2. Hammitt's landscape sections and vista dimensions (from Chapter 2)
Northern Section Several-Ridged Vista Valley Development Vista Unmaintained Vista One-Ridged Vista Middle Section Pond/Lake Vista Rolling Plateau Vista One-Ridged Vista Unmaintained Vista Southern Section Stream/River Vista Farm Valley Vista Ridge and Valley Vista Unmaintained Vista |
Selection of Images for Vegetative Management Simulations
Determining what slides (views) were suitable for simulation purposes was based largely on foreground vegetation. To simulate the results of possible vegetation management techniques, it was important to choose views (slides) that contained as much foreground plant material as possible. By using views that show vegetation from the ground to the crown (top), a more accurate simulation could be produced than by using views that just show the tops of plants. For example, if one vegetation management option showed controlled burning of shrubs, and the original view contained just the crowns of the plant material, then the simulation of burning would not portray the total effect of the burning. The effect on surrounding grasses and plants and the appearance of the ground could not be simulated.
Foreground Vegetation Suitability. The first phase in determining the suitability of foreground vegetation for simulation involved area measurements of all slides. The foreground vegetation in each slide was measured as a percentage of the entire scene. The slides were projected onto a grid. The number of grid sectors with foreground vegetation in them was then counted. If less than 1/3 of the sectors was filled with foreground vegetation, the view (slide) was eliminated from further consideration for simulation. The 1/3 rule was used for several reasons. First, if less than 1/2 of the slide showed foreground vegetation, the view could be overpowered by the emergent background scenery during a simulation of vegetation removal. The view might then be judged on the quality of the background and not on the management technique that was simulated. Second, to start eliminating some of the 298 slides from consideration, the 1/3 rule proved to be effective in reducing the number of possible slides for simulation to a manageable number. The slides that contained more than 1/3 foreground vegetation were then classified according to our foreground vegetation suitability index (Figure 7.8).
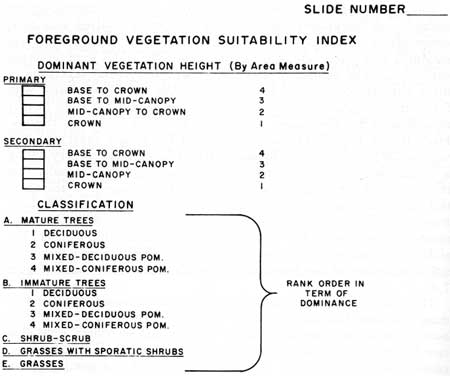
|
| Figure 7.8. Foreground vegetation suitability index. |
The foreground vegetation suitability index accomplished several things. It identified the amount of vegetation that could be seen from base to crown to crown alone in the primary and secondary vegetation (see Figure 7.8). It used a grid system to determine the dominant vegetation. The vegetation was then classified in order of dominance for easy reference and comparison of vegetation without viewing the grass as the dominant foreground vegetative feature, shrubs or shrub growth as secondary foreground vegetation, and mature deciduous trees as the third most dominant (see Figure 7.8).
As stated before, views that showed the vegetation from base to crown were determined to be the most applicable for simulation. The final phase for foreground vegetation suitability was the grouping of slides in two final categories. The first category included all the slides that had base to crown in both the primary and secondary foreground vegetation. This category was the most suitable for simulation according to foreground vegetation. The second category contained the slides with base to crown in either the primary or secondary foreground vegetation and base to mid-canopy in either or both the primary and secondary foreground vegetation. This category was marginal for simulation. In the final analysis, 10 slides were determined suitable for simulation according to foreground vegetation, and 21 slides (views) were marginal.
Frequency Analysis for Representation of Visual Elements. Using the Statistical Analysis System (SAS) computer program, frequencies were calculated for all 298 views and for the 10 slides used for simulations. The frequency tabulations provide an analysis of the individual elements incorporated in each composition determined through the classification matrix.
Under the landscape classification system (Figure 7.4), 443 possible elements existed for the make-up of each composition. There was the possibility of eight compositional types; 255 possibilities existed through the combination of three distance zones, five form modifiers, and 17 land uses; 180 possibilities existed through the combination of three distance zones, five series modifiers, 10 landscape series, and finally three viewer positions. Frequency analysis provided the number of observations for each element (the number of times an element was used) and the frequency for that element (the percentage of times the element was used to the number of total observations, 288 or 10). For example, out of the total 298 slide library, there was a total of 86 slides with a panoramic composition, for a frequency of 29.8%. This indicated to us that three (or 30%) of the final 10 slides used for simulation should also have a panoramic composition. Actually only one slide out of the 10 (10%) had a panoramic composition. From the results of the foreground vegetation suitability index, we only had 10 suitable slides to work with; if a certain element was missing, we had no way to substitute for it. We also had no way of determining if the original 298 slides showed an accurate representation of the views from all the scenic overlooks along the Blue Ridge Parkway. Without this knowledge we could not be sure that our simulations were an accurate representation. We did know that views from the majority of overlooks were photographed, but we did not know if the views were fully representive. Therefore, we needed the frequency analysis as a means to determine what, if any, elements were not represented in the simulation photos.
Out of the possible 443 elements, 99 were used to make up the composition of the original 298 slides, and 31 of those were used in the final 10 simulations. Therefore, 68 elements were not represented in the simulation photos. Of these, only five with an original frequency of 10% or more were not represented. They are: (1) organic green open space in the midground (which had a frequency of 12.4% out of the 298 original slides), (2) linear transportation in the midground (14.4%); (3) organic deciduous forest in the foreground (12%); (4) perpendicular rolling broad valley in the midground (10%); and (5) perpendicular linear serrated mountains in the background (23.3%). Out of these, transportation, rolling broad valleys, and linear serrated mountains were the only elements over 10% which were not represented one way or another in the simulations. Green open spaces were represented in the simulation seven times with different form modifiers or distance zones, and deciduous forests were represented 16 different times but not in an organic form in the foreground. The frequency counts show that a majority of elements (73.2%) that were above 10% were represented in the simulation; the counts also indicate those elements that showed up the most. Additional statistics are available in Table 7.3.
Table 7.3. Landscape classification percentages.
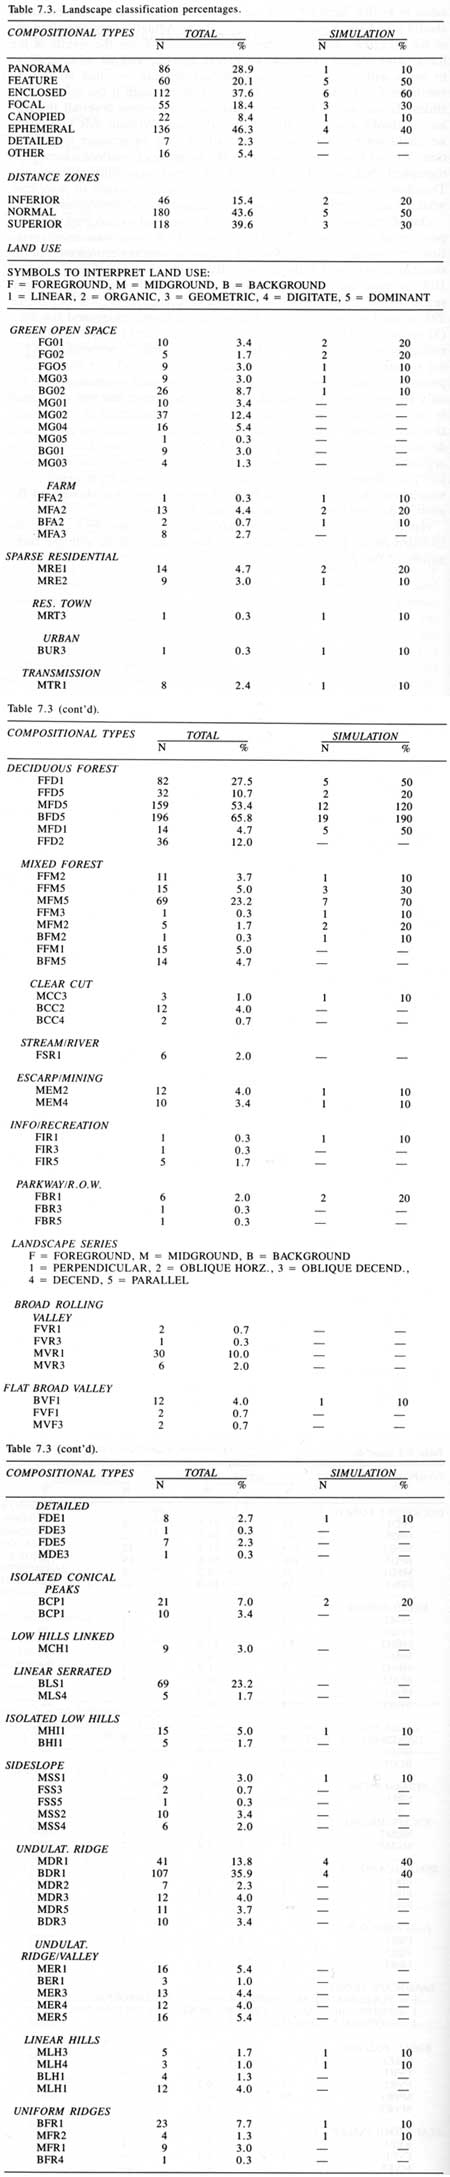
(click on image for a PDF version)
Having laid the groundwork in this chapter for selecting scenes to be included in the photo simulation, the next chapter deals with the techniques of the photo simulation process.
REFERENCES
Anderson, P.F 1979. Analysis of landscape character for visual resource management. In G.H. Elsner and R.C. Smardon (Tech. Coord.), Our National Landscape.
Baker, W.A. 1972. The Blue Ridge. New York, New York: Viking Press.
Bailey, R.G. 1978. Description of the Eco-Regions of the United States. Washington, D.C.: U.S. Department of Agriculture, Forest Service.
Bittenger, L.F 1901 (republished 1968). The Germans in Colonial Times. New York, New York: Russel and Russel.
Bolton, C.K. 1967. Scotch-Irish Pioneers in Ulster and America. Baltimore, Maryland: Geneological Publishing Co.
Elsner, G.H., and R. C. Smardon. (Tech. Coord.). 1979. Our national landscape: proceedings of a conference on applied techniques for analysis and management of the visual resource. Incline Village, Nevada, April 23-25, 1979. USDA Forest Service Gen. Tech. Rpt. PSW-35, Pacific Southwest Forest and Range Experiment Station, Berkeley, California.
Felleman, J.P. 1979. Landscape Visibility—Theory and Practice. Syracuse, New York: School of Landscape Architecture, State University of New York.
Felleman, J.P. 1982. Visibility mapping in New York's Coastal Zone: A case study of alternative methods. Coastal Zone Management Journal 9: 249-270.
Ford, H.J. 1966. The Scotch-Irish in America. Camden, Connecticut: Archon Books.
Gibson, J.J. 1979. The Ecological Approach to Visual Perception. Boston, Massachusetts: Houghton Mifflin.
Graeff, A.D., et al. 1942. The Pennsylvania Germans. Princeton, New Jersey: Princeton University Press.
Jolley, H. 1969. The Blue Ridge Parkway. Knoxville, Tennessee: University of Tennessee.
Kercheval, S. 1902. History of the Valley of Virginia. Woodstock, Virginia: W.N. Grabill.
Kollmorgen, W.M. 1942. The Pennsylvania German Farmer. In A.D. Graeff et at. The Pennsylvania Germans. Princeton, New Jersey: Princeton University Press.
Litton, R.B., Jr. 1968. Forest landscape description and inventories: a basis for land planning and design. USDA Forest Service Research Paper PSW-49, Pacific Southwest Forest and Range Experiment Station, Berkeley, California.
Long, A., Jr. 1972. The Pennsylvania German Family Farm. Publications of the Pennsylvania German Society, Vol. 6. Breings, Pennsylvania: The Pennsylvania German Society.
Mitchell, E. 1835. Notice of height of mountains in North Carolina. American Journal of Science and Arts 35: 378p.
Newby, F.L. 1971. Understanding the visual resource. In Forest Recreation Symposium. Northeast Forest Recreation Experiment Station. Upper Darby, Pennsylvania. 68-72pp.
North Atlantic Regional Water Resources Study Coordinating Committee. 1972. Appendix N: Visual and Cultural Environment. Prepared by Research Planning and Design Associates, Inc. for North Atlantic Regional Water Resources Study Coordinating Committee, New York, New York.
Opie, J. 1981. Where American history began: Appalachia and the small independent family farm. In W. Somerville (Ed.), Appalachia/America. Proceedings of the Appalachian Studies Conference, Boone, TN. East Tennessee State University, The Appalachian Consortium Press.
Palmer, J.F. 1983. An investigation of the conceptual classification of landscapes and its application to landscape planning issues. In S. Weidemann & J.R. Anderson (Eds.), Priorities for Environmental Design Research, Part 1. Washington, D.C.: Environmental Design Research Association.
Palmer, J.F. 1983. Assessing coastal wetlands in Dennis, Massachusetts. In R.C. Smardon (Ed.), The Future of Wetlands: Assessing Visual-Cultural Values. Totowa, New Jersey: Allenheld-Osmun Co.
Riddel, F.S. (Ed.). 1974. Appalachia: Its People, Heritage, and Problems. Dubuque, Iowa: Kendall/Hunt Publishing Co.
Sheppard, M.E. 1935. Cabins in the Laurel. Chapel Hill, North Carolina: University of North Carolina Press.
Simpkins, O.N. 1974. The celtic roots of Appalachian culture. In F.S. Riddel (Ed.), Appalachia: Its People, Heritage and Problems. Dubuque, Iowa: Kendall/Hunt Publishing Co.
Smardon, R.C., and T. Mahon. 1980. Forests in the visual landscape. Resource Planning Assessment Report No. 14, N.Y. State Department of Environmental Conservation, Bureau of Forests and Resource Management, Albany, New York.
Smathers, G. A. 1982. Man as a Factor in the Southern Appalachians: Bald Formation and Illustrations of Selected Sites along the Blue Ridge Parkway in North Carolina. U.S. Department of Interior, National Park Service.
Stilgoe, J.R. 1982. Common Landscape of America: 1580 to 1845. New Haven, Connecticut: Yale University Press.
U.S. Department of Agriculture, Forest Service. 1973. National Forest Land scape Management System, Vol. 1, USDA Handbook. United States Government Printing Office, Publication No. 0100—2583, Washington, D.C.
Weller, J. E. 1965. Yesterday's People: Life in Contemporary Appalachia. Frankfort, Kentucky: University Press of Kentucky.
Wells. B. 1937. Southern Appalachian grass balds. Journal of Elisha Mitchell Science Society 53(1): 1-26.
Zeisel, J. 1981. Inquiry by Design: Tools for Environment-Behavior Research. Monterey, California: Brooks/Cole Publishing Co.
| <<< Previous | <<< Contents >>> | Next >>> |
chap7.htm
Last Updated: 06-Dec-2007