![]()

Cover Page
MENU
SECTION I
SECTION II
History
![]() Needs
Needs
Geography
Historic Sites
Competitors
Economic Aspects
SECTION III
Federal Lands
State and Interstate
Local
SECTION IV
Division of Responsibility
Local
State
Federal
Circulation
SECTION V
Recreational Use of Land in the United States
SECTION II
RECREATIONAL RESOURCES AND HUMAN REQUIREMENTS
2. RECREATIONAL NEEDS OF THE PEOPLE
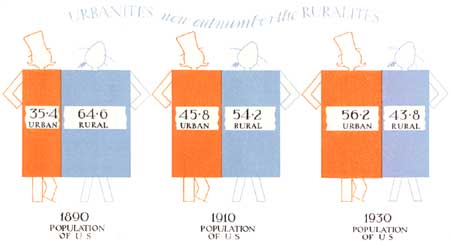
FIGURE 13.
Urban and Rural Trends
In 1930 the urban population was larger by 14,650,220 than in 1920; the rural nonfarm population increased about 3,600,000, while the rural-farm lost approximately 1,200,000. In 1890 the rural population made up 64.6 percent of the total population, while in 1930 it comprised only 43.8 percent. In 1890 the urban population was 35.4 percent of the total population, while in 1930 it was 56.2 percent.
In 32 States the rural-farm population declined, and in 16 States it increased, according to the 1930 census, but in 8 of these 16 States the increase was slight. The tendency toward greater concentration in the larger cities continued. The percentage of the total population living in cities of 500,000 and over rose from 10.7 percent in 1920 to 17.0 percent in 1930; the proportion in cities of 100,000 to 500,000 rose from 8.1 percent to 12.6 percent; in cities of 10,000 to 100,000 from 13 percent to 17.0 percent, while the percentage of the total population living in cities under 10,000 changed only from 8.3 percent to 8.6 percent.11 The larger cities, however, made no growth of population in their older sections, the growth being chiefly in their more open portions, especially near their boundaries. Urban communities in the environs of cities gained much more rapidly in most cases than did the central large city. This indicates a tendency toward decentralization, caused by the desire of the people to escape from congested living conditions, and made possible by improved roads and new methods of transportation, especially by automobile.
11 President's Research Committee on Social Trends, op. cit., p. 12.
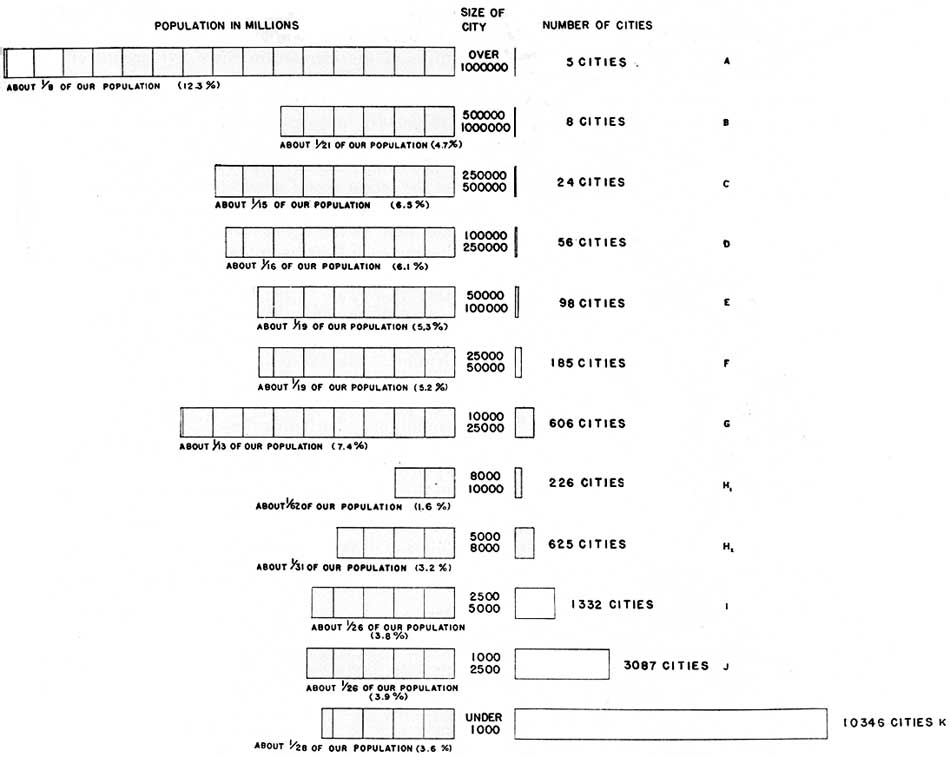
FIGURE 14.
(click on image for an enlargement in a new window)
Places of Most Rapid Growth.—It is important to emphasize the fact that almost three-fifths of the total population increase occurred in five well-defined groups of cities which had but 26.2 percent of the Nation's population in 1920.12
12 Ibid.
These five groups may be briefly described as follows:
Group 1. The metropolitan districts of the Middle Atlantic seaboard from New York City to Baltimore by way of Philadelphia.
Group 2. The metropolitan districts of the Great Lakes region from Buffalo to Milwaukee. This includes the Akron, Canton, and Youngstown metropolitan districts in Ohio, the Flint district in Michigan, and the Fort Wayne and South Bend districts in Indiana as well as those directly on the lakes.
Group 3. The metropolitan districts in Tennessee, Florida, Alabama, and northern Georgia, together with the cities of 25,000 to 100,000 in North Carolina and Florida.
Group 4. The metropolitan districts from Kansas City to Houston, and cities in Texas of 25,000 to 100,000.
Group 5. The metropolitan districts in the Pacific Coast States, except Spokane in Washington.
The cities in these five groups increased 36.1 percent between 1920 and 1930 compared with a 9.0 percent increase for the remainder of the United States, and 16.9 percent for the metropolitan districts not included in these five groups. They added a total of 10,010,063 to their populations, which is 58.6 percent of the increase of population in the entire United States during the decade just mentioned. Furthermore, over three-fifths of the increase in these five groups of cities is found in the first two which are composed entirely of metropolitan districts and which now have about 27,500,000 people concentrated on 11,962 square miles.13
13 President's Research Committee on Social Trends. Recent Social Trends in the United States, New York, McGraw-Hill Book Co., 1933, 2 vols., tables, charts. (See pp. 15—16.)

FIGURE 15.
However, this statement does not give a true picture of the actual extent to which the population is gathered on more or less restricted areas of land. In 1930, in addition to the 3,165 incorporated places and towns having each 2,500 or more inhabitants, with a total of 68,954,823 persons, or 56.2 percent of the total population, there were 13,433 incorporated places having each under 2,500 inhabitants with a total population of 9,183,453, or 7.4 percent of the total population of the Nation. These latter places are classed as rural,14 but not infrequently from the viewpoint of congestion on small areas many such communities present true urban conditions. Including these 13,433 incorporated places with the areas technically classed as urban there was a total (1930) of 78,138,276 inhabitants, or 63.7 percent of the entire population, living on more or less restricted areas of land.
14 United States Bureau of the Census, op. cit., 1930, Population, Vol. 1 (See p. 7).
| Group | Number of cities | Land area (acres) |
| Group I—500,000 and over | 13 | 1,046,559.9 |
| Group II—300,000 to 500,000 | 12 | 471,533.3 |
| Group III—100,000 to 300,000 | 69 | 1,271,432.3 |
| Group IV—50,000 to 100,000 | 95 | 698,991.8 |
| Group V—30,000 to 50,000 | 121 | 856,320.0 |
| Total | 310 | 4,344,837.3 |
The total population of the cities in these five groups is 47,395,009 (1930), or approximately 38 per cent of the total population of the Nation. A total of 47,395,009 people is crowded on two-tenths of 1 per cent of the total land area of the United States. In reality they occupy much less space than this, for seldom is the entire land area within the boundaries of cities fully utilized for any purpose. The average density of population is 10.9 per acre.
Cities of sufficient size may be expected to plan, acquire, and develop sufficient areas for recreation, and to operate a recreational system on a year-round basis. In this group should be included all cities of 10,000 population and over. The following table shows the number of such cities, according to geographic divisions, and the total population in the cities of each division.
| Geographic division | Number of cities | Population |
| New England | 133 | 5,699,915 |
| Middle Atlantic | 238 | 17,997,318 |
| East North Central | 218 | 14,599,766 |
| West North Central | 89 | 4,372,334 |
| South Atlantic | 91 | 4,551,186 |
| East South Central | 48 | 2,121,353 |
| West South Central | 68 | 3,234,019 |
| Mountain | 27 | 967,148 |
| Pacific | 70 | 4,797,038 |
| Total | 982 | 58,340,077 |
The total population of the above cities was 47.5 percent of the total population of the Nation in 1930; this has probably increased slightly since that time.
Many cities in the group from 8,000 to 10,000 may find it possible to provide the necessary open spaces for recreation and to operate a year-round recreational system. The number of cities in this group is 226 and the total population is 1,993,375. The combined population of all cities of 8,000 and above is 60,333,452, or 49.1 percent of the total population of the Nation (1930).
The following groups of incorporated urban and rural communities may be expected to provide and maintain certain types of areas for recreation, but they cannot be expected, for financial reasons, actually to operate a recreational service the year round.
| Groups | Number | Population |
| Cities from 5,000 to 8,000 | 625 | 3,903,781 |
| Cities from 2,500 to 5,000 | 1,332 | 4,717,590 |
| Rural from 1,000 to 2,500 | 3,087 | 4,820,707 |
| Rural from 1,900 and tinder | 10,346 | 4,362,746 |
| Total | 15,390 | 17,804,824 |
In general the population in these urban and rural incorporated communities will have to rely on some type of administrative unit larger than themselves for year-round, programmed recreational service. The same may be said of the 44,636,770 people outside incorporated places. Such an administrative unit may be a county, or a metropolitan district, or some other type of administrative unit yet to be devised.
Continued >>>
 Top
Top
Last Modified: Fri, Sep. 5, 2003 10:32:22 am PDT
http://www.cr.nps.gov/history/online_books/recreational_use/chap2-2b.htm
![]()