|
PECOS
From Folsom to Fogelson: The Cultural Resources Inventory Survey of Pecos National Historical Park |

|
CHAPTER 3:
Methodology
Susan Eininger
The methodology of the Pecos National Historical Park Cultural Resources Inventory Survey (CRIS) was designed with two goals in mind: (1) to provide the National Park Service with updated information with which to manage the park's unique cultural resources; and (2) to compile and interpret archeological data concerning the prehistory and history of Pecos National Historical Park within the greater Pecos Valley. In support of this, a wide variety of recording tasks and data fields was identified for incorporation into the survey design. As with any cultural resource survey, it was essential to design a methodology that would maximize meaningful data collection, achieve the stated goals, and operate efficiently and effectively within the time, money, and resources allotted for project completion.
The project methodology evolved into its final format over the course of several years, building on the successes and failures of previous National Park Service cultural resource surveys, the 1994 Pecos pilot survey, and the first year of this multiyear survey. Portions of the recording format were adapted from the recently completed archeological inventory of Bandelier National Monument (Powers and Orcutt 1999). Other elements were based on standard Southwest survey methodology and the data requirements of the statewide New Mexico Cultural Resource Inventory System (NMCRIS) and the National Park Service Archeological Sites Management Information System (ASMIS). Aspects of the Euro-American artifact analyses were adapted from procedures used by the Museum of New Mexico Office of Archaeological Studies (Boyer et al. 1994). Despite the incorporation of these other program elements into the project methodology, the overall recording format was designed to address management and research concerns specific to Pecos National Historical Park cultural resources.
Various aspects of the project design have been discussed in earlier National Park Service reports. The survey's theoretical approach and proposed work plan is presented in the project research design (Head 1997a). Post-field season progress reports summarize project organization, logistics, methods, and annual fieldwork accomplishments (Cunningham and Eininger 1998; Eininger 1996; Head 1997b). Guidelines concerning recording procedures, data fields, and project terminology are presented in the annual field manuals (available through National Park Service, Santa Fe). The following discussion presents a general overview of the Pecos CRIS methodology—its project organization, survey procedures, and documentation processes.
Project Organization
The Pecos CRIS was funded by the National Park Service and conducted as a joint effort between Pecos National Historical Park and the Intermountain Support Office-Santa Fe (IMSF). The project was implemented under the direction of Genevieve Head, IMSF archeologist, in consultation with Todd Metzger and Judy Reed, successive Pecos National Historical Park archeologists, and Linda Stoll and Duane Alire, successive Pecos National Historical Park superintendents. Except for the few IMSF archeologists assigned to the project, the survey crew and support staff consisted of seasonal park hires and volunteers.
Survey efforts encompassed approximately 23 weeks of field time over a three-year period (May through August, 1995, 1996, and 1997) with roughly a third of the total project acreage surveyed per season. All cultural resource documentation—site, isolated occurrence (10), artifact attribute, and cultural landscape data—was recorded during the in-field portion of the survey project. Data entry and editing were conducted in the fall following the end of each field season. Database compilation, data analysis, report preparation, and finalization of all project-related documentation were conducted over a four-year period following completion of the fieldwork, between September 1997 and September 2001.
Project staff, depending on the field season, included 15-18 people, although short-term volunteers and concurrent special projects sometimes temporarily increased that number. Survey personnel included the project director, lab archeologist, historic archeologist (during the 1996 field season), 3-4 crew chiefs, 10-12 survey crew members, and a camp cook. During the first two years of the project, the survey staff was organized into three field crews. Each crew consisted of a crew chief, two paid crew members, and a volunteer. In 1997, a fourth crew was added. To offset the cost of the additional crew, crew organization was changed to include one crew chief, one paid crew member, one student intern, and one volunteer. Despite this last season change in field organization, the experience of the eight returning crew members helped maintain consistency with the previous seasons' work and reduce the learning curve at the start of the new season.
To expedite site documentation and ensure consistent data quality, individual crew members were assigned specific site recording tasks. Each crew included a lithicist responsible for lithic analysis and recording, a ceramicist responsible for ceramic analysis and recording, and a mapper/architectural specialist responsible for site mapping, location information, and when applicable, architectural documentation. As the fourth crew member, the volunteer assumed the role of crew photographer and assisted in the full range of recording tasks as needed; their responsibilities varying depending on the complexity of the site. The historic archeologist, hired for the 1996 field season, was responsible for recording all the Euro American sites encountered that year. For the remainder of the project, various crew members shared the Euro-American site recording responsibilities. All crew members participated in general recording tasks; however, final recording decisions and site form completion were ultimately the responsibility of the individual crew chiefs. The laboratory archeologist was responsible for reviewing all completed documentation prior to data entry, tracking and maintaining the site record files, ensuring that all sites were recorded on the season's master map, logging collected artifacts, and downloading Global Positioning System (GPS) data files. The lab archeologist also served as liaison between the field crews, the park, and the Santa Fe office.
Due to the size and layout of the park (see Figures 1.2 and 1.3), logistical concerns were relatively minor for a survey of this size. All survey areas west of the Pecos River (approximately 1,332 hectares [3,291 acres]) were easily accessible by either paved or dirt road, and/or a short hike. Commuting time to these survey areas rarely exceeded 20 minutes. Logistics east of the river (about 1,064 hectares [2,629 acres]) were more demanding, however. Fluctuating river levels and the scarcity of road access often resulted in more than an hour of hiking time to reach many of the survey areas. In addition, the dissected terrain, steep slopes, and thick vegetation were physically and logistically more demanding than the open, rolling terrain west of the river. Despite the challenging terrain, the number of acres surveyed per crew-day was comparable if not higher east of the river due to lower site density, smaller sites, and less time intensive site recording demands.
The Forked Lightning Ranch house served as the field office and base camp during the field work portions of the project. The field office provided a work center and clearinghouse for all outgoing and incoming data, artifacts, and supplies. Ranch house facilities were also used for camp activities with a nearby tent camp providing sleeping space.
At the close of each field season, project operations were transferred to National Park Service offices in Santa Fe. Each season's site and 10 data were entered into a Microsoft Access 97 database program. Once all fieldwork was completed, a master database was created by merging the three seasons' databases. This database forms the basis for all statistical analyses and summary discussions presented in this final report. Upon completion of the project, all artifacts, site records, maps, photos, and supporting documentation will be curated and archived at Pecos National Historical Park.
As part of the project planning, a preliminary literature search was conducted to identify previous archeological research within or immediately adjacent to Pecos National Historical Park. National Park Service, U.S. Forest Service, and New Mexico State Archeological Records Management Systems (ARMS) files were checked for site records and cultural resource reports concerning Pecos National Historical Park and the surrounding area. A reference file of all previously recorded site records, a cultural resource bibliography, and a baseline map (1:24,000 U.S. Geological Survey [USGS] map enlarged) showing the locations of all previously recorded sites were compiled.
To prepare for the cultural resource inventory, a pilot survey was conducted in the fall of 1994 (Eininger et al. 1995). Nine areas were surveyed for a total of 103 hectares (254 acres). Two of these areas were located within proposed park development zones. The remaining seven were placed judgmentally, their locations chosen in an effort to sample the anticipated range of environmental and cultural resources found within the park. Forty-three sites and 15 IOs were identified. Twenty-one of the sites were recorded using the proposed Pecos CRIS recording format. The remaining 22 sites were described in field notes and on project maps, but due to time constraints were not formally recorded. All of the pilot sites were subsequently re-recorded during the Pecos CRIS.
The pilot survey proved to be extremely helpful in project planning. It provided project staff with the chance to familiarize themselves with the logistical and topographic demands of the park and enabled them to test and modify the proposed recording format prior to initiation of the full-scale survey. As a result, the project methodology required very little change over the course of the multiyear inventory. The only exceptions to this were the changes required for artifact sampling and GPS recording, neither of which were included in the original pilot survey design.
Survey Methodology
The Pecos Cultural Resources Inventory Survey was designed as a 100 percent survey of park lands—2,675 hectares (6,610 acres) including land from the Forked Lightning Ranch, the original National Monument, and the detached Pigeon's Ranch and Cañoncito Units (see Figure 1.1). Subsequent management decisions in 1996 eliminated the Pigeon's Ranch and Cañoncito Units (279 hectares [689 acres]) from the survey design reducing the survey area to 2,396 hectares (5,920 acres).
Survey Areas
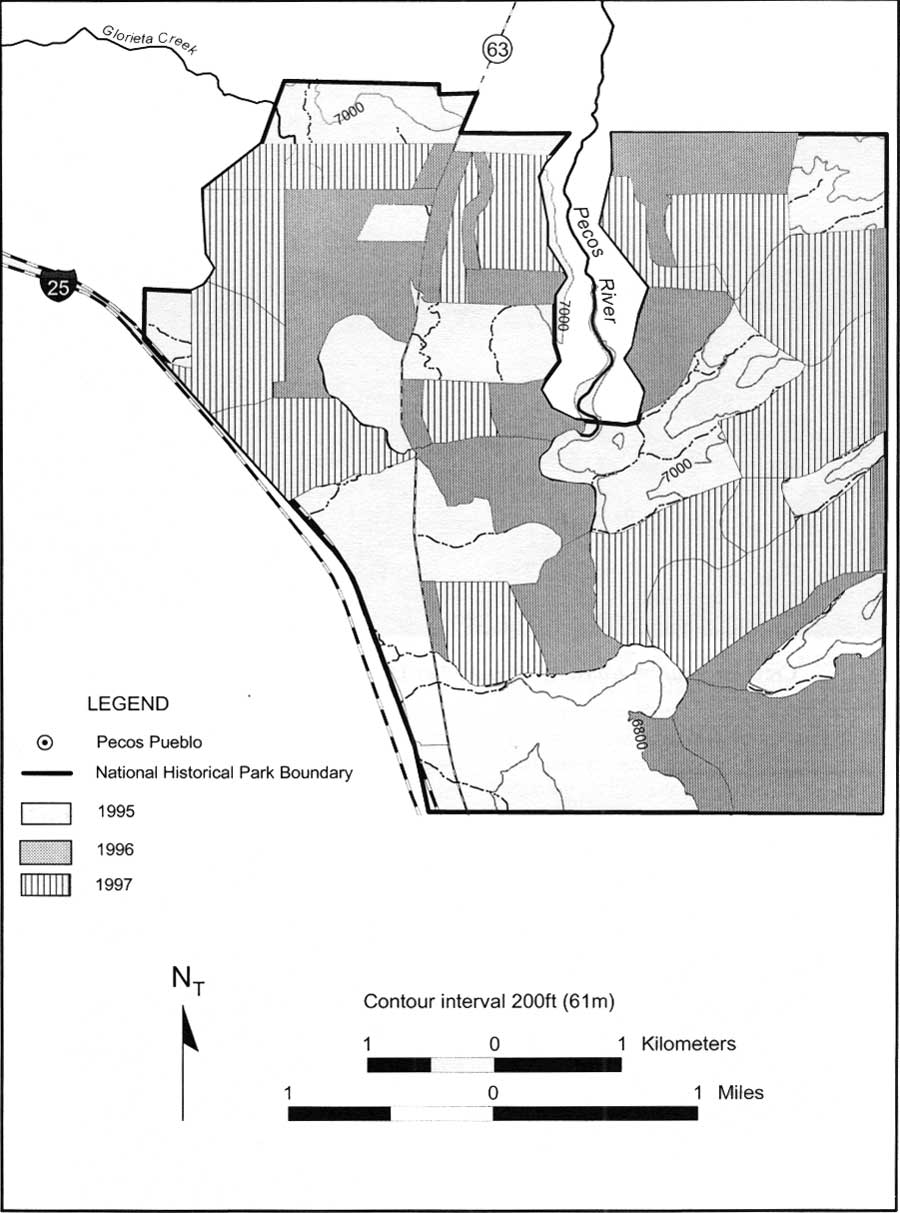
For management purposes, the project area was divided into three topographic and management zones: (1) the "core area" consisting of 148 hectares (365 acres) surrounding and including the mesilla and the original Pecos National Monument; (2) the Forked Lightning Ranch east of the Pecos River, consisting of approximately 1,064 hectares (2,629 acres) along the Tecolote Foothills; and (3) the Forked Lightning Ranch west of the River, totaling 1,185 hectares (2,927 acres) of level to gently sloping terrain surrounding the "core area" (see Figures 1.2 and 1.3). Each of these areas was in turn subdivided into smaller, more manageable survey units of 16-170 hectares (40-420 acres) each, depending on the terrain, site density, and logistical considerations. Figure 3.1 shows the configuration of these survey units and their distribution across park lands.
|
| Figure 3.1. Survey areas, 1995-1997. (click on image for an enlargement in a new window) |
As a 100 percent inventory, there was no need to develop a formal sampling strategy to select the areas to be surveyed. During the first season, survey areas were scattered across all three zones of the park. The intent was to examine as much of the topographic and cultural variability as possible, using the information to better anticipate and plan the subsequent seasons work. This strategy also enabled the crews to vary their routine over the course of the summer and divide up the workload more equitably.
Survey areas were defined in much the same way during the following years' work, although in a few instances certain areas were given priority based on specific park needs. By the third year of the project, survey areas were simply based on what was left. Individual survey area boundaries were defined using natural and man-made linear features (e.g., fence lines, roads, drainages), or judgmentally selected compass bearings marked on-the-ground with temporary flag lines. Area locations were plotted on 1:3000 aerial photos and USGS topographic maps. Survey area acreage was calculated at the end of each field season using either manual planimeter or computer-generated measurements.
Survey Procedures
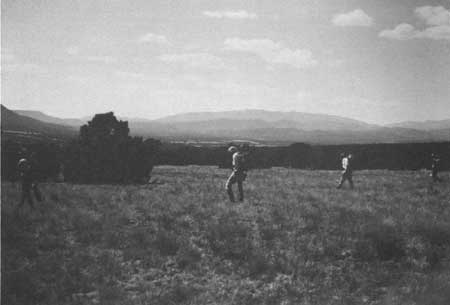
Survey areas were investigated by walking parallel transects with crew members spaced 10-15 meters apart (Figure 3.2). With a four-person crew, a single survey sweep covered an area roughly 60 m (200 ft) across. The orientation of the sweep was chosen to provide the most efficient coverage. In steeper terrain, transects were typically walked on contour, while in level areas, they were oriented along compass bearings or linear features such as roads, fence lines, or drainages.
|
| Figure 3.2. Crew on a survey transect, spaced 10 to 15 meters apart. View north-northeast. |
Transects were marked using temporary flag lines. During the initial sweep, the person on the outside edge marked his/her line with colored pinflags. Once the sweep was completed, the crew turned around and began a new transect using the other side of the newly laid flag line to guide the next sweep. As the crew proceeded forward, the flag line was pulled and another flag line established along the "new" outside edge. This procedure was repeated back and forth across the landscape until examination of the survey area was completed. Although the use of flag lines required one crew member to rewalk the line in order to remove the previously-laid flags, it helped ensure consistent parallel spacing and eliminate the possibility of gaps in coverage that can occur when relying solely on compass orientation.
Cultural Resource Identification
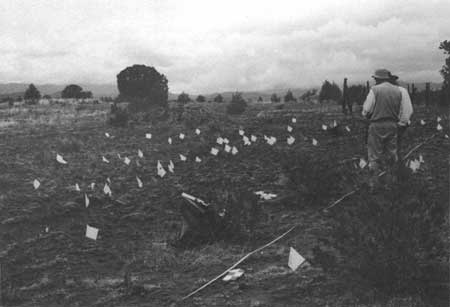
When cultural remains or anomalies in the natural landscape were noted, crew members stopped to investigate the area in question for additional artifacts or evidence of human use. Individual artifacts, artifact concentrations, and/or features were flagged (Figure 3.3) and the distribution, extent, and nature of the cultural remains determined. For the purposes of the survey, cultural remains were classified as either sites, IOs, or cultural landscape elements. A total of 629 sites, 479 IOs, and 118 cultural landscape elements was recorded.
|
| Figure 3.3. Site documentation in progress at PECO 142 (LA 118780). |
Sites
Sites were defined by one or more cultural features and/or by artifact scatters containing six or more artifacts situated within a spatially discrete area. All prehistoric and historic cultural remains meeting these criteria and predating 1945 were recorded as sites.
Site boundaries were defined by the extent of artifacts and/or features on the landscape. In some areas of the park, however, continuous low density artifact scatters made the application of these criteria somewhat problematic. Sites within these areas were typically not as spatially distinct, and as a result, boundaries were often based on decreases in artifact density, rather than the actual extent of artifact distribution.
This was especially true in the "core area" which was characterized by a continuous, though sometimes sporadic scatter of features and artifacts. Earlier park surveys (Nordby 1990, 1992, 1993) in anticipation of the difficulties associated with defining sites within continuous scatter areas, focused on the distribution of features rather than artifacts in determining site boundaries. Because the Pecos CRIS inventory used an artifact-based recording strategy, many previously recorded site boundaries were expanded to include the surrounding artifacts. In some cases, several adjacent previously recorded sites were re-recorded as a single site due to an encompassing, continuous scatter of artifacts.
In addition to these considerations, site boundaries were also influenced by logistical concerns. In a few instances, the cumbersome requirements of recording a seemingly endless artifact scatter warranted splitting the scatter into two (or more) contiguous sites to allow for more manageable recording. Artifact density decreases, topographic breaks, and/or man-made features typically formed the basis of these subdivisions.
Isolated Occurrences
As a rule of thumb, IOs are cultural resources that do not meet the minimum site criteria. For the purposes of the Pecos CRIS, IOs were defined as: (1) isolated diagnostic or museum quality artifacts, such as complete projectile points, axes, or historic bottles; (2) artifact scatters with fewer than six artifacts; (3) artifact scatters with more than six artifacts if they are the result of a single activity, such as a pot drop or core reduction area, or if they are located in an area lacking contextual integrity, such as in a stream channel or bulldozer backdirt pile; (4) an isolated feature (no associated artifacts) or isolated feature of questionable cultural origin (e.g., a vague rock alignment); and (5) possible raw material source areas. As with sites, the temporal criteria for IOs was pre-1945.
Cultural Landscape Elements
Cultural landscape elements (CLs) were used to record many of the modern (post-1945) features within the park. Features such as roads, fence lines, corrals, water catchments, vegetation anomalies, and trash dumps were included in this classification. Given the recent acquisition of the Forked Lightning Ranch, CL recording was crucial to the documentation of prepark ranching activities. Other linear features, such as trails or roads of unknown temporal affiliation were also recorded as CLs. Because of their linear configuration and extent, these resources were more effectively documented using the landscape-oriented CL forms rather than the project site forms which were designed to capture more spatially discrete information.
Site Documentation
As mentioned above, the site recording format was designed to capture both management- and research-oriented information. Cultural resource data were recorded using computer encoded and descriptive text fields. Data collection was based on a hierarchical approach, recording site and component level data as well as individual structure, feature, scatter, and artifact attributes. Attributes were selected to address research questions pertaining to site formation, function, chronology, cultural affiliation, and demography. Management data dealing with site significance, condition, and preservation concerns were also recorded. Table 3.1 provides a summary of the range of data fields included on the site form.
In addition to the park-specific data needs, data requirements for the statewide NMCRIS and the National Park Service ASMIS were incorporated into the recording format. There were instances, however, where the project data requirements were more detailed or finely defined than the broad classifications included in these regionwide databases. In these cases, field values were designed to meet the project-specific data needs and later converted into a format compatible with the other data systems.
To maximize consistency in the recording process and site information collected, recording manuals were compiled with explanations of the numerous data fields, standards for applying recording procedures, and definitions and encoding equivalents of any applicable terminology. Copies of the 1997 recording manuals for cans, glass, and nails and miscellaneous historic artifacts are available from the National Park Service, Santa Fe. Recording guides for site data, sampling, lithics, and ceramics are included as Appendices A-D. The reader is referred to these documents for a discussion of the various data fields and the guidelines for their application.
Table 3.1. Summary of data fields used for site recording.
LOCATIONAL DATA: State, County, Quad, Aerial photo, UTMs, GPS status, Meridian, Legal location, Location summary
SITE DESCRIPTION: Component #, Cultural affiliation, Date, Confidence, Component type, Site summary, Site size, Area, Criteria, Subsurface potential
FEATURES: Type, #, Size, Extent, Shape, Wall height, Number of courses, Mound height, Depth, Rooms visible, Rooms estimated, Construction, Fabric, Association, Stability, Comments, Room size, Agricultural feature/field size/slope/aspect
REFUSE SCATTERS: Type, #, Dimensions, Depth, Stability, Comments
SAMPLING: Feature, Sample #, Type, Representation, Dimensions, Area, Comments
DENSITY GRID (if applicable): Feature, Density datum location, Grid size, Square #, Sample #, Counts (Flaked, Nonflaked, Ceramics, Euro-American), % Ground visibility, Comments
RESOURCE MANAGEMENT DATA: Condition, Threat, % intact, % surface visibility, Soil pedestal height, Channel/Gully depth, % Sheet wash, Impacts
SITE EVALUATION: National Register recommendation, Criteria, Basis, Significance, Research potential, Dating potential, Interpretive potential, Site visibility, Site access
MANAGEMENT RECOMMENDATIONS: Recommendations, Comments
ENVIRONMENTAL DATA: Physiographic zone, Landform, Elevation, Aspect, Slope, Soil, Deposition, Vegetation zone, Nearest water/direction/distance, Permanent water/direction/distance
PHOTOGRAPHS: Roll #, Exposure #, Intermountain Cultural Resource Center (ICRC) #, View, Subject COLLECTIONS: Field Specimen (FS) #, Artifact code, Component #, Feature, Sample #, Description
ASSEMBLAGE CHECKLIST: Debitage, Flaked tools, Diagnostic points, Ground stone, Nonlocal lithics, Tool manufacturing items, Prehistoric diagnostic ceramics, Other prehistoric ceramics, Historic diagnostic ceramics, Other historic ceramics, Diagnostic glass, Other glass, Diagnostic metal, Other metal, Architectural stone, Burned adobe, Fire-cracked rock/burned caliche
ASSEMBLAGE SIZE: Lithic artifacts, Prehistoric ceramics, Historic artifacts, Total assemblage
One to two days were set aside at the start of each field season to orient crew members to the project recording format and field methodology. Field manuals were updated as needed, incorporating minor changes and additions identified over the course of the fieldwork. Once completed, site forms were reviewed by the lab archeologist to help ensure adherence to the guidelines and consistent application between crews.
Overall, there was little modification to the site recording format over the course of the project. In a few instances, definitions were clarified, additional values were added to the list of encoding options, or procedures were streamlined to allow for more efficient recording. As previously indicated, the only substantial changes in recording procedure involved GPS data collection and artifact sampling. The methodologies for both these activities are described in their respective sections below.
Site Numbering
Each recorded site was assigned a park-specific PECO site number based on the numbering system established during the 1975-1976 cultural resource survey (Nordby 1990, 1992, 1993). A total of 485 new PECO numbers (PECO 233-720) and 144 previous site numbers was assigned over the course of the survey. All site forms, maps, photos, and related documentation are cross-referenced using the designated PECO number. Aluminum site stakes marking individual site locations were stamped with a "P" followed by the designated PECO number (i.e., P720). Sites were subsequently assigned Laboratory of Anthropology (LA) site numbers, although for National Park Service purposes the PECO number is considered the primary site designator. The LA numbers do not appear on the Pecos CRIS site stakes. Appendix F gives a concordance of PECO numbers and LA numbers.
As a rule, previously recorded sites with existing PECO and/or LA numbers were rerecorded using their original site numbers. There were exceptions to this, however, due to differences in recording strategies between the present and previous projects. There were situations where several adjacent previously recorded sites were redefined as a single site. In these instances, only one of the previously assigned site numbers was reused although in a few cases, a totally new number was assigned. There were also instances where a previously recorded site was reinterpreted and as a result, divided into several smaller sites. The original site number was maintained at one of the subdivided sites, while the others were assigned new number designations. Tables 3.2 and 3.3 summarize these site number revisions. For tracking purposes, number changes were noted in the Previous Investigations section of the site data form, previous site markers were left in place, and a master site log was maintained noting the disposition of all previously assigned PECO site numbers.
| Table 3.2. Site number changes due to combining previously recorded
sites. | |
| Site Number | Site Numbers Subsumed within That Site |
| PECO 10 | PECO 225 |
| PECO 32 | PECO 27, 28, 31, 33, 34 |
| PECO 48 | PECO 79, 80, 85 |
| PECO 60 | PECO 59 |
| PECO 81 | PECO 82 |
| PECO 101 | PECO 216, 217 and LA 85507, 85508 |
| PECO 107 | LA 32241 |
| PECO 144 | PECO 149, 150, 170 |
| PECO 148 | PECO 153, 156 |
| PECO 151 | PECO 152, 154, 155, part of 157 |
| PECO 157 | PECO 158, 180 |
| PECO 219 | PECO 210 |
| PECO 220 | PECO 161 |
| PECO 226 | PECO 73, 74, 75, 77, 78, 87, 88, 89 |
| PECO 247a | PECO 132 |
| PECO 282a | PECO 106 |
| PECO 335a | PECO 51, 52, 54, 63 |
| PECO 403a | PECO 141 |
| PECO 458a | PECO 171 |
| PECO 494a | PECO 164 |
aRe-recorded using newly assigned PECO number. | |
Table 3.3. Site number changes due to subdividing previously recorded sites. | |
| Previous Number | Re-recorded as: |
| PECO 138 | PECO 138, 592, 595, 596, 597, 598, 599, 630, 631, 632, and 633 |
| LA 69301 | PECO 504 (LA 69301) and 505 |
| LA 85502 | PECO 290 (LA 85502) and 292 |
| LA 85503 | PECO 293 (LA 85503) and 269 |
Site Recording Forms
The primary site recording tool was the Site Data Form which includes basic location, descriptive, management, and environmental data (Appendix A). Supplemental forms were used as needed to document the various artifact classes represented in the site assemblages. These artifact-specific forms enabled attribute recording of flaked and nonflaked lithics, ceramics, glass, cans, nails, and miscellaneous Euro-American artifacts. All artifact analyses were conducted on site as part of the in-field recording procedures. This non-collection approach was adopted to minimize the need for collecting and curating large numbers of artifacts and to help ensure minimal disruption of site integrity and artifact provenience as a result of project activities.
Site Components
Sites were interpreted and documented using a component-based recording system—a "component" being an intrasite grouping of temporally and/or culturally related remains. Given the long and varied history of the Upper Pecos Valley and the occurrence of multicultural site areas, the component-based system provided the means for sorting culturally and temporally associated intrasite and intersite data. Sites with structures, features, and/or scatters that appeared to be the result of a single occupation or use period were recorded as single component sites. Multi-component sites were recorded when it was possible to attribute the site remains to two or more distinct occupations or cultural periods. Of the 678 components recorded, 582 were identified within single component sites and 96 in multi-component sites.
Components were assigned a type designation and cultural affiliation to enable preliminary sorting of site data. Component type was based on the most prominent feature of the component group. Cultural affiliation was determined by the presence (or absence) of culturally and/or temporally diagnostic artifacts and features. Depending on the site assemblage and the diagnostic information available, cultural affiliation assignments varied from the broad generic categories of "Native American" or "Euro-American," to more specific associations, such as "Archaic," "Puebloan," "Plains," or "Hispanic." Date ranges were assigned whenever possible using temporally diagnostic information present within the component's artifact and feature assemblage. As with the cultural classifications, temporal assignments ranged from very broad all-encompassing dates spanning several hundred years to narrow time spans of 10-30 years depending on the diagnostics present and their associated period of manufacture.
Puebloan ceramic typologies established for the Upper Pecos Valley and the northern Rio Grande cultures served as the primary dating tools at Native American sites. Towards this purpose, a ceramic typology field manual (available through National Park Service, Santa Fe) was compiled, assembling information from various published and unpublished regional ceramic references. The manual formed the basis of the field classifications and chronological assignments and helped promote consistency between crews. At aceramic and pre-ceramic sites, projectile points were sometimes used for determining cultural and temporal affiliations. Projectile point dating was complicated, however, by the lack of a well-established point typology for the area and by the possibility for reuse and curation of early points at later sites.
Euro-American site dates were based on the identification of artifacts and/or features with time-sensitive attributes. As a result, manufacturing techniques, materials, and stylistic designs associated with recognized periods of manufacture were recorded. To maximize field recordation and ensure recognition of historic diagnostic attributes, the majority of Euro-American sites were recorded in 1996 while the historic archeologist was on staff. Historic artifact field guides and a reference library established at the project office helped provide information for determining artifact chronologies. In a few instances, field recording was supplemented with review of quit-claim deeds, land titles, cemetery rolls, and journal descriptions (Welker 1995). A few local residents and ranch employees were interviewed for information on the more recent ranch features.
A variety of factors, including the number and type of diagnostics present (e.g., ceramics, projectile points, Euro-American artifacts), the confidence with which the diagnostics were dated, the range and/or overlap of the dates identified within the assemblage, and the complexity of the site as a whole were considered in making in-field temporal assignments. During the research phase of the project, site chronologies were re-examined using a variety of computer-based statistical programs (see Chapter 4, this volume). This work was performed in-house with the exception of the Euro-American artifact analysis which was conducted by the Museum of New Mexico-Office of Archaeological Studies, Santa Fe, New Mexico (OAS) (see Chapter 10, this volume).
Native American Artifact Documentation
As a primary source of cultural, temporal, technological, and functional data, artifact documentation comprised a significant part of the site recording process. The documentation focused on two separate but complementary recording tasks: (1) the inventory and attribute analysis of the individual artifacts and (2) the density count and composition of the assemblages as a whole. Artifact attribute analyses were designed to provide data for determining artifact function, technology, and temporal range while density data were designed to provide intrasite artifact distribution and frequency. The data collected as a result of both these processes were used to reconstruct site function, duration of occupation, chronology, and settlement patterns.
Artifact Sampling
Artifact inventory procedures were adapted from the Bandelier National Monument archeological survey (Powers and Orcutt 1999). Sampling strategies were designed to ensure representation of artifact assemblage variability and statistically valid comparative data (McKenna and Powers 1986). Preserving site integrity and maintaining artifact provenience were also of primary concern. To minimize sampling logistical demands, attribute analysis data and density grid counts were derived from the same sample units, whenever possible. Lithics and ceramics were inventoried separately within the selected units; their differing technologies, functions, and frequencies requiring separate sampling strategies and analytical approaches (see Appendix B).
Ceramic assemblages with fewer than 200 ceramics and lithic assemblages with fewer than 40 flaked lithics were 100 percent inventoried with all artifacts included for attribute analyses. The artifact density data at these sites—the lithic and ceramic counts and scatter area—were recorded in conjunction with the artifact analysis and did not require any additional sampling procedures. Lithic scatters with 41-100 flaked lithics, were sampled by randomly selecting 30-40 artifacts from the total lithic assemblage. In these instances, the density data was again accomplished by the same procedures used to document the analytical sample. Nonflaked lithics, which were characteristically few in number, were 100 percent inventoried at all sites regardless of quantity, and therefore not addressed in the sampling design.
At larger scatters, exceeding the 200 ceramic or 100 flaked lithic limit, representative artifact samples were selected for both the attribute analyses and the density count documentation. Density count samples were designed to include 10-15 percent of the total scatter area. Artifact attribute analysis was based on a sampling of roughly 200 ceramics and/or 100 flaked lithics (from which 30-40 lithics were randomly selected) per scatter. Assuming these numbers represented at least one percent of the total assemblage (i.e., no more than 20,000 sherds and/or 10,000 lithics), no additional samples were taken. If additional samples were needed to meet the 1 percent goal for attribute analyses, a second sample of 200 sherds and/or 100 lithics was selected. Due to time constraints, a maximum of 400 sherds (2 samples) and 300 lithics (3 samples) was analyzed per scatter.
To simplify the logistics involved in completing the attribute analyses and density counts, sample areas were designed to meet the size requirements of both procedures. For most sites this was achieved by gridding off the scatter area and selecting a stratified random sample of grid squares. The goal of this methodology was to compile spatially representative samples that could be used to reflect overall scatter composition (Appendix B).
The implementation of the grid system and the identification of sample units across the sites proved to be one of the most logistically challenging tasks of the project. As a result, the implementation of the grid system and artifact selection process underwent substantial modification during the early stages of the survey. More streamlined methods adapted to the dispersed scatters characteristic of the Pecos area were developed. Under the revised system, the datum and the primary grid axis were judgmentally placed along the main axis of the scatter. The scatter area was mapped in relation to the axis, and a grid system of equally sized, individually numbered squares was superimposed on the plan view (Figure 3.4). Depending on the size of the scatter, grid squares ranged in size from 0.5 x 0.5 m to 11 x 11 m (1.6 x 1.6 ft to 36 x 36 ft). The maximum sample unit size of 11 x 11 m (36 x 36 ft) was established to minimize the displacement of artifacts upon redistribution.

|
| Figure 3.4. An example of a lithic and ceramic scatter density grid square map used to delineate and select the sample units needed for artifact density counts and artifact attribute analysis. (click on image for an enlargement in a new window) |
The plan view grid was then divided into four equal-sized quadrants and grid squares were randomly selected, an equal number of grid units per quadrant. Using location coordinates derived from the map datum, the selected units were identified and marked on the ground. Depending on the area involved and crew preference, sample units were laid out encompassing the entire grid square or as circular dog-leash areas within the grid square interior. Typically 8-12 units were selected to meet the 10-15 percent sample required for the density count. These same grid units were also used to provide the artifact sample for attribute analyses, although at some of the more dispersed scatters artifacts from additional units were analyzed to meet the required 200 ceramic or 100 lithic sample size requirements.
It was within the discretion of the ceramic or lithic analyst to select additional judgmental samples if he/she felt the grid square sampling did not effectively capture all the site diversity or functionally important artifact locations. Depending on the intent of the additional sampling, units were randomly or judgmentally selected. There were only a few instances at the larger more complex sites where this type of supplemental sampling was implemented. Judgmental samples were also used to record "items of interest" that fell outside of the selected sample boundaries. This included high input lithic tools, ground stone, unique artifact types, cores, worked sherds, and unusual ceramic types.
Despite successes in streamlining the grid square procedures, implementation at the larger dispersed artifact scatters continued to be a time consuming task. Re-evaluation of the procedure because of scheduling concerns in 1996 resulted in the decision to eliminate grid square sampling of large nonstructural artifact scatters. As a result, grid square mapping was discontinued, and density data was no longer collected at these scatters. Sample units needed to generate the artifacts required for the artifact attribute analyses were derived from judgmentally placed sample units rather than randomly selected grid squares. The judgmental units were placed in areas that, based on on-site observation, best represented the scatter assemblage and variability and would provide the required number of artifacts needed for attribute analyses.
Density Count Procedures
Once the grid square units were selected and defined on-the-ground, artifacts within individual units were collected. Provenience was maintained by careful labeling and handling of the sample unit bags and by returning all artifacts to their original unit locations. All artifacts in a grid unit were counted. Ceramics, flaked lithics, nonflaked lithics, and when applicable, Euro-American artifacts were tallied. Counts were recorded on the Density Grid Form included in the site form packet (Appendix B). Disturbance factors and ground visibility conditions likely to influence the counts were also noted. Artifacts were returned to their respective units upon completion of the recording procedures. Over the course of the project, 91 scatters representing 71 sites were sampled using the grid square methodology. As a result, over 44,000 artifacts were counted from more than 900 grid units.
Artifact Attribute Analyses
Selected grid units were also used to generate the 200 ceramics and 100 lithics needed for artifact attribute analyses, although the practice of collecting each grid unit in its entirety precluded the selection of exactly 200 sherds and 100 lithics. Artifacts were assembled from the individual grid units noting their specific grid provenience for redistribution upon completion of analysis.
Attribute analysis procedures were designed to address a wide range of ceramic, flaked lithic, and nonflaked lithic artifacts. Various descriptive, technological, and functional data fields were selected in support of the anticipated research goals. These attributes are summarized by artifact type in Table 3.4 below. Chapters 8 and 9 include respective discussions of the specific ceramic and lithic attributes and the results of their subsequent analysis.
Ceramics were analyzed and sorted by type and vessel form. Counts, weights, rim counts, and when possible, rim diameter, were noted. Over the course of the survey, 631 ceramic samples were analyzed. As a result, more than 30,000 sherds representing 586 artifact scatters and 487 sites were analyzed. Most samples (n=541) were the result of 100 percent inventory of their associated ceramic assemblages. Eighty-five represent sampling of larger artifact assemblages and five samples are the result of efforts to document items of interest outside the established sample areas.
Lithic documentation included descriptive information, such as material, condition, artifact size, evidence of thermal alteration, and use wear. Technological and functional types were also determined. A total of 865 lithic samples was analyzed representing 694 lithic scatters from 587 sites. Over 21,000 flaked lithics and 1,145 nonflaked lithics were recorded. More than half of the samples (n=524) are the result of 100 percent inventories, 216 represent sampling of larger scatters, and 125 are the result of recording items of interest.
Euro-American Artifact Documentation
On-site artifact attribute analyses were conducted at Euro-American artifact scatters although the recording procedures were less formally defined than at the Native American sites. At smaller scatters and whenever feasible, Euro-American scatters were 100 percent inventoried and all artifacts counted and recorded for descriptive and diagnostic attributes. At the larger, high density scatters and trash dumps where 100 percent inventory was unrealistic given the logistical constraints, artifact inventory and attribute analysis focused on temporally diagnostic artifacts only.
Sampling procedures were determined based on assemblage size and distribution, the types of artifact present, and the potential for recording diagnostic attributes. Judgmental samples were selected, focusing on diagnostic artifacts and items of interest, rather than on random samples of the assemblage. Artifacts were selected for analysis at the discretion of the analyst. The condition of the artifact, the certainty with which the diagnostic attributes could be identified, and the number of other diagnostics available for analysis often influenced artifact inclusion in the judgmental sample (see discussion of field recording in Chapter 10).
As a result of the survey, over 5,000 Euro-American artifacts were analyzed. This includes artifacts from 78 Euro-American artifact samples at 37 sites. Forty-five of these samples were the result of 100 percent inventory. The remaining 33 were judgmentally selected samples of a larger assemblage. As a result of this analysis, 54 can inventories, 64 glass inventories, 57 miscellaneous artifact inventories, and 15 nail inventories were completed. Research findings derived from the resulting database are presented in Chapter 10.
Table 3.4. Artifact attribute analysis data fields.
CERAMIC INVENTORY FORM
Ceramic Data: Group #, Ceramic type, Form, Count, Weight, # of Rims, Vessel estimate, Comments.
Rim Sherd Data: Group #, Diameter, # of sherds, % of rim, Comments.
LITHIC INVENTORY FORM
Flaked Stone Data: Artifact #, Material, Color, Cortex, Platform, Item Condition, Heat Alteration, Use-wear, Technological Type, Functional Type, Length, Width, Thickness, Comments.
Nonflaked Lithic/Ground Stone Data: Artifact #, Material, Nonflaked lithic type, Condition, Length, Width, Thickness, Cross section, # of surfaces, Comments.
GLASS INVENTORY FORM
Glass Data: Group #, Count, Color, Type, Function, Makers Technique, Label, Base, Finish, Lid, Seam, Dates, Comments.
CAN INVENTORY FORM
Can Data: Group #, Count, Function, Material, Part, Seam, Seal, Open, Diameter, Height, Width, Thickness, Label, Dates, Comments.
MISCELLANEOUS HISTORIC ARTIFACT INVENTORY FORM
Nail Data: Group #, Count, Class, Function, Length, Dates, Comments.
GLASS Miscellaneous Artifact Data: Group #, Count, Class, Function, Brand/Comments, Dates.
Artifact Collection
As a result of the project's in-field analysis procedures, only a limited number of artifacts were collected over the course of the project. The resulting collection includes diagnostic projectile points, unique or "museum quality" artifacts, and representative artifacts and raw material samples (such as clay and stone) that were incorporated into the survey type collection. In a few instances, unidentified artifact types were collected in order to consult with other analysts on a more definitive artifact classification.
Artifact-specific collection data were recorded on individual artifact collection tags, collated in the project's field specimen log, and catalogued using the National Park Service Automated National Cataloging System Plus (ANCS+). A total of 506 collections from 200 different sites is entered in the project database. Although many of the collected sites averaged one or two collections each, as many as 52 collections were taken at Forked Lightning Ruin, PECO 226. Projectile points comprise the overwhelming majority of collected materials (n = 349). Sherds, lithic tools, lithic material types, diagnostic Euro-American artifacts, worked bone, shell, and clay samples are also included in the collection.
Location Information
Site location information was documented using three different field recording methods: (1) site boundaries were plotted on the USGS 7.5' Pecos, New Mexico Quadrangle topographic map (enlarged to 1:12000); (2) site boundaries and datum locations were plotted on 1992 1:6000 aerial photos (enlarged to 1:3000); and (3) GPS Universal Transverse Mercator (UTM) data were collected for all site datums and for boundaries on roughly a third of the sites. All GPS readings were taken using the World Geodetic System 1984 (WGS 84) coordinate system. Datum and boundary locations were also documented on the individual site sketch maps, and brief narratives describing site locations were included on the site recording forms. Township-Range locations were extrapolated from USGS topographic maps with field-plotted site locations.
The procedures used for compiling GPS locational data evolved over the course of the survey in response to various base station problems, the acquisition of new equipment, and increasing technical expertise. The initial approach was to have a separate GPS recording crew responsible for all of the GPS data collection. Once a survey area was completed, the GPS crew revisited the area and recorded point files at each site datum using a Trimble Pathfinder Basic PlusTM unit. To ensure a certain standard of accuracy, each point file consisted of at least 180 readings (approximately three minutes of recording time) and required data from a minimum of four satellite stations.
Prior to the second field season, new GeoExplorer II GPS units were acquired to provide one unit per survey crew. As a result, GPS data were collected during the initial recording of the site, eliminating the need to revisit the site at a later date. Crews were also able to record GPS data for IO locations. During the 1995 field season, UTM locations for IOs were taken off the 1927 7.5' USGS topographic sheet and reprojected to WGS-84. During the third and final field season, GPS recording procedures were expanded to include line files documenting individual site boundaries.
GPS logs were maintained manually and submitted to the lab archeologist with the recorded data files on a daily basis. Differential corrections were made within a day or two of field data recording using simultaneous observations collected by the National Park Service's Albuquerque base station. For the few times when the Albuquerque National Park Service base station data were unavailable, data were obtained from the New Mexico Engineering Research Institute base station, also in Albuquerque, or from the Mesa Verde National Park base station in southern Colorado.
Based on the manufacturer's specifications (Trimble Navigation Limited 1994:1-4), GPS locational data were expected to be accurate within 2-5 m (6.6-16.4 ft). To monitor accuracy, each crew took daily readings of established brass caps. These readings were subsequently compared with known UTM coordinates for those caps. The brass cap readings and the re-recording of a number of site datum locations indicated that most of the evaluated GPS locations were within 1 m (3.3 ft) of accuracy. UTM data generated by the GPS files were entered into the site database and transferred to the site recording forms. In addition, as part of the post-field analysis and final report preparation, the GPS data were converted to a Geographic Information System (GIS) application for mapping and analysis.
Site Maps
Intrasite locational information was provided on individual site sketch maps included in the site form packet. Scaled plan views were created for all recorded sites using compass, tape, and/or pacing. In a few instances where extensive site size and heavy vegetation cover limited line of sight and prohibited efficient ground measurements, aerial photos were used to help project the site area. Individual site sketch maps depicted the location and extent of site stakes, all site features, scatters, sample areas, photo points, and collected artifacts. Topographic features, pertinent vegetation, modern features, impact areas, and other items of interest were also located.
Instrument maps were completed at seven of the larger sites in the park: Pecos Pueblo, the Estancia, Loma Lothrop, Arrowhead, Forked Lightning, Shin'po, and Dick's Ruin. With the exception of Pecos Pueblo, which was mapped by Shawn Penman from the University of New Mexico, the instrument mapping was incorporated into the standard site recording process. Mapping instrumentation varied depending on available equipment, but included an alidade, theodolite, electronic distance measurer (EDM), optical transit, and laser transit.
Photodocumentation
Black-and-white photos were taken of each site. At a minimum, photodocumentation included site stake location and general site setting. Specific features and additional viewpoints were taken as needed. Color slides were also taken focusing mostly on survey methodology and representative site features for use in the park's interpretive library. Photo information was logged on project photo record forms and cross-referenced on the associated site form. All prints, negatives, photo CDs, slides, and photo logs resulting from the survey are archived at the park.
Isolated Occurrence Documentation
In comparison to site documentation, IOs were recorded on a much more abbreviated scale. Due to their limited research potential, extensive recording was not warranted. A single page Isolated Occurrence Form and associated recording manual were designed to document general location, environmental, administrative, and archeological data. IO data fields are based on the design of the Site Data Forms. Table 3.5, presents a summary of these recorded data fields.
IO locations were plotted on both USGS topographic quadrangles and project aerial photos. UTM data were generated manually from 1927 7.5' USGS topographic sheets during the first year of the project and from GPS point files in the later two years. In situ artifacts and features were sketched and/or photographed at the discretion of the crew chief. IO artifact collection was guided by the same principles established for site artifact collection.
Cultural Landscape Documentation
CLs were recorded on a single page form using a loosely defined narrative-based format. Unlike the site and IO data which were designed for data entry and immediate research and management use, the CL field recording was considered the first of a multistage documentation process and was therefore more preliminary in design. The intent was to identify and briefly describe all CL features encountered in the course of the survey and, in effect, to flag these resources for future documentation and research.
Table 3.5. Isolated Occurrence data fields.
DESCRIPTION: Culture, Date, Confidence, Artifact/Feature type, Dimensions, Description.
LOCATIONAL DATA: State, County, Quad, Aerial photo, UTMs, GPS status, Meridian, Legal location, Location summary.
ENVIRONMENTAL DATA: Physiographic zone, Landform, Elevation, Aspect, Slope, Soil, Vegetation zone.
COLLECTIONS: Field Specimen (FS) #, Artifact code, Description.
PHOTOGRAPHS: Roll #, Exposure #, Intermountain Cultural Resource Center (ICRC) #, View, Subject.
Unlike archeological sites and IOs, which tend to be
location-specific, the CLs require a broader regional perspective
encompassing land use patterns and the surrounding environment. As a
result, Pecos Cultural Resources Inventory Survey (CRIS) strategies did
not always allow for thorough recording of the CLs, especially for those
with extensive linear dimensions or poorly defined boundaries. General
location, environmental and administrative data similar to sites and
IOs were recorded but narrative text rather than encoded information was
used to provide descriptive information. Table 3.6 presents a summary of
these recorded data fields. All CL locations were plotted on USGS
topographic quadrangles and aerial photographs to the extent they were
defined and in some instances, GPS data points were collected.
Data Processing and Management
Upon completion of the fieldwork, all recorded data were entered into a Microsoft® Access 97 relational database. As part of the data editing process, database files were screen checked against the hard copy site forms for entry errors and inconsistencies in data values. The three seasons' files were merged into a master database and edited again for noticeable inconsistencies or errors affecting compatibility and sorting of data. In compliance with state and National Park Service cultural resource programs, site data were transferred into the NMCRIS and National Park Service ASMIS document formats and submitted to the respective agencies.
Table 3.6. Cultural Landscape data fields.
LOCATIONAL DATA: State, County, Quad, Aerial photo, UTMs, GPS Status, Meridian, Legal locations.
ENVIRONMENTAL DATA: Physiographic zone, Landform, Elevation, Aspect, Slope, Vegetation zone, Soil.
LANDSCAPE INFORMATION: Theme/Period, Landscape feature type, Subtype, Description, Size, Orientation, Shape/Pattern, Material, Plant species, Associated features, Comments.
PHOTOGRAPHS: Roll #, Exposure #, Intermountain Cultural Resource Center (ICRC) #, View, Subject.
All project data and documentation are archived at Pecos National Historical Park. This includes original recording forms, all photodocumentation, maps, supporting documents, and computerized data. As previously mentioned, artifacts have been catalogued in ANCS+ and are curated at the park.
Summary
The Pecos CRIS survey provided the unique opportunity to systematically investigate Pecos National Historical Park lands for evidence of prehistoric and historic occupations. While most of the previous investigations focused on Pecos Pueblo and the lands immediately adjacent, the Pecos CRIS adopted a broader focus encompassing more distant park lands away from the pueblo. The goal of the survey was to collect and interpret the cultural resource findings in a way that would be meaningful to managers, researchers, affiliated communities, and visitors alike. Building on the knowledge gained from previous archeological and management studies, Pecos CRIS methods were designed to maximize the quality and quantity of the data collected while operating within the project budget and scheduling requirements. As a result, priorities were established and compromises were made, hopefully without impacting the overall project goals.
Three seasons of field survey resulted in the examination of more than 2,396 hectares (5,920 acres) and recorded 629 sites, 479 IOs, and 118 CLs. A wide variety of site, feature and artifact data were collected. Artifact assemblages, because of their functional and chronological data potential, were a primary focus of the survey. Artifact attribute analyses and scatter density determinations comprised a significant portion of the on-site recording time. The data generated by these procedures and the numerous other recorded data fields document and, in effect, help preserve the numerous cultural resources encountered by the survey and provide the foundation for the research and analyses presented in the following pages.
| <<< Previous | <<< Contents>>> | Next >>> |
peco/cris/chap3.htm
Last Updated: 13-Feb-2006