|
Kenai Fjords
A Stern and Rock-Bound Coast: Historic Resource Study |

|
Chapter 9:
COMMERCIAL FISH AND SHELLFISH HARVESTING (continued)
Commercial Salmon Fishing Since Statehood
Statehood and Its Ramifications, 1960-1963
The relative continuity of fisheries management along the Kenai Peninsula's outer coast, and fisheries management throughout Alaska, was abruptly changed by statehood. A statehood bill passed Congress in June 1958, but Alaska did not enter the Union until January 1959, and the new state did not assume responsibility for fisheries management until 1960. Therefore, fisheries management for the first year after statehood continued much as it had during territorial days.
When the Alaska Department of Fish and Game assumed control of the new state's fisheries, the health of Alaska's salmon stocks had been declining for years. A major reason for the declining stocks was the strong bond between the canneries and the Fish and Wildlife Service, both being based outside Alaska. Jim Rearden, a longtime Fish and Game biologist, has remarked that "all the agency cared about was the canneries," and the canneries had a near-total influence over territorial fishing regulations. Independent fishermen, and Alaskans in general, strongly resented their own lack of influence over fisheries regulations. One manifestation of that resentment was that some Alaska fishers robbed fish along creeks and at stream mouths. [60] As noted above, many Alaskans equated federal fisheries management with the fish trap. While the number of fish traps slowly declined during the years that preceded statehood, the widely hated traps were not eliminated until Congress passed the statehood bill.
Another reason that Alaska's salmon stocks were in relatively poor shape was because of the nature of fisheries regulation. Jim Rearden has noted that
under Federal control, the regulations were generally adopted six months or more in advance of the fishing season and they were virtually inflexible; any change had to be published in the Federal Register before it became effective. Once a regulation was in place, there was little chance of modifying it, regardless of its effect on fishermen or on the salmon.
The transfer to state management, however, made the adoption of fisheries rules far easier; rule changes, via "emergency orders," could be made by field announcement and implemented within hours. [61] Those regulations, moreover, were generated by an Alaskan, not Federal, bureaucracy. Fisheries policy was set by a statewide board appointed by Alaskans and subject to a public hearing process. Because of the changes in fisheries management that followed statehood, local antagonism against fisheries regulations lessened. The resentment did not, however, evaporate. Some fishers continued to fish out of season, at stream mouths, and in other ways contrary to the newly constituted regulations.
Other changes that followed statehood were easily visible on the fishing grounds. The placing of stream guards continued after statehood, but the unpopular stakeout program was eliminated. The number of Alaska stream guards, moreover, shrank considerably. In park waters, stream guards continued at Home Cove on Nuka Island and in the Delight-Desire Creek area, [62] but apparently no guards were deployed to Aialik Bay after statehood. The guards' survey duties, to an increasing degree, were taken over by a Fish and Game biologist who periodically flew over the area–either from Port Dick to Resurrection Bay, or from the head of Kachemak Bay to Nuka Bay and on to Resurrection Bay–in a Super Cub. (The small, maneuverable Cub had a distinct advantage over the Grumman Goose used by federal fisheries managers. The Cub could fly as slowly as 65 or 70 miles per hour without stalling–slow enough that biologists could count the spawners from the air–while the Goose's stall speed was 140 or 150 miles per hour.) Stream guards returned to the area in the summer of 1961, and perhaps again in 1962; they then left the Outer Coast, never to return. [63]
By the time the State of Alaska began managing the park area fishery, the southern coast's salmon runs had become sufficiently well known–and its harvest statistics had become sufficiently reliable–that its contribution to the overall Cook Inlet regional fishery could be assessed (see Table 9-4). Fish and Game personnel recognized that Nuka Bay (i.e., the stretch of coastline between Gore Point and the Pye Islands) had a fairly strong run of pink, chum and sockeye salmon; the Aialik Bay area had a sizable sockeye run; and Resurrection Bay had distinctive pink, chum, and sockeye runs. For those reasons, historical statistics are provided in the following paragraphs for three of the five salmon species. (Relatively small numbers of coho and king salmon are harvested in park waters, or elsewhere in the Outer District, so no specific statistics are provided for those species.)
Table 9-4. Salmon Harvest, by Number of Fish (in thousands) and Percentage of Total Harvest for Selected Periods, 1954-1994
| Year | chinook salmon (410) (#/pounds) |
sockeye salmon (420) (#/pounds) |
coho salmon (430) (#/pounds) |
pink salmon (440) (#/pounds) |
chum salmon (450) (#/pounds) |
salmon total (#/pounds) |
| Outer District Figures: | ||||||
| 1954-59 | 0 — 0.0% | 23.6 — 1.1% | 1.1 — 0.1% | 1,640.4 — 76.6% | 477.2 — 22.3% | 2,142.4 |
| 1960-65 | 0 — 0.0% | 25.9 — 0.7% | 3.7 — 0.1% | 2,936.8 — 81.1% | 654.7 — 18.1% | 3,621.2 |
Statistical Area 232 Figures: | ||||||
| Year | chinook salmon (410) (#/pounds) |
sockeye salmon (420) (#/pounds) |
coho salmon (430) (#/pounds) |
pink salmon (440) (#/pounds) |
chum salmon (450) (#/pounds) |
salmon total (#/pounds) |
| 1968-69 | 0 — 0.0% | 0.1 — 0.2% | 0 — 0.0% | 64.6 — 91.9% | 5.5 — 7.9% | 70.3 |
| 1970-74 | 0 — 0.0% | 37.6 — 13.3% | 0 — 0.0% | 190.9 — 67.6% | 53.8 — 19.1% | 282.4 |
| 1975-79 | 0.3 — 0.0% | 89.4 — 2.5% | 1.6 — 0.0% | 3,179.2 — 89.7% | 274.0 — 7.7% | 3,544.7 |
| 1980-84 | 0.1 — 0.0% | 153.5 — 5.6% | 0.5 — 0.0% | 2,224.5 — 81.1% | 364.0 — 13.3% | 2,743.1 |
| 1985-89 | 0 — 0.0% | 192.1 — 13.4% | 10.6 — 0.7% | 1,102.7 — 77.2% | 123.4 — 8.6% | 1,429.0 |
| 1990-94 | 0 — 0.0% | 34.3 — 4.4% | 1.0 — 0.1% | 723.5 — 93.3% | 15.9 — 2.1% | 775.1 |
Source: Tables 9-2 and 9-8.
Statistics collected during the 1960-1963 period show that in regard to pink salmon (see Table 9-5), Nuka Bay had fairly strong harvests during even-numbered years. These harvests numbered more than 25,000 fish per year, and comprised between 4% and 6% of the total Lower Cook Inlet harvest. Its odd-year harvests, however, were so small that they comprised less than 1% of the Lower Cook Inlet harvest. During all four of these years, the Resurrection Bay harvest was far less than that in Nuka Bay; in 1961 and 1963, in fact, the harvest was nonexistent. But the Port Dick harvest–just west of Nuka Bay–was far greater than in any park area.
Table 9-5. Commercial Pink Salmon Harvest for Selected Lower Cook Inlet Bays, 1959-1995
Figures given are in numbers of fish (in thousands), while percentages are those of the entire Lower Cook Inlet catch. (Lower Cook Inlet includes all Kenai Peninsula Streams between Anchor Point and Cape Fairfield, plus all west-side waters between Cape Douglas and the Iniskin Peninsula.) Source: ADF&G, 1995 Lower Cook Inlet Annual Finfish Management Report, Appendix Tables 19 and 20. T = trace (i.e., fewer than 50 fish), * = percentage less than 0.1%.
| Year | Port Dick Bay | Nuka Bay | Resurrection Bay | Total, Lower Cook Inlet |
| 1959 | 28.2 (22.6%) | 33.3 (26.7%) | 8.4 (6.7%) | 124.7 |
| 1960 | 257.4 (42.1%) | 26.6 (4.3%) | 5.8 (0.9%) | 611.6 |
| 1961 | 92.9 (30.6%) | 2.0 (0.6%) | 0 (0%) | 303.4 |
| 1962 | 1,118.3 (49.7%) | 129.8 (5.8%) | 0.1 (*) | 2,248.3 |
| 1963 | 19.0 (9.3%) | 0.3 (0.1%) | 0 (0%) | 203.6 |
| 1964 | 526.3 (49.9%) | 23.8 (2.3%) | 0.3 (*) | 1,055.4 |
| 1965 | 15.3 (13.2%) | 0 (0%) | 0 (0%) | 115.6 |
| 1966 | 296.8 (51.2%) | 0 (0%) | 0 (0%) | 579.2 |
| 1967 | 259.9 (69.2%) | 0.1 (*) | 1.2 (0.3%) | 375.5 |
| 1968 | 55.0 (9.4%) | 90.2 (15.4%) | 37.4 (6.4%) | 585.4 |
| 1969 | 51.5 (25.4%) | 0 (*) | 0 (0%) | 202.4 |
| 1970 | 193.8 (33.7%) | 48.4 (8.4%) | 40.2 (7.0%) | 574.3 |
| 1971 | 94.6 (24.1%) | 119.7 (30.5%) | 0 (0%) | 392.9 |
| 1972 | 0 (0%) | 0.3 (1.0%) | 18.2 (63.4%) | 28.7 |
| 1973 | 96.6 (31.4%) | 8.1 (2.6%) | 0 (0%) | 307.4 |
| 1974 | 0.6 (1.2%) | 0.7 (1.4%) | 0 (0%) | 50.6 |
| 1975 | 90.3 (8.5%) | 35.4 (3.3%) | 0 (0%) | 1,063.4 |
| 1976 | 0 (0%) | 0.1 (0.1%) | 35.4 (26.0%) | 136.4 |
| 1977 | 881.7 (68.1%) | 56.3 (4.4%) | 0 (0%) | 1,293.9 |
| 1978 | 63.6 (18.0%) | 6.3 (1.8%) | 29.7 (8.4%) | 352.6 |
| 1979 | 964.8 (32.3%) | 121.7 (4.1%) | 0 (0%) | 2,990.9 |
| 1980 | 133.3 (15.0%) | 12.8 (1.4%) | 155.8 (17.4%) | 889.7 |
| 1981 | 1,140.9 (35.7%) | 395.1 (12.3%) | 32.6 (1.0%) | 3,199.2 |
| 1982 | 44.0 (8.0%) | 8.7 (1.6%) | 137.4 (24.9%) | 551.6 |
| 1983 | 140.0 (15.1%) | 55.0 (5.9%) | 27.1 (2.9%) | 927.6 |
| 1984 | 84.6 (12.1%) | 4.4 (0.6%) | 122.3 (17.5%) | 700.6 |
| 1985 | 455.6 (37.0%) | 150.8 (12.3%) | 74.6 (6.1%) | 1,229.7 |
| 1986 | 304.0 (21.6%) | 97.8 (6.9%) | 36.5 (2.6%) | 1,408.3 |
| 1987 | 3.0 (1.5%) | 20.9 (10.4%) | 11.8 (5.9%) | 201.4 |
| 1988 | 5.9 (0.6%) | 0.2 (*) | 0.5 (0.1%) | 921.3 |
| 1989 | 0 (0%) | 43.0 (3.3%) | 0 (0%) | 1,296.9 |
| 1990 | 169.1 (44.1%) | 0.2 (0.1%) | 0 (0%) | 383.7 |
| 1991 | 289.7 (35.0%) | 10.6 (1.3%) | 0 (0%) | 828.7 |
| 1992 | 0.1 (*) | 0 (0%) | 0 (0%) | 479.8 |
| 1993 | 26.6 (3.1%) | 13.8 (1.6%) | 0.7 (0.1%) | 866.8 |
| 1994 | 1.6 (0.1%) | 11.6 (0.7%) | T (*) | 1,647.9 |
| 1995 | 0 (0%) | 21.4 (0.8%) | 0 (0%) | 2,848.5 |
Regarding chum salmon (see Table 9-6), the Nuka Bay harvest was fairly strong in both 1960 and 1961; the bay yielded more than 3% of the Lower Cook Inlet harvest in both years. During the following two years, however, the chum runs there slid into insignificance. As with pink salmon, the Nuka Bay harvests were consistently greater than in Resurrection Bay, which had almost no harvest activity, while the Port Dick harvest was many times greater than in Nuka Bay.
Table 9-6. Commercial Chum Salmon Harvest for Selected Lower Cook Inlet Bays, 1959-1995
Figures given are in numbers of fish (in thousands), while percentages are those of the entire Lower Cook Inlet catch. (Lower Cook Inlet includes all Kenai Peninsula Streams between Anchor Point and Cape Fairfield, plus all west-side waters between Cape Douglas and the Iniskin Peninsula.) Source: ADF&G, 1995 Lower Cook Inlet Annual Finfish Management Report, Appendix Table 22. T = trace (i.e., fewer than 50 fish), * - less than 0.1%.
| Year | Port Dick Bay | Nuka Bay | Resurrection Bay | Total, Lower Cook Inlet |
| 1959 | 42.4 (38.3%) | 1.7 (1.5%) | 0.1 (0.1%) | 110.8 |
| 1960 | 53.9 (46.4%) | 8.4 (7.2%) | 0.5 (0.4%) | 116.1 |
| 1961 | 36.8 (66.2%) | 1.7 (3.1%) | 0 (0%) | 55.6 |
| 1962 | 112.0 (62.5%) | 0.5 (0.3%) | 0 (0%) | 179.3 |
| 1963 | 110.8 (80.0%) | 1.5 (1.1%) | 0 (0%) | 138.5 |
| 1964 | 227.4 (70.3%) | 0 (0%) | 0 (0%) | 323.3 |
| 1965 | 14.2 (50.5%) | 0 (0%) | 0 (0%) | 28.1 |
| 1966 | 60.9 (47.2%) | 0 (0%) | 0 (0%) | 129.1 |
| 1967 | 36.0 (42.2%) | 1.5 (1.8%) | 0.1 (0.1%) | 85.4 |
| 1968 | 10.9 (14.5%) | 6.9 (9.2%) | 0.7 (0.9%) | 75.1 |
| 1969 | 5.4 (8.8%) | 0 (0%) | 0 (0%) | 61.2 |
| 1970 | 21.8 (9.7%) | 5.9 (2.6%) | 0.4 (0.2%) | 224.2 |
| 1971 | 0.7 (0.5%) | 0.1 (0.1%) | 0.4 (0.3%) | 148.6 |
| 1972 | 0 (0%) | 2.3 (3.0%) | 0.7 (0.9%) | 75.5 |
| 1973 | 33.4 (28.9%) | 40.8 (35.3%) | 0 (0%) | 115.5 |
| 1974 | 8.1 (42.2%) | 3.9 (20.3%) | 0 (0%) | 19.2 |
| 1975 | 6.8 (31.5%) | 3.6 (16.7%) | 0 (0%) | 21.6 |
| 1976 | 0 (0%) | 0.4 (0.8%) | 0 (0%) | 50.8 |
| 1977 | 25.6 (17.6%) | 17.4 (11.9%) | 0 (0%) | 145.8 |
| 1978 | 10.3 (14.0%) | 0.4 (0.6%) | 0.1 (0.1%) | 73.5 |
| 1979 | 79.0 (36.2%) | 14.7 (6.7%) | 0 (0%) | 218.5 |
| 1980 | 19.0 (25.9%) | 7.8 (10.6%) | 0.7 (1.0%) | 73.5 |
| 1981 | 85.8 (25.5%) | 3.8 (1.1%) | 2.4 (0.7%) | 336.1 |
| 1982 | 30.3 (15.3%) | 0.9 (0.4%) | 7.7 (3.9%) | 198.0 |
| 1983 | 18.0 (9.4%) | 0.8 (0.4%) | 6.9 (3.6%) | 192.3 |
| 1984 | 1.9 (2.1%) | 0.2 (0.2%) | 3.0 (3.2%) | 92.5 |
| 1985 | 9.6 (31.4%) | 0.8 (2.6%) | 3.0 (9.8%) | 30.6 |
| 1986 | 10.4 (12.6%) | 1.3 (1.6%) | 3.5 (4.2%) | 82.7 |
| 1987 | 27.1 (17.3%) | 1.6 (1.0%) | 13.9 (8.9%) | 157.0 |
| 1988 | 64.4 (20.0%) | 6.8 (2.1%) | 23.9 (7.4%) | 321.9 |
| 1989 | 0 (0%) | 0 (0%) | 0 (0%) | 11.3 |
| 1990 | 0.5 (7.1%) | T (*) | 0 (0%) | 7.0 |
| 1991 | 13.7 (56.6%) | T (*) | 0 (0%) | 24.2 |
| 1992 | 0.2 (1.0%) | 0 (0%) | 0 (0%) | 22.2 |
| 1993 | 0.7 (15.9%) | T (*) | 0 (0%) | 4.4 |
| 1994 | T (*) | T (*) | 2.5 (45.5%) | 5.5 |
| 1995 | 0 (0%) | 0.1 (0.6%) | 0.3 (1.9%) | 15.6 |
As to the sockeye run (see Table 9-7), the number of fish caught in both Aialik Bay and Nuka Bay was no larger, in general, than either the pink or chum harvest. But because the Lower Cook Inlet is not normally considered a significant sockeye region, these two bays often contributed more than 10% of the region's total harvest. More important, sockeye salmon's relatively high value (more than twice the price, on a per-pound basis, than either pinks or chums) ensured that both fishers and agency officials paid especial attention to the health of those runs. The Nuka Bay and Aialik Bay runs were far greater than were those in adjacent districts along Kenai Peninsula's southern coast.
Table 9-7. Commercial Sockeye Salmon Harvest for Selected Lower Cook Inlet Bays, 1959-1995
Figures given are in numbers of fish (in thousands), while percentages are those of the entire Lower Cook Inlet catch. (Lower Cook Inlet includes all Kenai Peninsula Streams between Anchor Point and Cape Fairfield, plus all west-side waters between Cape Douglas and the Iniskin Peninsula.) Source: ADF&G, 1995 Lower Cook Inlet Annual Finfish Management Report, Appendix Table 14. T = trace (i.e., fewer than 50 fish), * - less than 0.1%.
| Year | Port Dick Bay | Nuka Bay | Resurrection Bay | Total, Lower Cook Inlet |
| 1959 | 1.3 (6.0%) | 8.3 (38.4%) | 0 (0%) | 21.6 |
| 1960 | 0.2 (0.8%) | 6.7 (27.1%) | 0.1 (0.4%) | 24.7 |
| 1961 | 4.3 (18.9%) | 8.2 (36.0%) | 0 (0%) | 22.8 |
| 1962 | 2.6 (10.3%) | 5.1 (20.2%) | 0 (0%) | 25.3 |
| 1963 | 0.5 (3.3%) | 0.5 (3.3%) | 0 (0%) | 15.1 |
| 1964 | 0 (0%) | 0 (0%) | 0 (0%) | 20.7 |
| 1965 | 0 (0%) | 2.0 (14.3%) | 0 (0%) | 14.0 |
| 1966 | 0 (0%) | 0 (0%) | 0 (0%) | 15.3 |
| 1967 | 0 (0%) | 2.2 (7.6%) | 0 (0%) | 29.0 |
| 1968 | 0 (0%) | 1.5 (1.6%) | 74.5 (78.3%) | 95.2 |
| 1969 | 0 (0%) | 0 (0%) | 99.4 (80.9%) | 122.8 |
| 1970 | 3.1 (13.9%) | 1.0 (4.5%) | 1.7 (7.6%) | 22.3 |
| 1971 | 0 (0%) | 1.6 (7.2%) | 2.2 (9.9%) | 22.2 |
| 1972 | 0.3 (0.5%) | 26.1 (45.1%) | 0.1 (0.2%) | 57.9 |
| 1973 | 3.1 (10.6%) | 1.5 (5.1%) | 0 (0%) | 29.2 |
| 1974 | 0.2 (0.7%) | 0.2 (0.7%) | 0 (0%) | 27.4 |
| 1975 | 0.6 (2.1%) | 0 (0%) | 0 (0%) | 28.1 |
| 1976 | 0 (0%) | 18.9 (32.5%) | 0 (0%) | 58.2 |
| 1977 | 5.8 (5.8%) | 32.5 (32.5%) | 0 (0%) | 100.1 |
| 1978 | 0 (0%) | 10.7 (6.8%) | 0 (0%) | 156.4 |
| 1979 | 0 (0%) | 24.4 (37.9%) | 0 (0%) | 64.4 |
| 1980 | 0.1 (0.1%) | 21.5 (31.0%) | 0 (0%) | 69.4 |
| 1981 | 8.7 (7.9%) | 17.2 (15.6%) | 0.6 (0.6%) | 110.3 |
| 1982 | 3.0 (2.2%) | 66.3 (50.5%) | 0 (0%) | 131.3 |
| 1983 | 25.9 (13.8%) | 16.8 (9.0%) | 0 (0%) | 187.6 |
| 1984 | 50.8 (18.9%) | 29.2 (10.9%) | 3.4 (1.3%) | 269.0 |
| 1985 | 24.1 (8.6%) | 91.8 (32.9%) | 0.3 (0.1%) | 278.7 |
| 1986 | 3.0 (1.3%) | 48.4 (20.6%) | 0 (0%) | 234.9 |
| 1987 | 3.5 (1.4%) | 31.8 (12.8%) | 0.2 (0.1%) | 248.8 |
| 1988 | 20.2 (6.3%) | 9.5 (3.0%) | 0 (0%) | 319.0 |
| 1989 | 8.5 (5.2%) | 10.3 (6.3%) | 0 (0%) | 163.3 |
| 1990 | 7.7 (3.8%) | 5.7 (2.8%) | 0 (0%) | 203.9 |
| 1991 | 4.7 (1.5%) | 1.8 (0.6%) | 0 (0%) | 317.9 |
| 1992 | 0.4 (0.2%) | 0 (0%) | 0 (0%) | 176.6 |
| 1993 | 0.2 (0.1%) | 3.5 (1.5%) | 1.7 (0.7%) | 233.8 |
| 1994 | 0.6 (0.5%) | 5.9 (5.1%) | 9.0 (7.8%) | 115.4 |
| 1995 | 2.0 (0.8%) | 17.6 (6.6%) | 44.6 (16.8%) | 265.4 |
The Good Friday Earthquake and Its Aftermath
At 5:36 p.m. on March 27, 1964, a massive earthquake struck southcentral Alaska. The earthquake measured between 8.2 and 8.4 on the Richter scale; its epicenter was near the north end of College Fjord, approximately 50 miles west of Valdez. The earthquake and the resulting aftershocks, tsumanis and submarine landslides killed 115 people and caused an estimated $380 to $500 million in property damage. [64]
The earthquake devastated Seward, where 11 deaths were recorded and property damage totaled more than $14.6 million. The quake hit Seward, and the park coastline, particularly hard because although the epicenter was more than 100 miles to the northeast, the earthquake's main fault line (and thus its "area of epicenter") paralleled the coast and included most of the park. The park was thus subject to many of the quake's most devastating effects. The earthquake in the park lasted from 2-1/2 to 5 minutes. [65]
One of the earthquake's most substantial impacts was its effect on land elevations. Some areas of southcentral Alaska, in effect, rose from the sea; one site on Montague Island (in Prince William Sound) rose 33 feet. The area within the park, however, was in a zone of subsidence. Maps published as a result of post-earthquake scientific studies show that the quake's "axis of maximum subsidence" went right through the park; it was a sinuous line that wound from the western end of Kenai Lake to the eastern edge of Nuka Island. Areas that were relatively distant from that axis subsided only slightly; the southern tip of Aialik Peninsula, for instance, sank only a foot. But Aialik Bay dropped 4.5 feet, both Two Arm Bay and Shelter Cove (the latter in Nuka Bay) subsided 5.4 feet, and both Beauty Bay (in Nuka Bay) and Chance Cove (just east of McArthur Pass) dropped 6.6 feet. Some areas astride the axis fell as much as 7.5 feet. Near the Sather residence, on the western side of Nuka Island, the water rose and covered part of the warehouse; the quake also destroyed the adjacent boat dock. [66]
The other major impact caused by the March 27 earthquake was a series of tsunamis (large waves) that hit the coast within one-half hour of the quake. The quake generated a large tsunami out in the Gulf of Alaska; the tsunami rose in height as it reached the coast due to the funneling effect of the various fjords. In Resurrection Bay, the tsunami was an estimated 30 to 40 feet high as it neared the bay's northern end; a 30-foot wave slammed into Thumb Cove, on the bay's eastern side, and it was at least that high when it reached Seward. Waves entering Aialik Bay were far higher. [67] Gene Rusnak, a USGS employee, observed that a wave between 90 and 100 feet high hit on either side of Aialik Bay's terminus; spruce trees up to 18 inches in diameter were snapped throughout the area where the wave hit. These waves were particularly devastating because the quake generated submarine landslides that exacerbated the tsunami's effects. Huge waves also hit Port Dick; other bays between there and Aialik Bay were also probably affected, but specific details are lacking. [68]
The lowering of the landmass, in combination with the effects of the tsunami, had devastating consequences on the park's fish population. Both factors, particularly the former, inundated the gravel at stream mouths that was key to pink and chum salmon spawning. (The earthquake had varying impacts on sockeye populations, where spawning took place in upstream lakes; the Aialik Bay population was wiped out for years afterward, probably because of the tsunami's effects, while at Delight and Desire creeks, the impacts were significant but not devastating.) [69] The salmon industry was also crippled because facilities were destroyed. The quake wrecked canneries in Seldovia and elsewhere in lower Cook Inlet. In Seward, four seafood processors were destroyed; of those, Halibut Producers' Co-operative was back on line a year later, but Seward Seafoods and the other processors never reopened. Many fishing boats were destroyed in both locations, and the quake resulted in the death of at least one Seward-area fisherman. [70]
Statistics for the remainder of the decade illustrate the extent of the earthquake's destruction. Nuka Bay pink salmon harvests for 1964 were low, although within a normal range; but for the next three years they were almost nonexistent. The only productive year for the remainder of the decade was 1968, when the Nuka Bay fishery constituted more than 15 percent of the total Lower Cook Inlet pink salmon harvest. Similar impacts were recorded in nearby Resurrection Bay. But in Port Dick, to the west, the quake had few if any impacts on the pink harvest.
Chum salmon harvests followed a similar pattern. In both Nuka Bay and Resurrection Bay, no chum harvest was recorded from 1964 through 1966, inclusively. Both bays recorded a fairly healthy harvest in 1968 but none in 1969. The Port Dick area, meanwhile, saw chum harvest tumble from more than 100,000 per year during the 1962-64 period to just 10,000 fish in 1968 and 5,000 in 1969.
In regard to sockeye harvests, Aialik Bay suffered catastrophic devastation in the earthquake; no harvests of the species were recorded between 1964 and 1969, inclusively. Nuka Bay fared better, but only slightly; harvests during those years were recorded only in 1965, 1967, and 1968, and the harvests that were recorded lagged behind those that predated the earthquake. In Resurrection Bay, where sockeyes had been off-limits to fishermen for years, no harvests were recorded until 1968, when a hatchery program brought huge numbers of sockeyes. They remained high for another year, then dropped back to insignificant levels.
Fishing in Park Waters, 1970 to Present
No sooner had salmon populations begun to rebound from the earthquake's devastation than another hazard–cold weather–impacted the park's fishery. The winters of both 1970-71 and 1971-72 were "extremely cold years" in the words of the Lower Cook Inlet fisheries biologist. As a result of the environmental stress caused by those winters, the salmon runs and harvests were hit hard. As late as 1977, the East Arm of Nuka Bay was "kept closed to build up pink and chum stock depleted by the 1964 earthquake and severe winter conditions in the early 1970s." [71]
This report is intended to trace the major historical developments in the park's fishery. It is not the place to chronicle or explain the annual salmon harvests, particularly since the mid-1970s. The report shall, however, cover some of the major new actions that have affected the park's fishery in recent years (see Table 9-8 and Map 9-4).
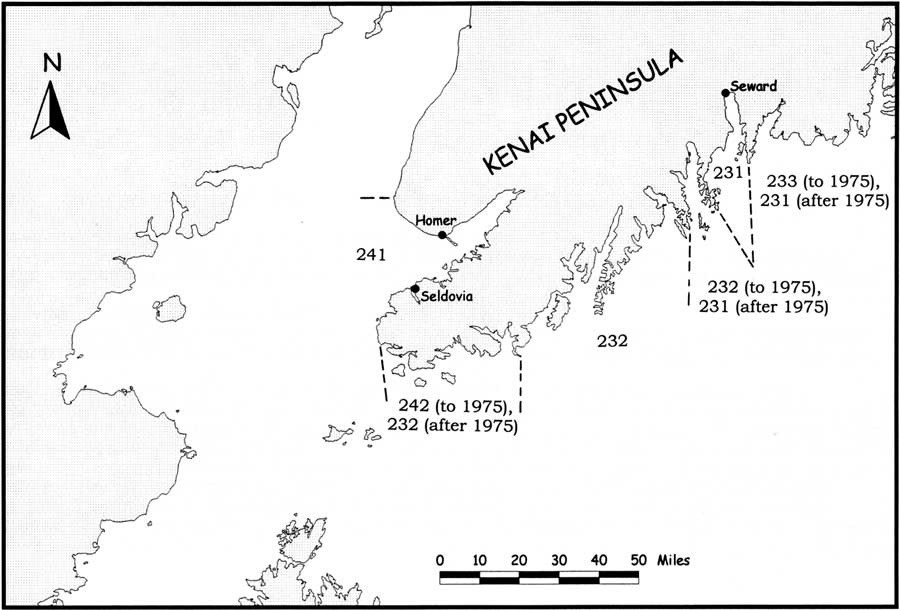
|
| Map 9-4. Lower Cook Inlet Statistical Areas, 1968-1995. (click on image for an enlargement in a new window) |
Table 9-8. Statistics on Park-Area (Statistical Area 232) Salmon Fishing, 1968-1995
| Year | chinook salmon (410) (#/pounds) |
sockeye salmon (420) (#/pounds) |
coho salmon (430) (#/pounds) |
pink salmon (440) (#/pounds) |
chum salmon (450) (#/pounds) |
salmon total (#/pounds) |
| 1968 | -0- | 4/ n.d. | 3/ n.d. | 13,155/ n.d. | 84/ n.d. | 13/246/ n.d. |
| 1969 | -0- | 92/ n.d. | 11/ n.d. | 51,533/ n.d. | 5,400/ n.d. | 57,036/ n.d. |
| 1970 | 2/ 54 | 4,129/ 21,470 | 19/ 116 | 59,518/ 214,261 | 6,602/ 44,234 | 70,270/ 280,135 |
| 1971 | 11/ 47 | 1,626/ 9,749 | 17/ 94 | 119,661/ 420,605 | 56/ 413 | 121,371/ 430,908 |
| 1972 | 7/ 37 | 26,420/154,665 | 3/ 16 | 682/ 2,394 | 2,434/ 18,369 | 29,546/ 175,481 |
| 1973 | 1/ 30 | 5,052/ 31,984 | 4/ 34 | 10,031/ 34,179 | 40,909/ 351,028 | 55,997/ 417,255 |
| 1974 | 1/ 30 | 398/ 1,917 | 27/ 204 | 1,082/ 4,380 | 3,871/ 31,045 | 5,379/ 37,576 |
| 1975 | -0- | 710/ 3,894 | 1/ 8 | 35,886/ 119,402 | 3,648/ 25,778 | 40,245/ 149,082 |
| 1976 | 7/ 42 | 18,886/117,509 | -0- | 93/ 333 | 412/ 3,383 | 19,398/ 121,267 |
| 1977 | 34/ 279 | 33,733/257,372 | 1,528/ 6,014 | 1,127,800/4,236,975 | 70,167/ 631,916 | 1,233,262/5,132,556 |
| 1978 | 236/11,031 | 10,695/ 71,597 | 45/ 365 | 70,080/ 256,708 | 19,224/ 144,071 | 100,280/ 483,772 |
| 1979 | 30/ 346 | 25,297/167,662 | 142/ 1,068 | 1,945,529/6,713,115 | 180,558/1,526,669 | 2,151,556/8,408,860 |
| 1980 | 10/ 77 | 22,514/121,500 | 16/ 133 | 154,041/ 506,266 | 32,246/ 248,250 | 208,827/ 876,226 |
| 1981 | 61/ 833 | 18,133/109,835 | 485/ 2,174 | 1,714,115/6,687,327 | 238,393/1,912,968 | 1,971,187/8,713,137 |
| 1982 | 129/ 1,629 | 66,781/431,669 | 92/ 949 | 67,523/ 224,550 | 63,075/571,414 | 197,600/1,230,211 |
| 1983 | 14/ (CD) | 16,835/ 95,547 | 54/ 479 | 199,794/ 666,357 | 27,203/ 241,565 | 243,900/1,003,948 |
| 1984 | 3/ (CD) | 29,276/144,046 | 41/ 412 | 89,085/ 319,979 | 3,204/ 26,900 | 121,609/ 491,337 |
| 1985 | 19/ 121 | 91,957/499,664 | 3,210/39,571 | 618,222/2,322,644 | 11,844/ 100,425 | 725,252/2,962,425 |
| 1986 | 6/ 64 | 48,472/278,627 | 5,052/53,003 | 401,755/1,399,956 | 11,701/ 93,571 | 466,986/1,825,221 |
| 1987 | 14/ 118 | 31,845/210,437 | 2,481/22,283 | 23,890/ 88,922 | 28,663/221,052 | 86,893/ 542,812 |
| 1988 | 5/ 88 | 9,501/ 58,788 | 2/ (CD) | 6,094/ 21,109 | 71,202/ 640,101 | 86,804/ 720,086 |
| 1989 | 1/ (CD) | 10,286/ 60,244 | 72/ (CD) | 52,677/ 181,767 | 43/ 276 | 63,073/ 242,287 |
| 1990 | 2/ (CD) | 17,404/ 76,966 | 74/ 483 | 191,320/ 585,250 | 614/ 4,121 | 209,412/ 666,820 |
| 1991 | 2/ (CD) | 6,408/ 30,207 | 12/ 70 | 359,664/ 992,328 | 14,337/ 95,915 | 380,423/1,118,520 |
| 1992 | -0- | 572/ (CD) | 1/ (CD) | 146/ 490 | 181/ 1,633 | 900/ 2,123 |
| 1993 | 2/ (CD) | 4,613/ 27,012 | 119/ 937 | 159,159/ 461,911 | 970/ 6,607 | 164,863/ 496,467 |
| 1994 | -0- | 5,930/ 31,620 | 993/10,342 | 13,200/ 41,574 | 32/ (CD) | 20,155/ 83,536 |
| 1995 | 12/ 141 | 17,642/ 96,224 | 1,272/ 8,868 | 192,098/ 601,532 | 474/ 3,344 | 211,498/ 710,109 |
Explanatory Notes to Table 9-8:
Species Identification: Salmon statistics, over the years, have been tabulated for Area 232; the specific stretch of coastline defined within this statistical area is defined in "Area Identification," below. The three-digit numbers following each species name have been assigned by the ADF&G to identify the various species.
Area Identification: There is a line between the 1973 and 1974 figures, and also between the 1975 and 1976 figures, because of changes in the geographical area in Statistical Area 232. From 1968 through 1973, Area 232 included the stretch of coastline between Gore Point and Aialik Cape. After the 1973 season, the statistical area’s eastern boundary was moved west from Aialik Cape to Aligo Point; that action moved Statistical Area 231 (which included Resurrection Bay) west to include Aialik Bay. After 1975, the western boundary of Statistical Area 232 was moved west from Gore Point to Point Adam; after that action, Statistical Area 232 included all of former Statistical Area 242). As a result of this action, post-1975 figures for Area 232 are identical with those for the Outer District. In addition, post-1975 figures (and, to a lesser extent, 1974 and 1975 figures) are not as accurate a guide to park fishing activity as are the 1968-1973 figures.
BOLD numbers indicate the most prevalent species for a given year. Numbers in ITALICS, provided in the "total/pounds" column, are less than the total for all salmon species because one or more columns have no data due to confidentiality restrictions.
(CD) — confidential data. When fewer than four permittees fished for a given species in a given year, ADF&G censors harvest data in order to protect the privacy of an individual permittee’s harvest. The term "CD", therefore, shows that there were 1, 2, or 3 active permittees.
Source: Herman Savikko (ADF&G, Juneau) letter, June 12 and July 11, 1997.
A major management change, inaugurated in 1975, altered the system by which Alaska's salmon have been harvested. The Alaska Commercial Fisheries Entry Commission, for the first time, began issuing limited entry permits to potential fishers. That system limited the number of fishers active in any given fishery and thus exerted greater management control. The average annual harvest volume, both on a per-boat and total yield basis, rose after the new system was implemented; increases were seen both in park waters and elsewhere in Lower Cook Inlet. Total harvest volumes in park waters remained relatively high for more than a decade after the limited entry system was implemented. There is no evidence that harvest volumes increased due to the new system; instead, salmon productivity probably rose due to improved stream and harvest management techniques. [72]
Another significant change in the park fishery took place in 1987. Prior to that year, the only approved salmon harvesting methods along the outer coast were by hand purse seines (or "pocket seines") and beach seines; these seines could only be used near the coastline or in shallow waters. In 1987, however, a group of seiners prevailed on the Board of Fisheries to modify the regulations in order to allow the use of power purse seines. These seines were attached to larger boats; they allowed fishers to harvest the resource more efficiently and gave fishers from other areas (where power purse seines had been legalized years before) the flexibility to fish the outer coast's waters. [73]
Changes were also taking place in the Delight and Desire lakes area of Nuka Bay. In 1972, fishers harvested the creek system's first major sockeye run; it totaled 26,100 fish, which was more than three times any previous harvest. After a lull, harvest levels shot up again in 1976. To gain more data about the area's salmon resource, Fish and Game personnel spent the following two summers maintaining a counting weir in the area. [74]
Meanwhile, a new salmon-bearing stream was emerging from the retreating ice of McCarty Fjord. North of Desire Lake, a new lake began to be seen which, as late as 1974, had been covered by a glacier. The lake, variously called Delectable, Delusion, or Ecstacy Lake, first appeared in 1985 or 1986; it has been contributing to Nuka Bay's salmon harvest since the late 1980s, if not before.
In 1985, the Delight-Desire area supported a substantial coho (silver) salmon harvest for the first time. Coho salmon, historically, had never been numerous along the Kenai's southern coast; since 1954, harvest levels had never exceeded 2,000 and had exceeded 500 only three times. But in each of the three years from 1985 through 1987, more than 2,000 salmon were harvested in the Outer District, many of them from the Delight-Desire lake system. [75]
As a final note pertaining to the park's salmon fishery, the creation of a limited entry permit system under the Commercial Fisheries Entry Commission (and the statistical data bases that were a by-product of that commission) allowed park managers to accurately recognize, for the first time, the residence of park fishers. As noted above, anecdotal evidence has suggested that the first commercial salmon fishers in the fjords hailed from Seward. Cook Inlet fishers did not sail east of Gore Point; as one longtime Homer fisherman phrased it, there was "kind of a gentlemen's agreement in the early days not to invade each other's territory." [76] As early as the late 1940s, however, Fish and Wildlife Service records were noting that a Port Graham fisherman was active in Nuka Bay. Fisheries personnel stationed in park waters during the mid-1950s suggested that most Nuka Bay salmon fishers were either from Lower Cook Inlet or from locations away from the Kenai Peninsula, while most Aialik Bay fishermen were based in Seward. Biologists were also quick to note that many salmon fishers passed through the area and had valid permits to fish in park waters; some of those people, however, did not fish there. [77] No statistical evidence to prove or disprove these generalities was available until 1975 (see Table 9-9).
Table 9-9. Residence of Commercial Salmon Fishers Active in Kenai Fjords National Park, 1975-1995
The following chart shows the residence of permit holders who actively fished all species of salmon, for commercial purposes only, in the waters of Kenai Fjords National Park (Statistical Area 232) from 1975 to 1995. Note: In 1975 and 1976, Statistical Area 232 extended east to Aialik Cape (and thus included Aialik Bay), but from 1977 through 1995, the coast east of Aligo Point (including Aialik Bay) was in another statistical area.
The areas of residence are defined as follows:
| Homer Area = Homer, Anchor Point, Halibut Cove | Seward = Seward (only) |
| Seldovia Area = Seldovia, Port Graham, Nanwalek (English Bay) | Other = all other locations |
| Homer Area | Seldovia Area | Seward | Other | Total | |||||
|---|---|---|---|---|---|---|---|---|---|
| Year | number | % of total | number | % of total | number | % of total | number | % of total | number |
| 1975/fishers | 0 | 0.0% | 2 | 25.0% | 2 | 25.0% | 4 | 50.0% | 8 |
| fish | 0 | 0.0% | n.d. | n.d. | n.d. | n.d. | 10,357 | 25.7% | 40,245 |
| 1976/fishers | 3 | 20.0% | 7 | 46.7% | 4 | 26.7% | 1 | 6.7% | 15 |
| fish | n.d. | n.d. | 12,815 | 66.1% | 1,975 | 10.2% | n.d. | n.d. | 19,398 |
| 1977/fishers | 22 | 40.0% | 20 | 36.4% | 9 | 16.4% | 4 | 7.3% | 55 |
| fish | 609,128 | 49.4% | 455,764 | 37.0% | 145,543 | 11.8% | 22,827 | 1.9% | 1,233,262 |
| 1978/fishers | 10 | 25.6% | 16 | 41.0% | 8 | 20.5% | 5 | 12.8% | 39 |
| fish | 12,090 | 12.1% | 38,058 | 38.0% | 46,407 | 46.3% | 3,725 | 3.7% | 100,280 |
| 1979/fishers | 22 | 34.9% | 23 | 36.5% | 10 | 15.9% | 8 | 12.7% | 63 |
| fish | 878,866 | 40.8% | 676,727 | 31.5% | 348,875 | 16.2% | 247,088 | 11.5% | 2,151,556 |
| 1980/fishers | 20 | 37.0% | 20 | 37.0% | 6 | 11.1% | 8 | 14.8% | 54 |
| fish | 87,926 | 42.1% | 68,648 | 32.9% | 24,924 | 11.9% | 26,756 | 12.8% | 208,827 |
| 1981/fishers | 25 | 37.3% | 19 | 28.4% | 10 | 14.9% | 13 | 19.4% | 67 |
| fish | 880,137 | 44.7% | 460,062 | 23.3% | 304,516 | 15.4% | 326,472 | 16.6% | 1,971,187 |
| 1982/fishers | 15 | 36.6% | 16 | 39.0% | 6 | 14.6% | 4 | 9.8% | 41 |
| fish | 69,068 | 35.0% | 71,861 | 36.4% | 37,435 | 18.9% | 19,236 | 9.7% | 197,600 |
| 1983/fishers | 11 | 25.0% | 17 | 38.6% | 9 | 20.5% | 7 | 15.9% | 44 |
| fish | 72,552 | 29.7% | 77,292 | 31.7% | 71,509 | 29.3% | 21,806 | 8.9% | 243,886 |
| 1984/fishers | 8 | 25.0% | 14 | 43.8% | 5 | 15.6% | 5 | 15.6% | 32 |
| fish | 20,336 | 16.7% | 67,495 | 55.5% | 5,116 | 4.2% | 30,849 | 25.4% | 121,606 |
| 1985/fishers | 10 | 28.6% | 10 | 28.6% | 10 | 28.6% | 5 | 14.3% | 35 |
| fish | 196,418 | 27.1% | 207,355 | 28.6% | 242,621 | 33.5% | 78,858 | 10.9% | 725,252 |
| 1986/fishers | 13 | 32.5% | 10 | 25.0% | 9 | 22.5% | 8 | 20.0% | 40 |
| fish | 162,407 | 34.8% | 119,472 | 25.6% | 118,564 | 25.4% | 66,543 | 14.2% | 466,986 |
| 1987/fishers | 9 | 28.1% | 8 | 25.0% | 9 | 28.1% | 6 | 18.8% | 32 |
| fish | 13,083 | 15.1% | 18,893 | 21.7% | 45,882 | 52.8% | 9,035 | 10.4% | 86,893 |
| 1988/fishers | 13 | 41.9% | 7 | 22.6% | 9 | 29.0% | 2 | 6.5% | 31 |
| fish | 53,311 | 61.4% | 15,785 | 18.2% | 17,204 | 19.8% | 502 | 0.6% | 86,802 |
| 1989/fishers | 2 | 20.0% | 3 | 30.0% | 3 | 30.0% | 2 | 20.0% | 10 |
| fish | n.d. | n.d. | n.d. | n.d. | n.d. | n.d. | n.d. | n.d. | 63,006 |
| 1990/fishers | 22 | 46.8% | 8 | 17.0% | 6 | 12.8% | 11 | 23.4% | 47 |
| fish | 71,150 | 34.0% | 39,923 | 19.1% | 18,124 | 8.7% | 80,217 | 38.3% | 209,412 |
| 1991/fishers | 18 | 51.4% | 6 | 17.1% | 5 | 14.3% | 6 | 17.1% | 35 |
| fish | 210,197 | 55.3% | 76,524 | 20.1% | 9,301 | 2.4% | 84,401 | 22.2% | 380,421 |
| 1992/fishers | 2 | 40.0% | 1 | 20.0% | 1 | 20.0% | 1 | 20.0% | 5 |
| fish | n.d. | n.d. | n.d. | n.d. | n.d. | n.d. | n.d. | n.d. | 327 |
| 1993/fishers | 10 | 47.6% | 5 | 23.8% | 3 | 14.3% | 3 | 14.3% | 21 |
| fish | 79,373 | 48.1% | 7,732 | 4.7% | n.d. | n.d. | n.d. | n.d. | 164,861 |
| 1994/fishers | 1 | 16.6% | 2 | 33.3% | 3 | 50.0% | 0 | 0.0% | 6 |
| fish | n.d. | n.d. | n.d. | n.d. | n.d. | n.d. | n.d. | n.d. | 20,123 |
| 1995/fishers | 5 | 38.5% | 3 | 23.1% | 4 | 30.8% | 1 | 7.7% | 13 |
| fish | 127,984 | 60.5% | n.d. | n.d. | 38,495 | 18.2% | n.d. | n.d. | 211,498 |
Source: State of Alaska, Commercial Fisheries Entry Commission, "Salmon Seine Statistics by Residence City Areas, 1975-1995" (Project Number 97146), September 8, 1997. n.d.=no data.
Commercial Fisheries Entry Commission statistics suggest, fairly conclusively, that a majority of the salmon fishers active in Statistical Unit 232 (which includes most of the park's waters) during the 1975-1995 period have been Lower Cook Inlet residents. Not surprisingly, those fishers have been responsible for a majority of the salmon harvested. In 1977, for example, 76.4% of the fishers harvested in Statistical Area 232 hailed from Lower Cook Inlet communities; these fishers were responsible for 86.4% of the fish harvest. In 1980, Lower Cook Inlet fishers comprised 74% of all park fishers and brought in 75.0% of the area's salmon harvest; and in 1983, Lower Cook Inlet residents accounted for 63.6% of all park fishers and 61.4% of the salmon harvest. The only years in which Lower Cook Inlet fishers did not account for a majority of park-area fishers and a majority of the salmon harvested in the park was in 1975 (when few statistics were available) and in 1987. Seward-area fishers have generally accounted for between 10 and 35 percent of all park-area fishers, and 10 to 35 percent of the total salmon harvest. Fishers residing away from the Kenai Peninsula have usually accounted for 5 to 25 percent of all park fishers, and 5 to 25 percent of the total salmon harvest.
kefj/hrs/hrs9b.htm
Last Updated: 26-Oct-2002