Wildlife Managment: National Park
Service
Use of GIS to Manage Habitat for Species
It’s all about habitat. Well maybe
not all. But for the National Park Service, the future of thousands of
plant and animal species depends on the preservation and restoration of
wild places in our country. Habitat supports the California condor as
it
swoops over the Grand Canyon. It offers refuge to the desert tortoise
that
rests in its den at Joshua Tree National Park. And it quenches the
thirsty
roots of the prairie fringe orchid at Pipestone National Monument in
Minnesota.
In all, the NPS manages some 84 million acres of public land for
thousands
of plant and animal species. Of those, hundreds are threatened or
endangered
by declining populations and/or imperiled habitat. In some cases, a
species
might survive only in a particular national park, making the protection
of its homeland paramount.
As the NPS manages our parklands, it
must
answer a series of basic but crucial questions about the geographic
relationships
of species to their habitats. These spatial questions start with:
· Where is the species located?
· What is the extent of its habitat?
· What environmental factors affect
that habitat?
Each of these questions will include a
series of more refined issues. This is the realm of GIS. Generations of
biologists have used hand-drawn habitat maps, aerial photos, and
topographic
maps to prepare their analyses. Now they are making the
transition
to GIS to improve the quality and timeliness of their work.
As we apply GIS technology to NPS land
management, we are reminded that managing habitat for endangered
species
has some challenges unique from other species. For example, biologists
might not reveal certain data to the general public, particularly if
doing
so would make a species vulnerable to poaching or harassment. Yet
co-workers, researchers and other agencies might have a legitimate need
for otherwise secure information. During a wildfire, for example,
firefighters
can protect a species if they know where it lives. Today, the use of
GIS
to manage habitat reflects a growing trend in the National Park
Service,
as staff at each park decide on the best approach for each species.
Cay Ogden
Wildlife Ecologist and T&E Coordinator
National Park Service, Intermountain Region
Articles:
Brian Barns, Organ Pipe Cactus NM
Determining Foraging and Roosting Areas
for Mastiff Bats (Eumops spp.) Using Radio Telemetry
Tracking bats as they zigzag through
the
night sky became the focus of a study to learn the roosting patterns,
range
and routes of a little-understood tropical species found in the Organ
Pipe
Cactus National Monument in Southern Arizona. Wildlife researchers
wanted
to know more about the history and habits of Underwood’s mastiff bat
along
the Mexican border, where the nocturnal creature faces increased
threats
from human population, tourism, industrialization and other changes in
land use. Using radio telemetry to track the bats, U.S. researchers in
a cooperative effort with the adjacent Pinacate Biosphere Reserve in
Mexico
found that the species forages over wide areas of the Sonoran desert
along
the international border, averaging 37 square miles from rural to
agricultural
to semi-urban areas on a typical night. And for the first time, they
learned
from bats outfitted with radio transmitters that this species roosted
in
cavities carved out of saguaro cactus by woodpeckers. To illustrate the
habits of the bat, researchers put their data on GIS maps that show the
home ranges, the roosting areas and the typical routes used by the
three
bats tracked for the study. The NPS and other agencies will use the
maps
to help them develop and improve long-term wildlife strategies for the
species. They also created an educational poster of their findings and
are translating it to Spanish for outreach at the sister Pinacates
reserve
and schools across the border.
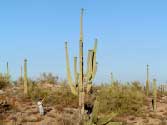
Photo of Mexican Biosphere researcher, Juan Miranda of El Pinacate,
locates a bat roost using radio telemetry. This mature saguaro has
dozens
of cavities used by several species of birds as well as the tagged
Eumops
bat.
|
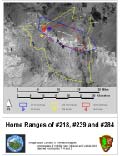
Map showing the observed home ranges of all three bats that were
tracked.
Using radio telemetry and signal triangulation, the bats could be
followed
from the moment they left a roost until returning after hours of
foraging.
|
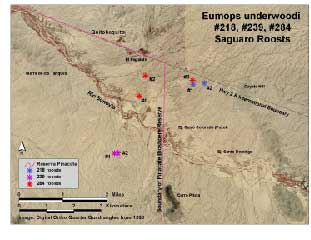
Map of roosting area used by the tagged bats. Each bat used one saguaro
cavity as shelter during the day, sometimes changing cavities after
foraging
at night. Quitobaquito is the closest dependable large water source.
|
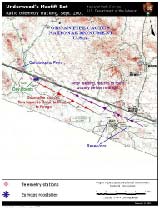
Map shows a typical route used by the bats as they searched for food.
|
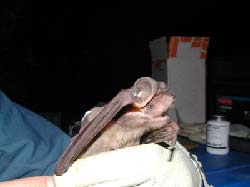
Photo of a Eumops bat caught and tagged at Quitobaquito Pond. After
release, the radio signal was tracked by researchers from atop hills
along
the US/Mexican border
|
|
Click for Technical Article
Neal Darby, Great Basin NP
A Pilot Geographical Information
Systems
(GIS) Assessment of Rocky Mountain Bighorn Sheep Habitat in and Around
Great Basin National Park, Nevada
Bighorn sheep are getting help from
high
technology, including GIS, as wildlife biologists try to prevent a
symbol
of the West from vanishing from Great Basin National Park in Nevada.
Today, fewer than a dozen Rocky Mountain
bighorn remain in the rugged Snake Range in and around the park, where
hundreds of the majestic creatures once roamed. Early on, wildlife
biologists
tried to bolster the herd by adding bighorn sheep from other areas.
Those
efforts failed, and the herd continued to dwindle even after the
creation
of the national park in 1986.
In 2001, wildlife biologists used GIS
technology to see if the loss of sheep habitat played a role in the
herd’s
woes. Using a GIS software program called ArcView developed by ESRI,
researchers
evaluated whether the herd had enough room to survive and grow.
The resulting GIS map showed the sheep
still had plenty of room in general but barely enough to bear and raise
their young. Bighorn ewes and their newborn need areas with plenty of
grass
and water during the spring lambing season. They also need open areas
where
they can spot mountain lions and other predators and escape pursuit
over
rocky slopes. One GIS map layer identified the southerly slopes where
the
snows melt early and provide grasses for forage. Another layer showed
the
availability of water, and a third identified types of vegetation that
indicate open areas and offer protection from predators. From this
information,
wildlife biologists and fire managers are using GIS to plan remedies,
such
as prescribed burns and thinning of forests, to restore suitable
lambing
areas in hopes that the herd will one day thrive again in its historic
range.
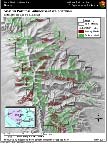
Areas of vegetation with minimal horizontal visibility that if managed
would enhance or restore Rocky Mountain Bighorn Sheep Habitat
|

Location and distribution of four categories of Rocky Mountain Bighorn
Sheep habitat (overall suitable, summer, winter and lambing habitat)in
Great Basin National Park.
|
Click for Technical Article
Dr. Donna J. Shaver U.S. Geological
Survey,
Darrell Echols, Padre Island NS
Sattelite Tracking of Endangered Kemp's
Ridley Sea Turtles
Tracking sea turtles from space has
helped
researchers predict when and where these endangered creatures will lay
clutches of eggs off the coast of Texas in the Gulf of Mexico. The
study
used satellite telemetry and GIS mapping to follow 23 Kemp’s ridley sea
turtles that nested in or near Padre Island National Seashore, where
wildlife
biologists have spent more than 25 years trying to re-establish a
turtle
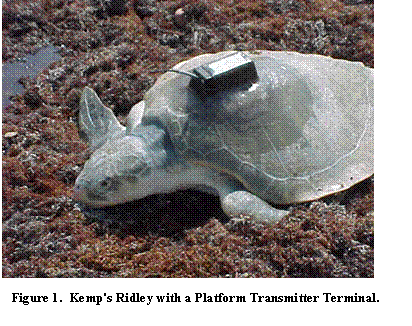
nesting colony. Researchers outfitted 23 of the turtles with radio
transmitters
between 1997 and 2003 and then monitored their travels during and after
the nesting season. In the nation’s first study of its kind for this
endangered
species, researchers wanted to see how the turtles used their habitat
and
where they would lay successive egg clutches. The study also evaluated
potential threats to the turtles in the national seashore and gulf.
Researchers
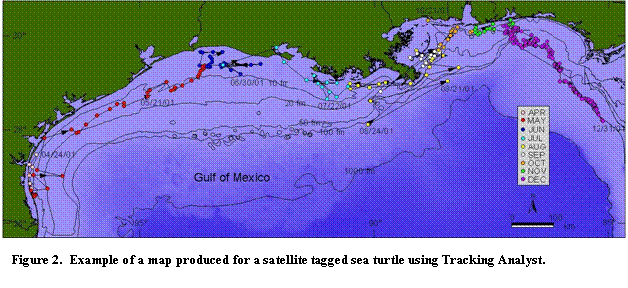
downloaded data gathered in the study into GIS maps. They used the data
to predict when and where four turtles would lay their clutches, thus
improving
protection of the nesting turtles and their eggs. The information also
helped researchers evaluate experimental efforts to create a second
nesting
colony.
|
|
Click for Technical
Article
Patrick Flaherty, Pinnacles NM
California Condor Viewshed Analysis
A GIS map has given researchers at
Pinnacles
National Monument a bird’s eye view of what endangered California
condors
will see from their release pen atop a ridge in New Mexico. The
monument
needed a way to deliver water and lead-free animal carcasses to the
condors.
Wildlife biologists also wanted to monitor the behavior and health of
the
birds from a nearby observation post. At the same time, researchers did
not want to be in the line of sight of the six captive-bred condors as
they return to the wild. To solve the problem, the NPS collected visual
data and created a GIS map. Green patches on the map represented what
condors
will view from their release pen. The map showed that condors would not
see a planned trail to the release pen and observation post. By making
themselves scarce, researchers hope the birds will learn to hunt and
socialize
in the region for the first time in decades and help make the
reintroduction
program a success in the monument starting in late 2003.
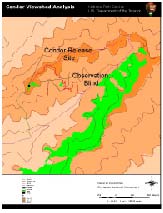
Condor Viewshed Analysis
|
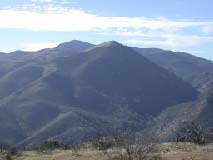
Mt. Definance and N. Chalone Peak looking to the south
|
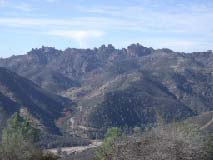
Pinnacles "High Peaks" looking west seen from the condor release site
|
|
Click for Technical Article
Seth P.D. Riley and
Denise
Kamradt, Santa Monica Mountains NRA
Effects of Urbanization and Habitat
Fragmentation on Bobcats and Coyotes in Southern California
Wildlife researchers found the
unexpected
when they studied how bobcats and coyotes cope with the loss of natural
environment in and around the Santa Monica Mountains National
Recreation
Area in California. Researchers had captured 50 bobcats and 86 coyotes,
attached radio-collars and monitored their movements, entering their
locations
into a database displayed on GIS maps, using ArcView software developed
by ESRI. Researchers have long known that carving up natural areas with
roads, housing tracts and other development can threaten wildlife
populations.
Yet a study of these two species in the hills west of Los Angeles found
survival rates similar to those of bobcat and coyote populations that
lived
in areas unspoiled by development. Researchers suspect that the
relatively
high survival rate may have resulted from the mild climate, plentiful
prey,
and absence of hunting and trapping. At the same time, rodent poisons
and
vehicle collisions caused a significant number of bobcat and coyote
deaths,
indicating the pervasive impact of humans and development on wildlife,
even within the recreation area. Both species shifted their activity
from
day to night, particularly in developed areas, perhaps because fewer
people
are out then. And the animals ranged mostly in natural areas.
Researchers
concluded that they need to learn more about the requirements of
carnivores
in developing areas and educate the public on the need to protect
nature
reserves and use rodent poisons sparingly and correctly.
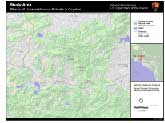
Figure 1. Study Area map showing land-use classification of bobcat
and coyote study area in Los Angeles and Ventura Counties, California.
The landscape within the study area was classified according to three
land-use
types: developed areas, altered open
|
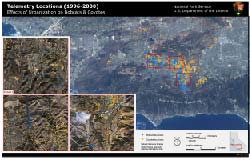
Figure 2. Map showing bobcat and coyote telemetry locations (1996-2000)
used in this study.
|
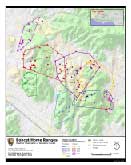
Figure 3. Home ranges (95% MCPs) of male and female bobcats relative
to land-use in the Simi Hills region, Ventura County, California.
Altered
open areas include low-density residential areas, golf courses, and
small
vegetated patches or strips.
|

Table 1. Home range size and urban association of bobcats and coyotes
in the Santa Monica Mountains and Simi Hills.
|
Click for Technical Article


