Jamestown Pipestems with Pie Charts
Jamestown Pipestems
Archeologists have always used maps to document and share information about ancient ruins, buried artifacts and other sites. The use of computers and GIS in archeology have transformed mapping from simple and elegant cartography into a powerful tool for synthesizing, analyzing, and integrating information. For years, archeologists have used historical maps, topographic maps, aerial photographs, and satellite imagery to do their work, such as finding the Chacoan roads in New Mexico or mapping the Knife River Indian Villages in North Dakota. Archeologists embrace GIS because the technology easily displays patterns of information and illustrates geographic relationships between sets of data on maps.
Now out of its infancy, GIS has gained widespread acceptance as a tool for management and analysis. Current GIS technology brings together data and maps in a way not possible a decade earlier, whether the scale of analysis is archeological survey or excavation. Modeling and statistical analysis are not new to archeology. But today’s archeology can incorporate many layers of data within a GIS to create models that help predict where sites might be located and how erosion will impact ruins. Archeologists can resurrect old data sets and apply them to new problems. The outcome might be a statistical model that maps change through time or a map that shows the location and density of artifacts in an ancient village. GIS is but one of the many tools of modern technology that also include standardized electronic topographic maps, geographic imagery, and cultural and environmental data layers. The development of digitized archaeological data and their availability in electronic formats motivated archeologists to adopt the tools of GIS for management. National Park Service archeologists can use digital archives, artifact data, and databases to help protect, understand and explain the value of archeological sites nationally. GIS map layers might include archeological data, base maps, imagery, and different kinds of environmental information. Archeologists use the maps to plan, research, and monitor sites. In this way, GIS and cultural resource databases assist long-range planning, budgeting, and decision making at all levels.
With government under pressure to show the economic value of its services and resources, GIS has increased productivity, data accuracy, service, and public education. This includes faster response to data requests and to emergencies such as wildfires, vandalism, and looting of archeological sites. Archeologists now routinely collect data and transfer them to GIS maps the same day. Direct downloads save time, reduce human error, and improve data interpretation. The future role of GIS in archeology should enhance resource protection, public education, and stewardship in our national parklands.
Steve Baumann
Archeology
Dave Frederick, Colonial NHP
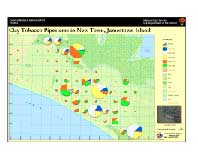
Clay Tobacco Pipestems in New Town,
Jamestown Island
English settlers from the Jamestown
colony
in Virginia have left us a blueprint of urban growth, if clay tobacco
pipe
stems found in the “New Towne” area are any indication. Widespread
excavations
of the first permanent English colony nearly 400 years ago have turned
up an enormous number of artifacts in the New Towne, pipe stems among
them.
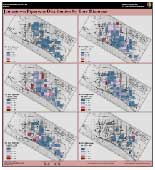
Updating earlier findings, Colonial National Historical Park imported
archeological
site data into an ESRI geo-database to show the numbers and sizes of
pipe
stems found in 100-foot square grids overlaid on the New Towne area of
Jamestown Island. The park service, which administers the site together
with Association for the Preservation of Virginia Antiquities, assigned
a range of dates to the pipe stems, based on their bore diameter, and
on
J.C. Herrington’s archaeological 1954 work, “Dating Stem Fragments of
Seventeenth
and Eighteenth Century Clay Tobacco Pipes.” The findings help plot the
haphazard course on New Towne settlement, daily life, and later
abandonment
in the 17th Century.
|
Jamestown Pipestems with Pie Charts |
Jamestown Pipestems |
The Western Arctic National Parklands
in
Alaska feature some of the most remote wilderness in America. Bering
Land
Bridge National Preserve on the Seward Peninsula is a remnant of the
migration
route for people, plants and animals between Asia and North America.
Kobuk
Valley National Park, Cape Krusenstern National Monument, and Noatik
National
Preserve are a mix of sand dunes, rivers, ice wedges, coastal plains,
and
lagoons near Kotzebue, Alaska. National park archeologists heavily
depend
on GIS to manage this vast area of more than 11-million acres. The park
service used GIS to display archeological sites, cultural uses, travel
routes, native lands, and other themes on US Geological Survey maps.
Archeologists
use the maps to assess environmental threats, sort new information, and
plan for the future. In one case, GIS maps showed the location of drums
of hazardous waste threatening archeological sites. Equally important,
the four national preserves use GIS to increase the visual impact of
posters
and slide shows in public and professional settings.
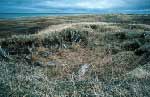 Photo showing house remains |
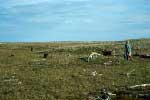 Photo showing the industrial drum clean up efforts |
|
|
|
A century of ranching, grazing, and
storm
and wave erosion is threatening fossils, artifacts and ancient American
Indian villages on Santa Rosa Island near Los Angeles. The 55,000-acre
island, part of Channel Islands National Park, supported a vibrant
culture
for most of the last 10,000 years. Archeologists have documented more
than
600 sites, and human remains found there are among the oldest known in
North America. Soil erosion and damage to streams from cattle and
non-native
deer and elk all combine to threaten cultural and natural resources. To
protect the island, the park service used GIS and other technology to
identify
and model the areas most at risk. The park service also created a model
of potential prehistoric sites. Using ArcView software developed by
ESRI,
the park service studied datasets on vegetation, geology and elevation
and reviewed information on roads, streams, pastures and fire history.
And experts these fields of study offered their views on the biggest
threats.
The two models helped the park service produce two maps. The first
illustrated
erosion threats and the second showed possible sites of prehistoric
life
on the island. In its findings, the park service concluded that
Tobler’s
First Law of Geography held true: “Everything is related to everything
else, but nearer things are more related to each other than distant
things.”
The preservation and care of artifacts
and other museum collections is a top priority in the National Park
Service.
To identify the need for new museums, the park service produced a
series
of GIS maps to document the size and location of its collections
originating
from the intermountain region. The park service knew it had 23 million
museum items in the region’s collections across eight states and on
loan
throughout the world. But it had never before created a graphic display
of the data. One GIS map showed the location of national parks with
museum
and archival collections in the intermountain region. A second map
illustrated
the location of collections from the region kept in repositories
scattered
across the continental US that do not belong to the park service. A
third
map showed the location of collections on loan to institutions or in
storage
overseas, including German, Japan, and Russia. The maps showed many
national
and international repositories had collections from 35 or more parks in
a single location. The data clearly shows active and widespread
research
on collections loaned from the intermountain region of the National
Park
Service. The GIS maps help the agency decide the best ways to manage,
lend,
store and improve the care of museum collections for the benefit,
education,
and enjoyment of people the world over.
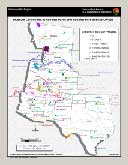 Intermountain Region Museum Collections for 2000 by Park |
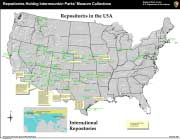 Respositories Holding Intermountain Parks' Museum Collections |
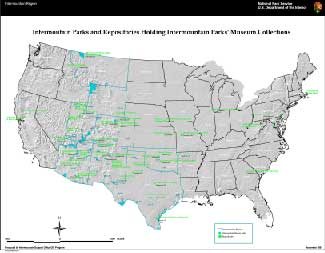 Intermountain Parks and Repositories holding Intermountain Parks' Museum Collections |