In natural resource management, decisions and actions are, or at least should be, based on the best available science. Here we will highlight local examples of science and management collaborations and explore practical reasons why it doesn't always work according to theory.
We will focus on research done by people in or near Bandelier that has contributed to significant natural resource management decisions.
Figure 1. A ponderosa pine tree installed with a dendroband at the middle-elevation site. Photo by Luke Gommermann.
Watching Trees Grow
Bandelier Ecologists Observe Trees Shrinking and Swelling for over Twenty Years
By Luke Gommermann, February 2014
Have you ever tried to watch a tree grow? While we all know that trees do grow, measuring how much they grow can be a challenge. Imagine being asked to find out how much bigger or smaller, or taller or shorter, a tree becomes over the course of days, weeks, months, or years. How long might it take you to notice if a tree had changed in size? Such a study may sound as exciting as the old adage of "watching paint dry." However, by measuring the change in size of ponderosa pine and Douglas fir trees over time, ecologists working in Bandelier National Monument have gained valuable insights regarding both the inner workings of these trees and the fire histories of ponderosa pine forests in the Jemez Mountains.
The Dendroband Thankfully, we don't have to go out, sit down in front of a tree, and watch it day after day to observe changes in tree growth. Instead, we have turned to a piece of equipment called a dendrometer band, or dendroband. An example of an installed dendroband is shown in Figure 1.
A dendroband consists of two parts. First, a thin strap of metal, about the size of the colorful ribbons that adorn birthday presents, is wrapped once around the outside bark of a tree about 4-5 feet above the ground. Dendrobands are carefully installed to make sure it is level and not twisted around, or caught on, the bark of the tree. The ends of the metallic strap are then connected to a bimetal spring housed inside of a ruler which is secured onto the tree with bolts drilled into the wood.
As the tree expands or shrinks in circumference, the spring expands or contracts with it. We can visit the tree at any time, take a quick look at the ruler, and measure its current size down to the tenth of a millimeter! These measurements can be compared to measurements taken in the past to track how much the tree has grown or shrunk.
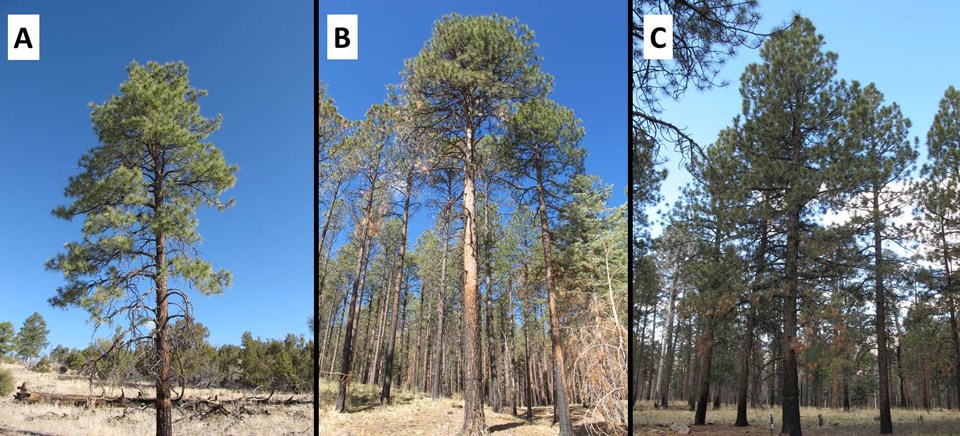
What We've Learned Beginning in 1991, thirty ponderosa pine trees were selected from three forest types within Bandelier National Monument: a low-elevation (~6,600 feet) ponderosa pine, piñon pine, and juniper woodland, a middle-elevation (~7,600 feet) ponderosa pine forest, and a high-elevation (~9,100 feet) mixed conifer forest primarily composed of ponderosa pine, Douglas fir, and aspen (Figure 2). Since that time, measurements have been made early in the morning on a weekly basis from March through October and every 2-4 weeks from November through February. Occasionally, the dendrobands are adjusted to ensure reliable measurements. If a tree has died, the dendroband is removed and another tree at the same site is fitted with the band.
Figure 2. Photos of a ponderosa pine trees installed with a dendroband at the low-elevation site (A), middle-elevation site (B), and high-elevation site (C). Photos by Luke Gommermann.
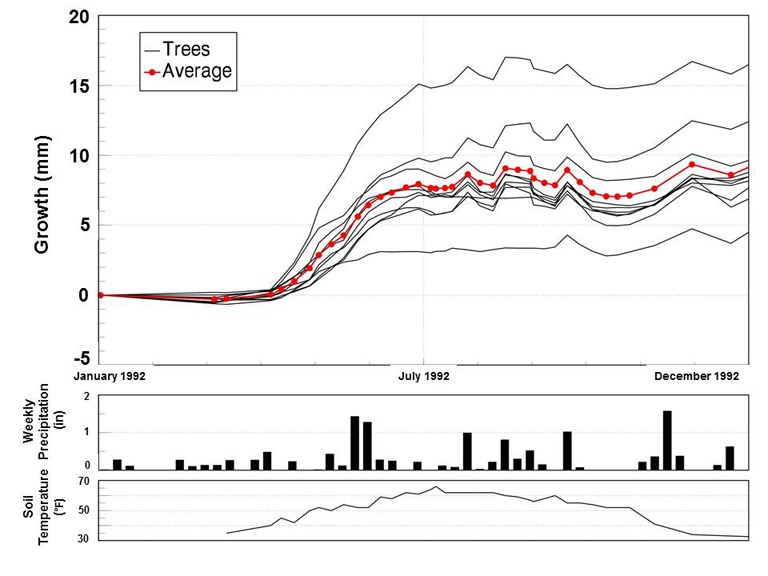
We have made several informative findings based on these measurements. First, ponderosa pine can both increase (swell) or decrease (shrink) in circumference over time, much like a sponge can change size as it is soaked in water, allowed to dry, and then soaked again. Figure 3 shows the change in size of trees at the low-elevation site during 1992. During the growing season, trees shrank during drier times but quickly swelled following precipitation.
Figure 3. Weekly measurements of ponderosa pine size, precipitation, and soil temperature at the lowest elevation site during 1992. Figure created by Kay Beeley.
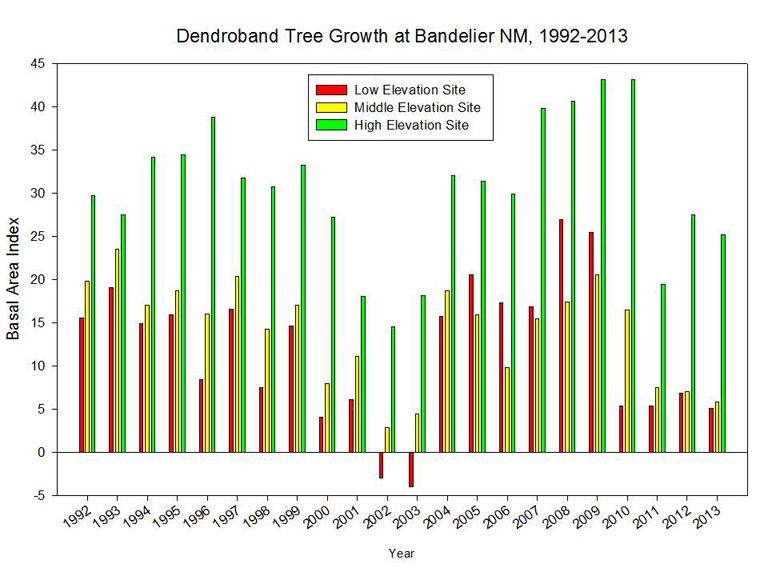
Figure 3 also documents tree growth is greatest in the early growing season, occurring before the arrival of the summer monsoons. It would follow that the amount of winter snowfall has a large influence on tree growth during the following growing season. Data from dendrobanded trees can also be used to look at patterns over longer time periods. Figure 4 displays the average basal area index (BAI) of ponderosa pine trees at each of the three sites since 1992. The BAI is a measure of tree size. Based on graphs such as these, it is relatively easy to pick out years when water was plentiful based on large increases in growth across all sites (e.g., 1992-1995) or drought years when water was scarce and trees shrank or hardly changed (e.g., 2002-2003), resulting in the death of some banded ponderosa pine and most mature , piñon pine.
Figure 4. Average basal area index of ponderosa pine trees across a 2,500 foot elevation gradient within Bandelier National Monument from 1992 to 2013. Figure created by Kay Beeley.
Figure 5. Student Conservation Association intern Luke Gommermann adjusts a dendroband around a ponderosa pine tree at the middle-elevation site. Photo by Craig Allen.
We have learned that ponderosa pine trees at the highest elevation site consistently grow more each year than trees at the middle and lowest elevation sites, which grow at similar, slower rates. It is interesting to note that the mixed conifer forest at the high-elevation site appears to provide better growing conditions for ponderosa than the ponderosa pine forest at the middle-elevation site. This hints that ponderosa pine forests are not necessarily the best places for ponderosa pine to grow. Pure stands of ponderosa pine represent locations where ponderosa's tolerate the local environmental conditions better than all other tree species, and are therefore dominant. Where growing conditions for ponderosa are better, competition from other species, such as Douglas fir and aspen, limit ponderosa pine distribution.
Additionally, all trees studied at each site, regardless of age or species, begin growing in the spring at about the same time (within a week or two during most years). However, trees begin growing earlier in the year at lower elevations as it warms up sooner.
Lastly, we have been able to determine that trees tend to grow fastest during the early months of the growing season (i.e., April-July). Using this information in combination with fire scars found within the annual growth rings of trees across the Jemez Mountains landscape, strong evidence is revealed regarding the seasonality of historical forest fires. We can see that the vast majority (~95%) of historical forest fires occurred during the early growing season of ponderosa pine. This is important information for land owners of today's ponderosa pine forests within the Jemez Mountain landscape.
Future Questions As this study continues into its 23rd growing season, future monitoring of the trees within Bandelier National Monument will provide essential information to better understand the influence of climate change in the Jemez Mountains landscape. In particular, we are interested in understanding the decline in tree growth leading up to tree's demise resulting from drought. A drought during the 1950s caused a dramatic die-off of ponderosa pine growing at the lower and dryer edge of their range within Bandelier National Monument. During the current, on-going drought, we have already witnessed ponderosa pine dieback at the lowest elevation site over the course of this study.
The fate of today's ponderosa pine trees remains unknown. However, as ecologists working at Bandelier National Monument continue the dendroband program, we will be better prepared to anticipate, and interpret, future landscape changes across the Jemez Mountain landscape.
Using historic photographs to track landscape changes in Bandelier National Monument Author: Amy Washuta
Date: 9/2013 As we study the thin skin of life on the surface of Earth, we find an extremely complex symphony that is not static, but changes through both time and space. The Jemez Mountains and Bandelier National Monument are no exception. Here, the landscape is rich with a history of powerful natural disturbances such as volcanism and fires, shifting climates, and 10,000 years of human inhabitation. A key to understanding what shapes this landscape is to investigate the secrets of its past.
Repeat photography, in which a historic photo is compared to a modern retake, is a tool that can help us understand ecological changes and what may have caused them, especially when used alongside other types of data, such as the study of tree ring patterns (dendrochronology), grains of dust and pollen (palynology) and artifacts and writings on the history of human use.
Although change is part of nature, here on the Pajarito Plateau at the edge of the Jemez Mountains, we have seen major changes to our environment due to human influence during the past 100-150 years. In the early 1990s, Craig Allen and John Hogan, ecologists and scholars of this landscape, had the idea that a direct visual comparison of our landscape now and long ago by repeat photography might prove insightful. They began a search that took them to numerous libraries, universities, and even the National Photographic Archives near Washington D.C. for the earliest photos they could find of Bandelier National Monument and the Jemez Mountains. Their search yielded over 300 historic photos that looked repeatable. Most of these early photos were focused on archeological finds, geology, railroad surveys, and advertising – certainly not on long-term landscape changes! However, this proved advantageous in that the original photographers were not biased. That is, they did not seek out locations they thought might change in the future; they were simply snapping photographs of stone walls or steep canyons laced with history.
In 1995, Allen and Hogan began to retake these historic photos, often pinpointing their locations with the help of local expertise. They meticulously lined up their camera to the historic photos and recorded a GPS point, azimuth, and other conditions for each photo. To date, they have retaken close to 100 photos. The earliest photos found so far are from the year 1880 when Adolph Bandelier, for whom the monument is named, came exploring in Frijoles Canyon.
Each pair of photos was analyzed for landscape changes, keeping in mind that natural events coupled with human disturbances can impart unexpected and swift consequences for ecosystems. Here are a few examples of photo pairs that held interesting clues to the past.
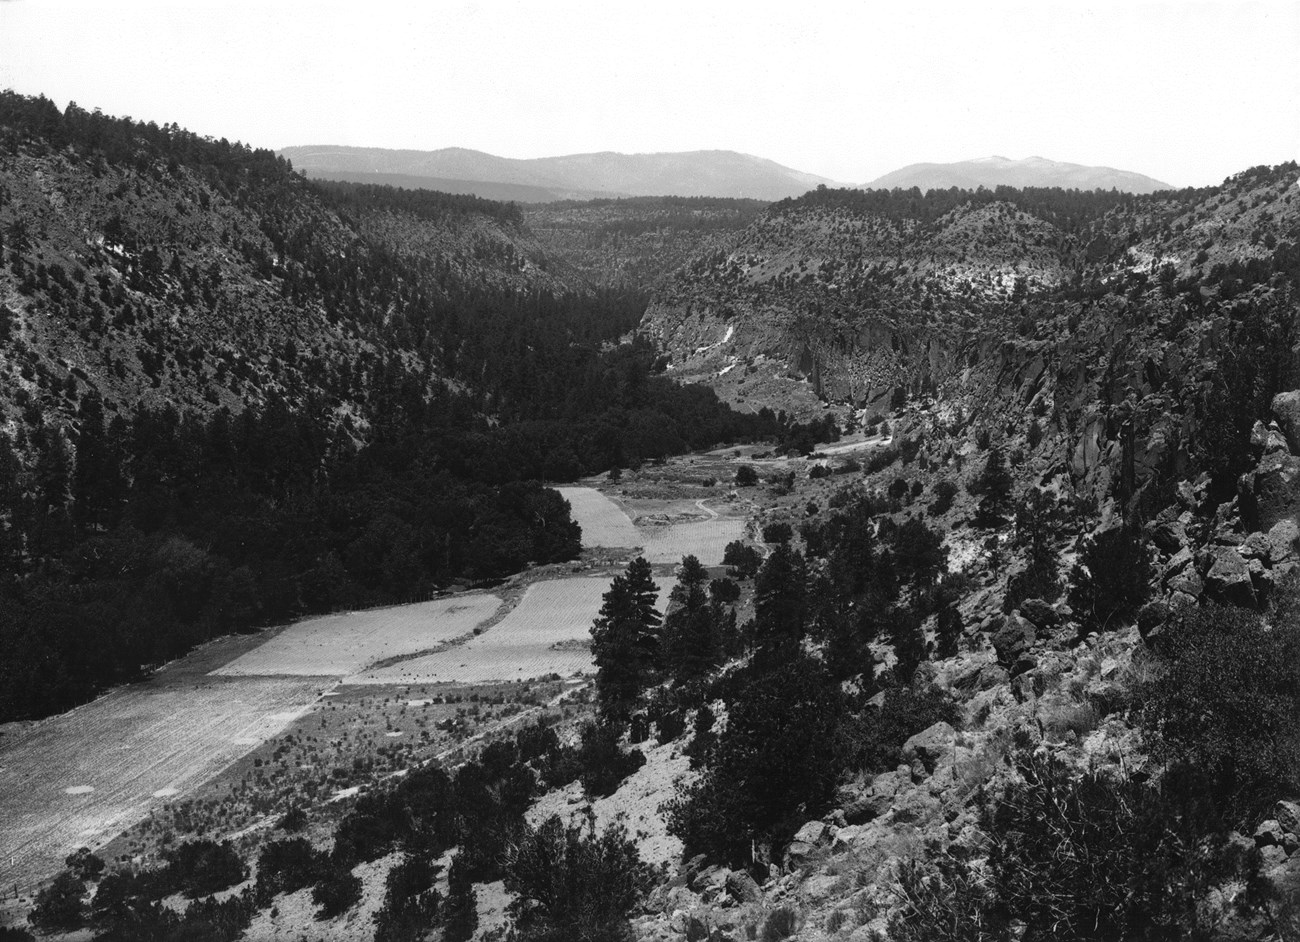
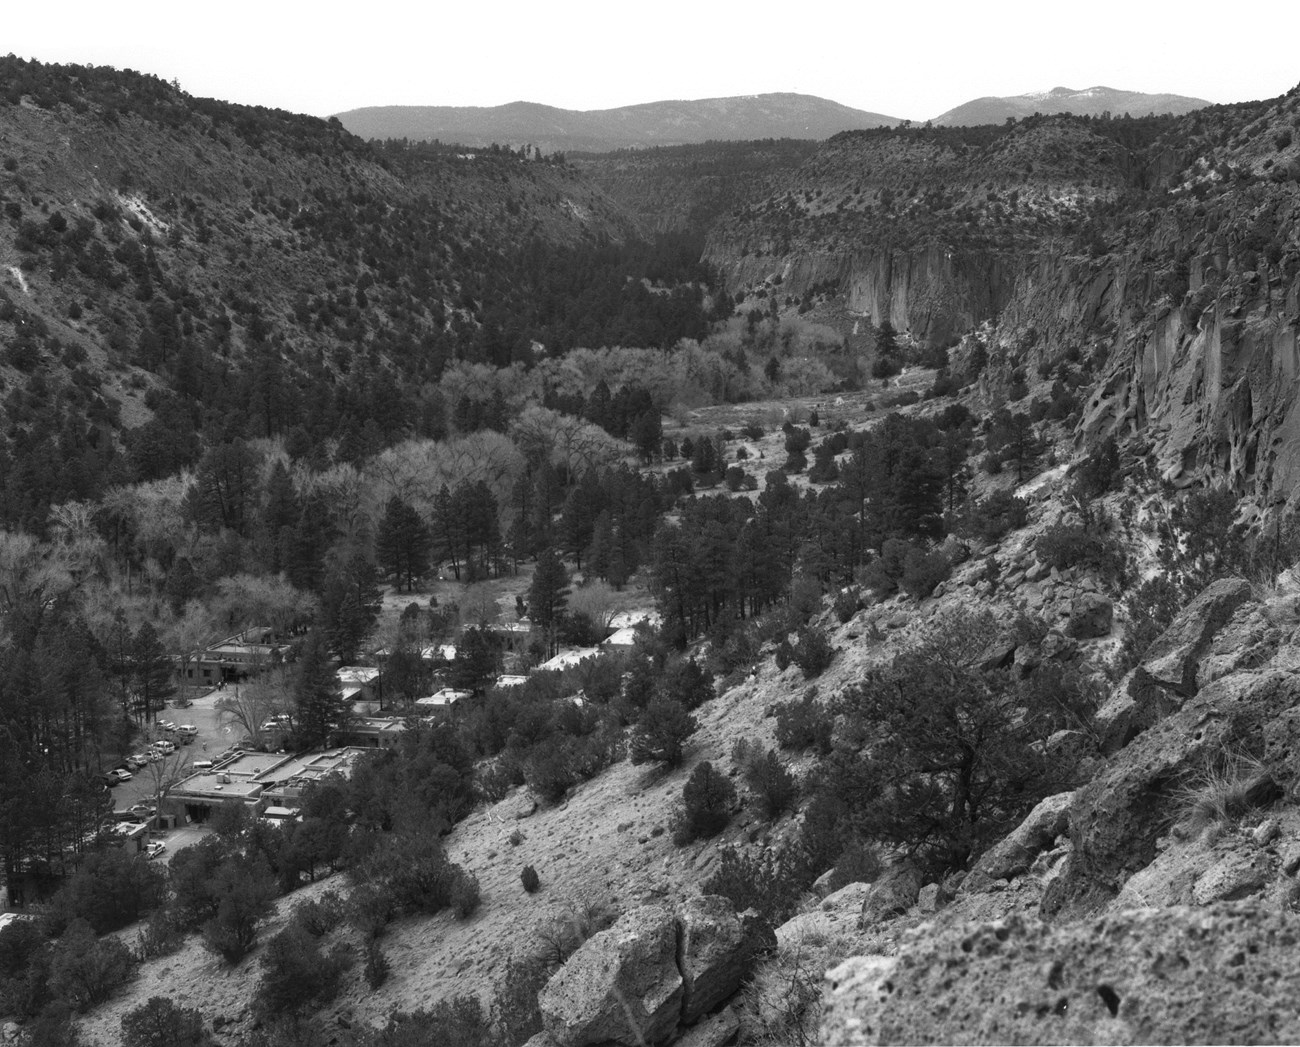
Frijoles Canyon This pair of photographs showcases the main visitor use area of Bandelier National Monument - Frijoles Canyon. Perhaps the most striking difference in Frijoles Canyon between 1920 and 1999 is the floodplain. Where riparian vegetation thrives today, agricultural fields covered the canyon bottom in the monument's early days. There were orchards, barns, fences, irrigation ditches, and crops used by those who inhabited the canyon at that time. A marked increase in the density and height of riparian trees in the last century suggests that many trees were harvested for wood as well. Today, the evidences of these historical uses are but subtle remnants in the form of old ditch scars and a few scraggly fruit trees.
Now it's time to grab your magnifying glass! A very careful examination of the two photos reveal hard to see, yet drastic changes on the mesas. The piñon-juniper woodland, a dominant vegetation type in the Pajarito Plateau, covers the mesa sides and tops in the modern photo. However, ponderosa pine forests, characteristic of higher elevations than piñon-juniper woodlands, dominate the mesa tops and occur on the sides in the 1920 photo (most visible on the leftmost mesa top). The rapid upslope migration of ponderosa forest and subsequent colonization by piñon-juniper woodland over the last century has been a widespread phenomenon in the Jemez Mountains. What caused this shift? Prior to the late 1800s, continuous ground cover carried low-intensity, frequent fires through the landscape. Beginning in the 1880s, large numbers of grazing livestock were introduced and ate the fire-carrying groundcover. Simultaneously, a century of active fire suppression had begun. Thus, the ponderosa and piñon-juniper habitats became fire-starved, growing denser and denser with woody growth and creating conditions for the easy spread of disease and hot fire through the trees. A severe drought during the 1950s stressed the ponderosa pines, paving the way for a bark beetle attack that killed them back and pushed the ecotone upslope by as much as 2 kilometers across the Jemez Mountains. And this retreat of ponderosa forests was not a one-time occurrence. Rather, this trend continues in the area due to long-term changes in climate toward warmer and potentially drier conditions.
by unknown photographer 1920
by Steve Tharnstrom 1999
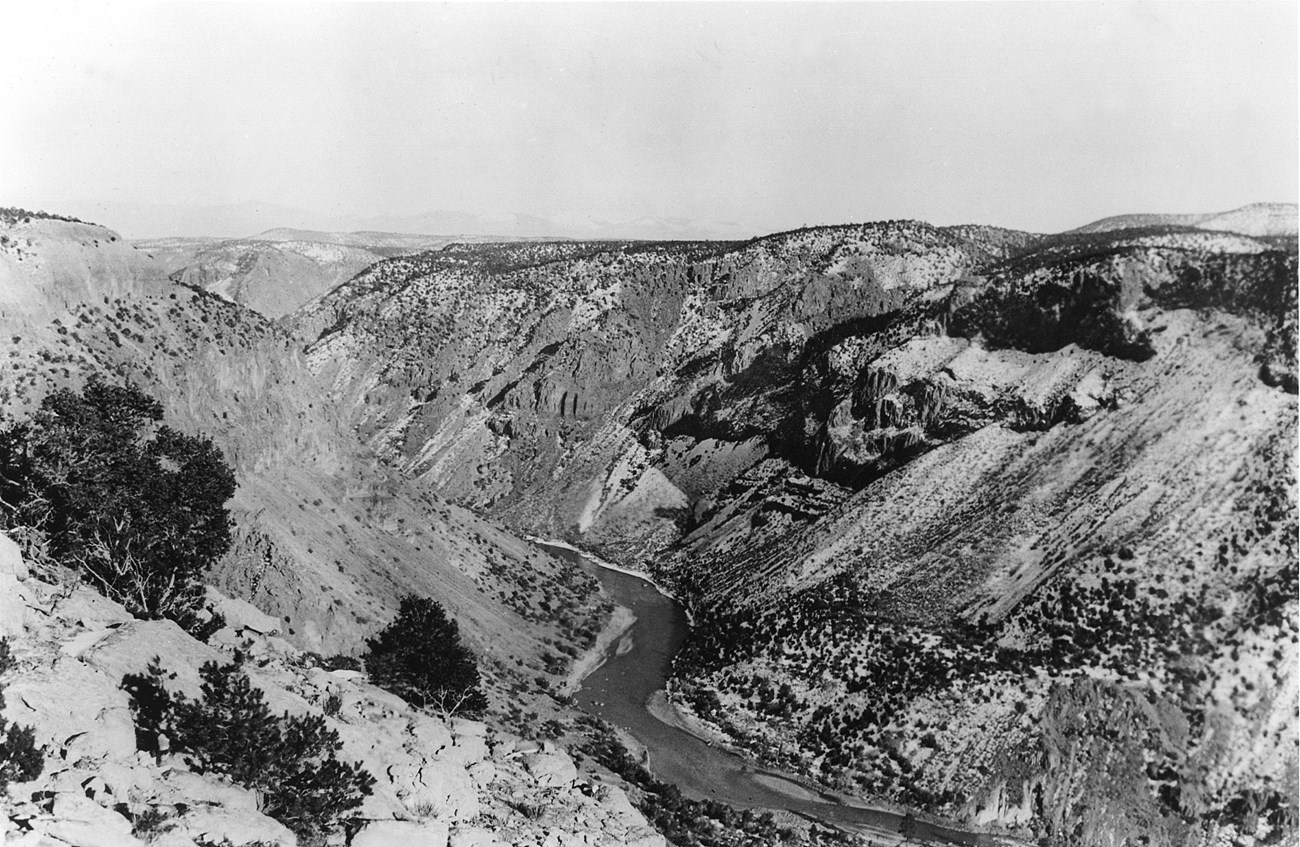
The Rio Grande Looking north up the Rio Grande River from the mesa top near the mouth of Frijoles Canyon, some features like the scree slopes appear to have remained quite stable since 1920, while other areas have seen big changes. Since 1920, dams, levees, and diversion channels have been built, changing the flow of the river. Specifically, in the 1980s, flooding of unusually large proportions occurred in the floodpool of the Cochiti Reservoir. This killed most of the riparian plants, including rare species, on the banks of the river and buried natural springs in sediment. This barren area was then colonized by weedy plants such as cocklebur and saltcedar. Today, native cottonwoods and willows are trying their best to regain control in the riparian area. Still visible in the modern photo is the "bathtub ring" above the river made by the absence of riparian vegetation and a build-up of sediment as a reminder of the floods. We have only begun to investigate the numerous collection of photo pairs, and already we have seen clearly illustrated evidence of large-scale ecological changes. Past management decisions have had noteworthy impacts on the forests and meadows of the Jemez Mountains. Today, better-informed management strategies will continue to be the key to ameliorating these impacts and ensuring the health and resilience of this landscape into the future. The gathering of important place-specific ecological data, including snapping plenty of 3x5s, will provide us with direct and powerful knowledge about how to better manage the Jemez Mountain landscape.
by unknown photographer 1920
by Steve Tharnstrom 1997
Want to learn more? Below is a link to the full report "The use of repeat photography for historical ecology research in the landscape of Bandelier National Monument and the Jemez Mountains, New Mexico" submitted by Craig Allen and John Hogan in 2000 to the Southwest Parks and Monuments Association.
AUGUST 2012 - The Science of Pitfalls By Theresa Murphy Bandelier Ecology SCA 2012 URI Graduate
Last month I was able to participate in one of our four yearly collections of ground dwelling arthropods at Bandelier. Sampled four times a year, these collections are designed for long-term monitoring of ground-dwelling arthropod diversity and population dynamics at Bandelier National Monument. Three sites were chosen to monitor different elevations and vegetation types within the park. Because arthropod populations can shift dramatically from year to year the long term nature of this study helps land managers tease out long term trends in these populations due to climate or land use changes that could signal broader changes to the ecosystem. Most studies of this nature are based on six year grants; this study is extremely rare in that it has been going on for over twenty years.
To collect samples from the pitfall traps my partner, Courtney, and I went out to each collection site armed with anti-freeze, ethanol, and a toolbox full of cups, cans, strainers, funnels, and chopsticks. Each 'pitfall' is a cup filled partially with bright green anti-freeze and stored securely in a soup can that is level to the ground. Anti-freeze is used in order to prevent evaporation and preserve the samples. We use a less-toxic version with a bittering agent to prevent animals from drinking it.
The traps are camouflaged using a rock or piece of wood to prevent insects from being tipped off by light reflecting off the anti-freeze. This can make the traps hard to find but a GPS and bright-colored flagging generally help us find the traps. Plus when carefully inspecting an area, 'floating' rocks, which are a sure sign of a pitfall trap, tend to stand out.
NPS IMAGE
At each trap we strain out all the bugs in the cup. After collecting all our samples, a funnel and chopsticks help us fit our samples into glass vials to be sent to the University of New Mexico for identification. It is easier to place the larger insects in head first, not only because they fit better, but because many insects will stare at you with large eyes if you try to place them in the other way.
The beauty of the data collected comes from the large variety of species that have been tracked over the years. Data collected has revealed how individual species respond to environmental changes- including weather and fire. All new species collected are added to Bandelier's growing arthropod collection, housed at UNM's Natural History Museum (link: http://www.msb.unm.edu/arthropods/index.html), giving the project value in helping to build a catalog of what species can be found within the park. In fact, some previously undescribed species such as a new minute brown scavenger beetle in the family Lathridiidae and a new darkling beetle in the genus Steriphanus have been discovered from the pitfall traps at Bandelier. In addition our pitfall traps are designed using the same protocol as several pitfall sites located across the state of New Mexico allowing for invaluable comparison of diversity and species response over a broad-scale.
NPS IMAGE
At Bandelier changes due to the El Niño Southern Oscillation (Link to NOAA ENSO page: http://www.elnino.noaa.gov/) weather pattern have been a particular focus of this project. El Niño has a strong impact on southwestern U.S. weather and its impact on arthropod diversity is continuing to be an interesting aspect of this long term study. This study has been able to gather data on diversity during normal years and assess changes in diversity due to La Niña (dry) years and El Niño (wet) years. In addition the elevation differences among the sites make it possible to study what effects higher elevation may have on diversity, due to its cooler temperatures, higher levels of precipitation, and differing vegetation types. In connecting these two factors it has been possible to see at which elevations populations are most susceptible to changes from droughts and shifting climate patterns.
Hiking down the switchbacks with our last set of arthropod samples in hand, I thought of how diverse the insect world is. Over the course of 102 traps we had seen an amazing variety of insects from tiny black ants to brown beetles that were too big for the funnel and almost too big for a vial. We collected an assortment of crickets, spiders, beetles and even velvet ants, which despite their name, are actually flightless wasps. It's fascinating to see what turns up in each trap, especially because many of the insects in our traps are so elusive in lifestyle and habitat as to rarely be seen by hikers. It was a great experience to be part of such a unique long term study on arthropod diversity.
Last updated: February 27, 2023
Park footer
Contact Info
Mailing Address:
Bandelier National Monument
15 Entrance Road
Los Alamos,
NM
87544