|
NATIONAL PARK SERVICE
Mountain Goats in Olympic National Park: Biology and Management of an Introduced Species |

|
| Mountain Goat Population |
CHAPTER 5:
Demography
D. B. Houston, V. Stevens, and B. B. Moorhead
The demographics of mountain goat populations are poorly understood. Moreover, with a population already at equilibrium, little can be learned about either the density-dependent processes that produce a 0 rate of increase or the intensity of resource limitation. The most revealing studies involve natural experiments with growing populations (Caughley 1970a; Sinclair 1977; Bayliss 1985) or populations deliberately reduced from equilibrium. Accordingly, we examined changes in dynamics and physical condition of mountain goats resulting from the reduction in density of the Klahhane Ridge (KR) subpopulation (summarized from Houston and Stevens 1988). Additionally, the dynamics and condition of goats in the KR subpopulation are briefly compared to other subpopulations.
Subpopulations
Klahhane Ridge
Study of mountain goat dynamics from 1977 to 1981 showed differences in reproduction and condition between the subpopulation occurring at the highest density—KR—and eight others (Stevens 1983). The KR goats were considered to be strongly resource limited and were chosen for an experimental management program in 1981. Goats were removed annually during 1981-84 as an experiment to measure the response of the subpopulation to artificial reduction. This approach represented an unbalanced manipulative experiment (sensu Hurlbert 1984) because there was no appropriate subpopulation to serve as an unmanipulated control (possible candidates lacked comparable background information or occurred in dissimilar environments at densities that did not approach that of KR). If our hypothesis of resource limitation was correct, we expected increased reproduction, recruitment, and improved condition as density was lowered.
Census techniques were described in Chapter 4. Additionally, sex and age compositions were sampled in extensive ground surveys. Sexes and ages (kids, yearlings, and adults) of goats were determined by horn shape and size, body size, urination postures, and pelage, as described by Stevens (1983) and Hutchins (1984). Goats were captured from 25 June to 16 July 1981-84. Most were trapped under a 12- x 12-m drop net (Johnson and Moorhead 1982). Goats were weighed, and horn and body measurements were recorded. Age was estimated by horn rings and incisor replacement (Brandborg 1955; Stevens and Houston 1989). Lactation status of each female was noted. Small numbers of goats were collected during periods in late winter—before and after the intensive trapping program—and subjected to necropsy (Houston and Stevens 1988).
Sex and Age Compositions
Twenty estimates of the sex and age compositions were obtained for birth-pulse and fall populations during 1976-86 (Table 12). Like all such surveys, these data contain sampling errors, which are especially crucial at low population levels. Adult males frequently occur singly or in small groups and may be underrepresented, especially during June (Stevens 1983). The percentage of adult males doubled, however, in the low-density populations of fall 1982-86 (36 ± 9.6% SD) compared with those of 1976-81 (18 ± 4.9%). These changes may have occurred in part because capture effort was sometimes directed at female—young groups (about 60% of all goats removed were female).
Table 12. Sex and age compositions of Klahhane Ridge mountain goat
(Oreamnos americanus) population, 1976-1986.
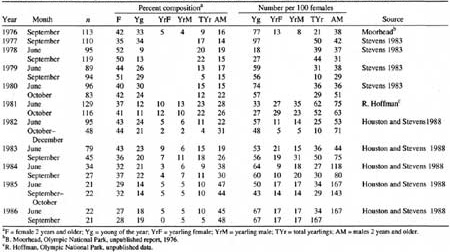
(click on image for a PDF version)
Production and Recruitment of Kids
The low to moderate precision of the population estimates (Houston and Stevens 1988) make it difficult to interpret the patterns in June production and subsequent fall recruitment of kids. Although we lack estimates for June kid:female ratios in 1976 and 1977, the September values were high (0.77 and 0.97, respectively; Table 12), and a partial count for 1976 suggests that goat numbers were relatively high (Table 5). If these September values are used also to represent June kids, then production by the high populations of 1976-81 was significantly more variable (CV = 47%) than for the lower populations of 1982-86 (CV = 12%; variance ratio test, P < 0.05; Zar 1984). Similarly, fall recruitment was more variable at the respective high populations (46%) than at low populations (16%). Differences in variation indicate that a greater proportion of females did not reproduce annually or rear kids successfully in the high density populations; they may have been more sensitive to either particularly favorable or poor environmental conditions than females in the low density population.
Production and recruitment of kids during
1978-86 seemed to be negatively associated with population size the
previous year ( 2t-1 = fall or postremoval estimates). Exploratory
linear regression analyses defined some of the variation observed.
September kid ratios were significantly and negatively associated with
2t-1 (r2 = 0.49; P < 0.05). Similarly,
the June ratios were significant at P < 0.10 but explained
relatively little of the variation observed (r2 =
0.25). Multiple regression models using estimates of the number of kids
from June and September seemed to be negatively associated with
population size and several indices of winter severity, but the
relations were not significant (r2 = 0.35-0.49;
P < 0.10; Houston and Stevens 1988). Data sets were too
limited to do little more than hint at the observed influences. They
suggested, however, that relations between the production of kids and
population size or environmental conditions were complex and perhaps
nonlinear (Fig. 26).
2t-1 = fall or postremoval estimates). Exploratory
linear regression analyses defined some of the variation observed.
September kid ratios were significantly and negatively associated with
2t-1 (r2 = 0.49; P < 0.05). Similarly,
the June ratios were significant at P < 0.10 but explained
relatively little of the variation observed (r2 =
0.25). Multiple regression models using estimates of the number of kids
from June and September seemed to be negatively associated with
population size and several indices of winter severity, but the
relations were not significant (r2 = 0.35-0.49;
P < 0.10; Houston and Stevens 1988). Data sets were too
limited to do little more than hint at the observed influences. They
suggested, however, that relations between the production of kids and
population size or environmental conditions were complex and perhaps
nonlinear (Fig. 26).
|
|
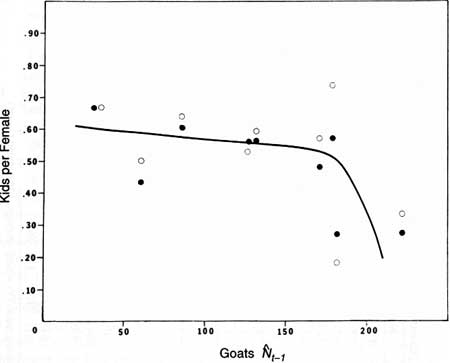
Fig. 26. The relation of June production (O) and fall
recruitment (•) of mountain goat kids to population size on Klahhane
Ridge, Olympic National Park. t-1 represents fall populations from
1977 to 1980 and postremoval or summer estimates from 1981 to 1986.
Line-fitted by eye.
|
Large mammals may show the nonlinear density dependence suggested in Fig. 26—that is, production or recruitment declines steeply as populations approach Kl (Fowler 1981a, 1987). However, we are only marginally comfortable with this interpretation for two reasons. First, sampling errors at low population size are of special concern (i.e., several females with kids overlooked in a survey profoundly alters the estimate). Second, as mentioned above, the 1976 and 1977 kid:female values were high and the goat population could also have been relatively high.
The best interpretation, considering the limited data, is that production and recruitment of goat kids are both more variable at high densities and may show some nonlinear density dependence. Variability in the production and recruitment of young is commonly greatest at Kl for large mammals (Fowler 1987).
Initial Breeding Age
Field observations of tagged female goats with kids at heel (1981-84) provided a conservative index to age of initial breeding (Table 13). No yearlings or 2-year-old females were lactating or had kids at heel, indicating no successful breeding by kids or yearlings. By contrast, observations of individuals tagged as kids in colonizing subpopulations in the Olympic Mountains have shown that females are capable of breeding as yearlings (i.e., giving birth on their second birthday; Stevens 1980, 1983). Captive reared female and male goats will breed as yearlings (Houston et al. 1989).
Table 13. Index to the age of sexual maturity of female mountain goats (Oreamnos americanus) on Klahhane Ridge as determined by kids at heel (1978-1980) and lactation records (1981-1984).
| Reproductive ratea | ||||
| Year | 1 year old | 2 years old | 3 years old | 4 years old |
| 1978 | 0(8) | 0(8) | 0.33(3) | 0.29(14) |
| 1979 | 0(1) | 0(10) | 0.30(10) | 0.80(5) |
| 1980 | 0(7) | 0(2) | 0.30(10) | 0.70(10) |
| 1981 | 0(4) | 0(10) | 0.33(3) | 0.13(8) |
| 1982 | 0(7) | 0(4) | 0.00(2) | 0.75(4) |
| 1983 | 0(6) | 0(2) | 1.00(2) | 0.66(3) |
| 1984 | 0(1) | 1.00(1) | 1.00(2) | |
aProportion of females lactating or with kids at heel, indicating sexual maturity at t-1; e.g., one of eight 4-year-old females was lactating in 1981, indicating sexual maturity (breeding) at 3 years of age. Sample sizes are given in parentheses. | ||||
Females generally became sexually mature as 2- or 3-year-olds in the established KR population. Although samples were small, reproduction of the 3- and 4-year-olds combined was greater at low densities (the proportion lactating or with kids at heel = 0.71, 1982-84) than at high densities (the proportion lactating or with kids at heel = 0.38, 1978-81; Χ2 test, P < 0.05). This suggested that initial breeding age declined (i.e., more 2- and 3-year-old females produced kids) when population density was reduced.
Litter Size
The observed proportion of births resulting in twins
was low and variable from 1976 to 1986 (Table 14). Considerable care was
taken to determine if females actually had twins at heel; this was aided
by the high proportion of tagged females in the population. Rates were
lower in the high-density populations ( = twinning rate = 0.021
± 0.028, 1976-81; Χ2 test, P < 0.05) than at
low density (x twinning rate = 0 124 + 0.164,
1982-86). The greatest number of twins (four sets) appeared in
1983. Twinning rates, although erratic, seemingly increased as density
was reduced.
= twinning rate = 0.021
± 0.028, 1976-81; Χ2 test, P < 0.05) than at
low density (x twinning rate = 0 124 + 0.164,
1982-86). The greatest number of twins (four sets) appeared in
1983. Twinning rates, although erratic, seemingly increased as density
was reduced.
Table 14. Twinning rate for mountain goats (Oreamnos americanus), Klahhane Ridge, 1976-1986.
| Year | Females with young | Sets of twinsa | Twinning rateb |
| 1976 | 36 | 1 | 0.028 |
| 1977 | 36 | 1 | 0.028 |
| 1978 | 9 | 0 | 0.0 |
| 1979 | 23 | 0 | 0.0 |
| 1980 | 29 | 0 | 0.0 |
| 1981 | 14 | 1 | 0.071 |
| 1982 | 21 | 2 | 0.095 |
| 1983 | 16 | 2c | 0.125 |
| 1984 | 5 | 2 | 0.400 |
| 1985 | 3 | 0 | 0.0 |
| 1986 | 4 | 0 | 0.0 |
aJune samples (except 1976 and 1977, for which only September minimum estimates are available). bProportion of observed births resulting in twins. cMinimum estimate; four sets of twins known but only two were observed during the June survey. | |||
Individual Reproductive Histories
Reproductive performances of 24 tagged females, aged 3 years and older, were observed for 5 or more years (Table 15). Females were observed until removed from the KR subpopulation or until tags were lost. Only two tagged females remained by 1986. Overall production averaged 0.73 ± 0.262 kid per year, but there were striking differences among individuals (CV = 138%). Annual breeding plus occasional production of twins raised the mean annual production of two females to 1.20. By contrast, two other females produced only one kid each in 5 years (0.20). Bailey (1991) demonstrated similar wide differences in individual reproductive success for mountain goats in Colorado.
Table 15. Production of young by 24 female mountain goats (Oreamnos americanus) aged 3 years and older, Klahhane Ridge, 1977-1986.a
| Goat number | Initial age (years) |
Year of observation/kids at heel |
b | |||||||||
| 1 | 2 | 3 | 4 | 5 | 6 | 7 | 8 | 9 | 10 | |||
| 4Y | 3 | 1 | 1 | F | 0 | 1 | 0.80 | |||||
| 7Y | 3 | M | 0 | 0 | F | 1 | ? | 2 | 0.83 | |||
| 10Y | 3 | 1 | 0 | 1 | M | 1 | ? | 1 | 0.83 | |||
| 11Y | 4 | 1 | 0 | F | 0 | 0 | ? | 0 | 0.33 | |||
| 15Y | 7 | 1 | 2 | F | M | 1 | 1.20 | |||||
| 19Y | 6 | 2 | 0 | F | F | 0 | 0.80 | |||||
| 21Y | 6 | M | 0 | M | 0 | 0 | 0.40 | |||||
| 24Y | 8 | F | 0 | F | F | 1 | 0.80 | |||||
| 25Y | 3 | 1 | 0 | M | 0 | 1 | 1 | 1 | 0.71 | |||
| 27Y | 4 | M | 0 | 0 | F | 0 | 1 | 1 | 1 | 1 | F | 0.70 |
| 31Y | 3 | 1 | 0 | F | F | 0 | 1 | 1 | 0.71 | |||
| 35Y | 4 | 1 | 0 | F | F | 0 | 0.60 | |||||
| 36Y | 3 | F | 0 | 1 | M | 1 | 1 | 0.83 | ||||
| 37Y | 5 | F | 0 | F | F | 1 | 1 | 2 | 0 | 0.88 | ||
| 38Y | 5 | 1 | 0 | M | 1 | 1 | ? | 0 | 0.67 | |||
| 39Y | 3 | M | 1 | F | M | 1 | ? | 1 | 1.00 | |||
| 42Y | 3 | F | 1 | 0 | 1 | 1 | 0.80 | |||||
| 49Y | 3 | 0 | F | F | M | 1 | 2 | 2 | 0 | 1.00 | ||
| 88Y | 3 | 0 | 0 | 0 | 0 | M | 0.20 | |||||
| 106Y | 8 | M | 0 | 0 | 0 | 0 | 0.20 | |||||
| 112Y | 3 | 1 | M | 0 | M | ? | ? | ? | ? | 1 | 0.80 | |
| 119Y | 3 | 0 | F | 0 | 1 | 1 | 0 | 0.50 | ||||
| 141Y | 3 | F | 0 | 2 | 0 | 1 | 0.80 | |||||
| 147Y | 4 | M | F | 1 | 1 | 2 | 1.20 | |||||
aM = male; F = female; sex of other kids undetermined. Boldfaced data indicate goat that died before reaching 1 year. All females first observed in 1977 except 49Y and 112Y (1978), 42Y, 119Y, 141Y, and 147Y (1979), and 88Y (1982). bAverage number of kids produced per year of observation. | ||||||||||||
The sex ratio of the 42 kids surviving until midsummer was skewed—62M:100F (Table 15)—but the ratio did not differ from parity (P > 0.05). This small sample, however, hints that the predominance of adult females, which characterized the subpopulation at high densities (Table 12), could begin at an early age, with either differential production or, more likely, higher mortality of male kids.
Density-dependent Reproduction and Mortality
Additional density-dependent relations in the population were examined using k-factor analysis (Varley and Gradwell 1968), modified for vertebrates with overlapping generations (Southern 1970; Sinclair 1977). An earlier analysis of the 1977-80 populations showed that adult mortality plus dispersal were density-dependent (Stevens 1983). However, extended analysis suggested that only summer and winter kid mortality might have been density-dependent, but regressions of these k-factors on population size were not significant, and density dependence was not confirmed by this analysis.
Dispersal
Overall dispersal exceeded 10% for 130 tagged goats monitored in the high density KR subpopulations of 1977-81 (dispersal = one-way movement ≥15 km; Stevens 1983). Male dispersal (19.6%) during the 4 years exceeded female rates (5.5%), and dispersal of 1- to 3-year-olds (17.6%) exceeded rates of older goats (4.6%). Dispersal was not monitored during the 1981-84 population reductions. Clearly, dispersal was important in the dynamics of the KR goats at high densities.
Goat Condition
Live weights, measures of horn length, and fat deposits were evaluated as indices of goat condition. These samples seemed especially useful because they were acquired in a relatively brief period each year, 25 June to 16 July. Captured kids were about 3-6 weeks old and yearlings about 13 months. Lengths of right horns were measured on yearlings; lengths to first annuli (representing about 18 months of horn growth) were measured on 2-year-olds. Horn tip wear reduces lengths to first annuli in older animals (Stevens 1983); consequently, our analysis of horn growth is restricted to the two younger age classes.
1. Live weights were significantly and negatively
associated with goat population size the previous year (i.e., fall or
postremoval numbers, t-1; Table 16). The relation was strongest for
yearlings and 2-year-olds. Weights of the few adult males sampled showed
no significant relations to density. Transformations of the variables
did not significantly improve regression models.
Table 16. Relation between age-specific body weight and population size for mountain goats (Oreamnos americanus),a Klahhane Ridge, 1981-1984.
| Goat | n | Slope | Intercept (kg) | r2b |
| Kids | 28 | -0.0325 | 18.3 | 0.15* |
| Male | 11 | — | — | NS |
| Female | 17 | — | — | NS |
| 1 year old | 36 | -0.0993 | 50.0 | 0.50*** |
| Male | 20 | -0.1204 | 54.1 | 0.56*** |
| Female | 16 | -0.0760 | 46.1 | 0.37** |
| 2 years old | 25 | -0.1102 | 63.6 | 0.39*** |
| Male | 10 | -0.1121 | 66.4 | 0.46* |
| Female | 15 | -0.0806 | 56.1 | 0.23* |
| 3 years old | 19 | -0.1156 | 75.4 | 0.28* |
| Male | 11 | — | — | NS |
| Female | 8 | — | — | NS |
| 4+ Female | 57 | -0.0667 | 72.6 | 0.24** |
| 5+ Male | 10 | — | — | NS |
aGoats captured between 25 June and 16 July; population size = t-1
(see text). Female goats reach adult body weight by 4 years of
age, males by 5 years of age (Houston et al. 1989).bRegression significance: * = P < 0.05; ** = P < 0.01; *** — P < 0.001: NS = nonsignificant. | ||||
Annual samples were too small to examine effects of changes in density on the age-specific weights of lactating versus nonlactating females. However, four lactating 3-year-olds were heavier (61 ± 2.0 kg) than four nonlactating counterparts (43.3 ± 3.6 kg, P < 0.01) over the 1981-84 period. No differences were detected between lactating versus nonlactating females after adult weights were attained (4 years of age, n = 17, P > 0.10; ≥5 years of age, n = 40, P > 0.10).
2. Total horn length was significantly and negatively associated with population size for yearling males and for yearlings overall, but the variation explained by the model was low (Table 17). Yearling females and 2-year-olds showed no relations between horn length and population size. These results were not surprising because weight and horn length were only modestly correlated for yearling males (r = 0.70, P < 0.001, n = 20), yearling females (r = 0.79, P < 0.001, n = 16), and 2-year-old males (r = 0.67, P < 0.05, n = 10) but not for 2-year-old females (r = 0.04, P > 0.10, n = 15). Body weight is probably the more sensitive of the two indices and is less influenced by measurement error and extraneous variation including horn-tip wear.
Table 17. Summary of the relations between horn length and population size for yearling and 2-year-old goats (Oreamnos americanus),a Klahhane Ridge, 1981-1984.
| Goat | n | Slope | Intercept (cm) | r2b |
| 1 year old | 38 | -0.0390 | 13.4 | 0.15* |
| Male | 20 | -0.0874 | 14.9 | 0.25* |
| Female | 18 | — | — | NS |
| 2 years old | 25 | — | — | NS |
| Male | 10 | — | — | NS |
| Female | 15 | — | — | NS |
aGoats captured between 25 June and 16 July; population size = t-1. Total
horn length measured in yearlings; length to first "annulus" in 2-year
olds.b* = P < 0.05; NS = nonsignificant. | ||||
3. Deposited fat reserves are measured commonly as indices to physiological condition in mammals. The sequence of fat mobilization for many ungulates is subcutaneous, perinephric, and finally, bone marrow (Hanks 1981). Fat deposits were measured on 13 mountain goats aged 2 years and older (Table 18). Although the sample is small, the cycle of accumulation and mobilization was generally as expected: the greatest deposits of perinephric and marrow fat were found during fall, and the lowest levels occurred in late winter or spring. Subcutaneous fat was absent, except in one goat. The kidney fat index was lower in the March-May 1981 sample (drawn from the high-density population) than for goats collected in 1985 (Wilcoxon's two-sample test, P = 0.05). Differences among marrow deposits were not significant. Differences in marrow fat would not be expected, even following large changes in density, because these deposits are the last reserves mobilized. Animals with depleted marrow are in poor condition, perhaps moribund (Mech and Delgiudice 1985). Changes in fat reserves from 1981 to 1985 generally support findings from the changes observed in body weights; goats were in better physiological condition at low population levels.
Table 18. Deposited fat reservesa in mountain goats (Oreamnos americanus) 2 years and older, Klahhane Ridge.
| Age |
KFI |
BMF |
|||
| Collection period | nb | Mean ± SD (range) | Mean ± SD (range) | Mean ± SD (range) | Sub Q |
| March-May 1981 | 7(6) | 4.0 ± 1.6 (2-7) | 132.4 ± 14.9 (116-154) | 68 ± 19.4 (29-83) | 0.0 |
| September 1981 | 1(1) | 7.5 | 232 | 91 | 1.0 |
| October 1983 | 1 | Adc | 373 | 93 | 0.0 |
| March-May 1985 | 4(2) | 6.3 ± 3.5 (2-10) | 159.7 ± 4.5 (155-164) | 78.3 ± 16.9 (59-90) | 0.0 |
aKFI = kidney fat index; BMF = percent bone marrow fat; Sub Q = depth (mm) of subcutaneous fat on rump. bNumber of females given in parentheses. cKilled illegally, age undetermined. | |||||
Other Subpopulations
Compared to KR, we know less about goat demography and condition in other subpopulations; interpretations are limited because density of these subpopulations was not manipulated deliberately. However, we compare the dynamics of KR goats to that of other subpopulations across the same years.
Stevens (1983) sampled the demography of nine subpopulations from 1977 to 1981. In addition to KR, these subpopulations included six that became established comparatively recently, were hunted outside the park, or both—Mount Constance, Mount Anderson, Sawtooth Ridge, Mount Elinor, Glacier Meadows, Bailey Range—plus the Mount Appleton and Royal Basin subpopulations within the park.
Production of kids was consistently greater for the combined subpopulations than for KR for 1977-81: 36 tagged females aged 3 years or older produced 0.93 ± 0.33 kid/female, whereas at KR, 58 females averaged 0.67 ± 0.30 kid. (Note: samples for individual subpopulations were small, and Stevens (1983) combined them to compare to KR). Moreover, greater proportions of 3- and 4-year-old females had kids at heel in the combined subpopulations than at KR, suggesting that females were breeding at younger ages (Stevens 1983). The standing age distribution of captured goats showed that 57% of the KR females were age 5 or older versus 26% for the combined subpopulations, suggesting differences in recruitment, dispersal, or adult mortality. Dispersal rates for the combined areas were only 1.6% over 4 years—much lower than the 10% on KR. Moreover, age-specific comparisons indicated that females on KR tended to be smaller in stature and lighter in body weight than elsewhere (Stevens 1983). Reproductive rates remained high—0.77 and 0.67 kid/female in 1985 and 1986—for the combined Royal Basin, Sawtooth Ridge, and Constance subpopulations (Hoffman 1987).
These comparisons showed appreciable variation in demography and condition among subpopulations, suggesting that the intensity of resource limitation differed among the areas. Differences likely reflect (1) time since colonization, as some subpopulations may not have reached Kl (Bailey Range, Glacier Meadows, Sawtooths, Mount Elinor); (2) levels of hunting that mitigated resource limitation and maintained populations below Kl; (3) inherent differences in environment across the Olympic Mountains that resulted from precipitation gradients and vegetation differences; and (4) combinations of points 1-3. For example, goats in the environmentally harsh Bailey Range may have experienced frequent density-independent mortality and did not achieve equilibria, in any measurable sense, with their resources.
Metapopulation
Only two samples of reproductive rates obtained during rangewide censuses provided data on the metapopulation. Estimated ratios of kids to older animals were 0.217 ± 0.036 during July 1983 and 0.265 ± 0.041 during 1990 (from the air, yearlings and adult male and female goats could not be distinguished reliably), but reproductive rates did not differ between years (t-test for ratio estimators, P > 0.05; Cochran 1977).
Interpretation
The deliberate manipulation of the KR goats provided our still-limited insight into goat demography. The KR subpopulation showed density-dependent responses in initial breeding age and in litter size. Production and recruitment of kids were more variable at high densities. Changes in demography were associated with increases in live weights and fat reserves. Together, changes are consistent with those expected from a resource-limited population when the limitation is relaxed, resulting in this instance from reduced goat density. Considerations of mountain goat ecology suggest that the quantity and quality of winter food may be the limiting resource that determines ecological carrying capacity. Studies elsewhere have shown kid production to be negatively associated with winter severity during gestation (Adams and Bailey 1982; Swenson 1985; Bailey 1991).
Irrespective of age, female goats seemingly must reach a threshold fall body weight of about 70kg before achieving sexual maturity (Houston et al. 1989). The changes recorded in weights and population dynamics at KR suggested that more young goats reached this threshold at the reduced population densities and also that adult females achieved the requisite condition more consistently.
Potentially, low kid production could result from females failing to breed, from fetal mortality, or from mortality of neonates. A small sample of females provided information on these possible sources of reproductive failure. Only one of six females 4+ years of age, collected during winter from 1981 to 1985 on KR, was pregnant. The reproductive tracts from the nonpregnant females did not show regressing corpora lutea, uterine scars, or distended uteri that would suggest recent fetal mortality. Thus, low production of kids in some goat populations may result from failure to breed or conceive because females did not achieve condition, rather than from mortality in utero or postpartum.
The differences in reproductive performance among individual females could result from inherited traits, social status, lifelong effects from birth-year environmental conditions, or some combination (Bailey 1991). Consistent dominance relations were observed among adult females on KR, but data were insufficient to establish an association with reproductive success in the particular females monitored (M. Hutchins, American Zoo and Aquarium Association, Bethesda, Maryland, personal communication, 1987). Among social mammals in general, dominant females often show superior breeding success (Clutton Brock and Albon 1985).
Slopes of the density-dependent responses in kid production and recruitment remain obscure. Populations of large mammals may show the strongest density dependence near Kl (i.e., density dependence is nonlinear; Fowler 1981a, 1981b, 1987). If studies elsewhere confirm the suggestion that these relations are nonlinear in the mountain goat, then the seemingly enigmatic responses of some populations to harvest (i.e., the apparent absence of compensatory reproduction or survival; Kuck 1977) may be deciphered. Populations showing nonlinear density dependence should be most productive at densities just below Kl; density dependence may be difficult to detect if such populations are reduced by harvest substantially below Kl (Fowler 1981a).
Mountain goats—and mountain ungulates (sensu Schroder 1985) in general—may be especially sensitive to resource limitations; body growth, age of sexual maturity, and litter size may change sharply near Kl. Long-established mountain goat populations sometimes do not show marked density dependence (Hebert and Turnbull 1977; Kuck 1977). This suggests that the goat-induced changes in plant species composition and cover at Kl may not be quickly reversed by reducing the goat density (Adams and Bailey 1982). The time lag in response may exceed the length of most studies. This suggestion is speculative, and vegetation on the KR summer range changed measurably in response to reduced goat densities (see Chapter 10), but alpine plant communities elsewhere may require decades or longer to recover from just the nonconsumptive uses of humans (e.g., Willard and Marr 1970, 1971; Bell and Bliss 1973).
| <<< Previous | <<< Contents >>> | Next >>> |
chap5.htm
Last Updated: 12-Dec-2007