
|
Geological Survey Professional Paper 631
Analysis of a 24-Year Photographic Record of Nisqually Glacier, Mount Rainier National Park, Washington |
QUALITATIVE INTERPRETATIONS
CHARACTERISTICS OF THE TERMINUS
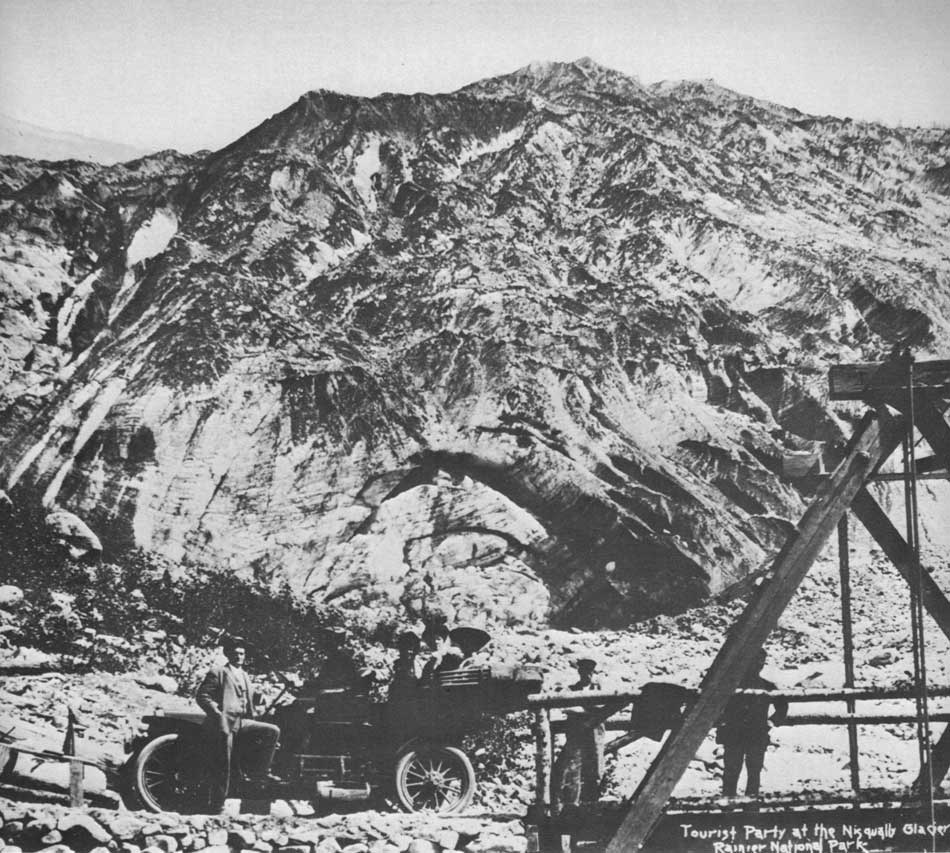
The terminus of Nisqually Glacier has been illustrated by photographs since 1884. These complement the field surveys by showing in more detail the irregularities of the terminal margin and by indicating its approximate position during periods when no surveys were made. For example, figures 16 and 17 show that the glacier terminus near the falls at left was in a more advanced position in 1908 than in 1903.
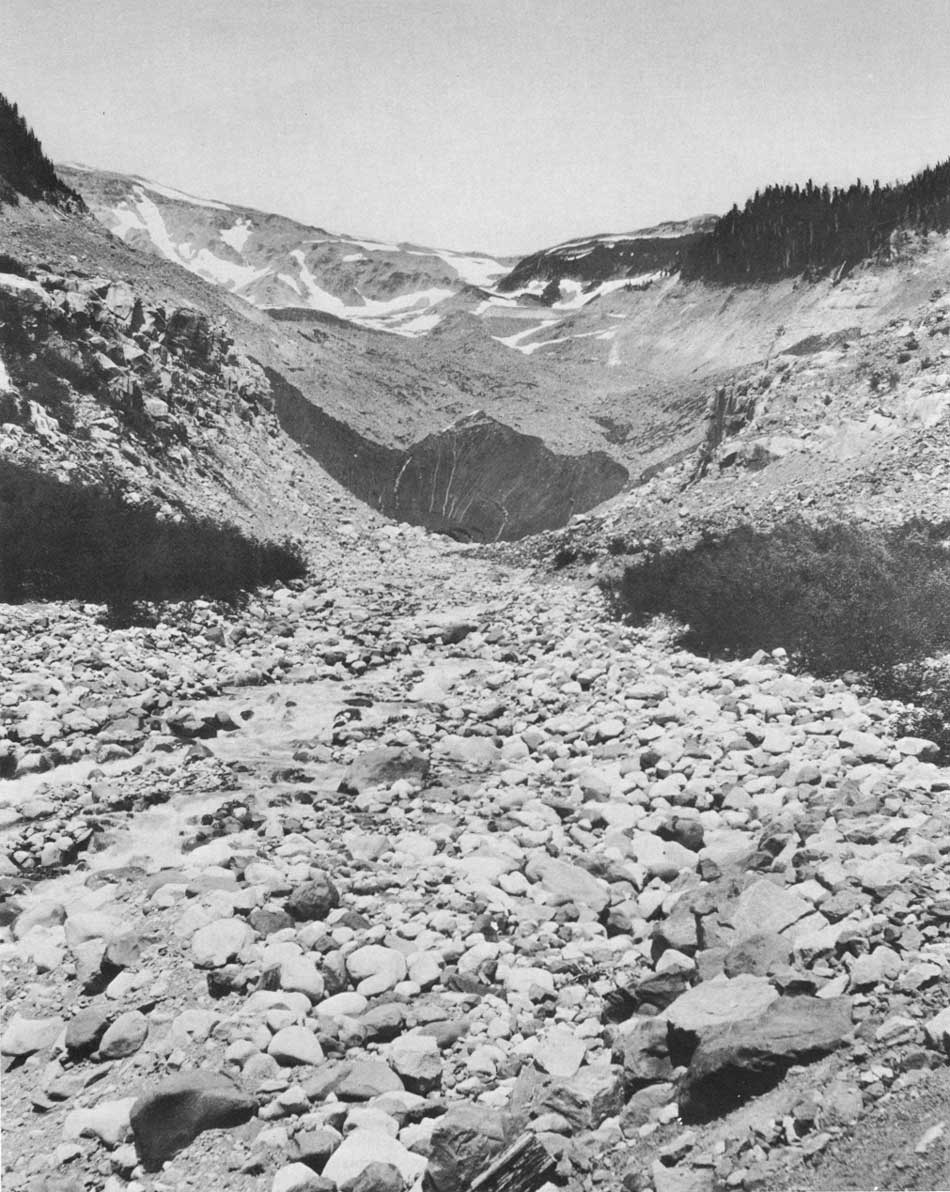
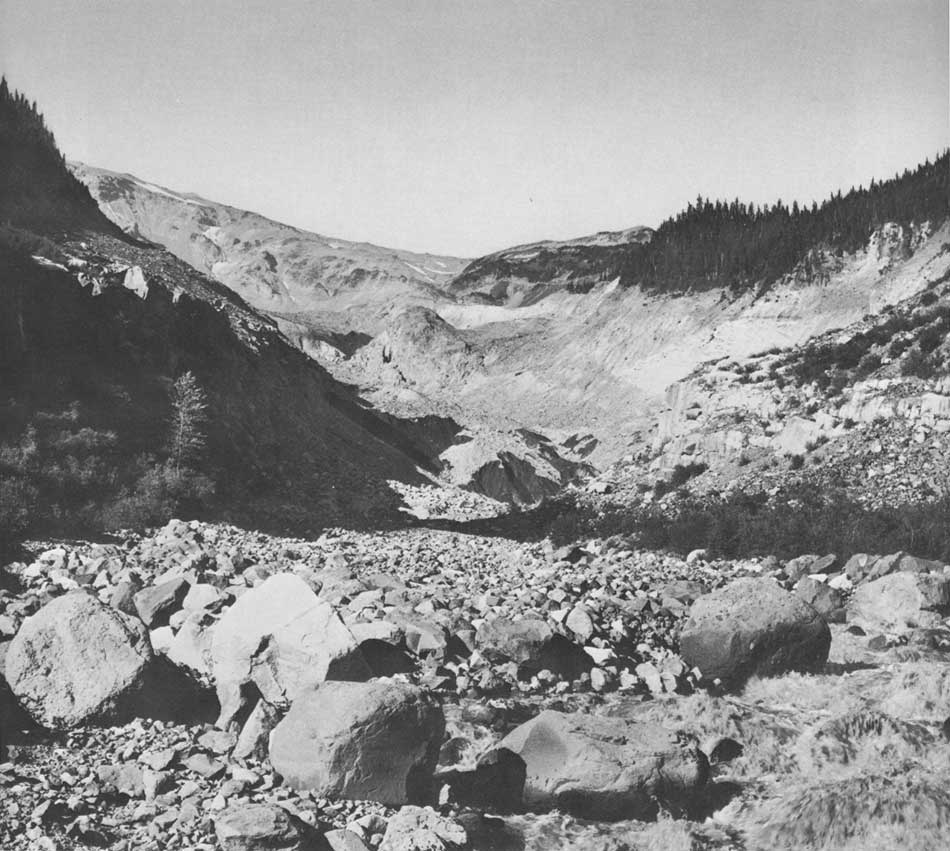
The dynamic condition of a glacier's snout also is revealed by photographs (Meier and Post, 1962). By its characteristic bulging, crevassed, "fat" appearance an advancing terminus (fig. 16) usually can be distinguished from a retreating terminus (figs. 17-19). If a glacier is receding or stagnant, the front has fewer crevasses and is more gently sloping; it may be segmented as is shown in the 1962 picture in series 5 (fig. 24) where the advance of fresh ice is visible upglacier but has not yet affected the dead-ice terminus. Ice hummocks on the glacier (fig. 17) also indicate a wasting condition. The "sliced-off" appearance of the terminal front shown in figure 18 has been typical of Nisqually Glacier's stagnant terminus during its long recession. For further illustration of changes in the glacier's terminus, see figures 20-25.

|
| Figure 16.—Photograph of the terminus selected from series 1—NE, taken from a point at or near the old highway bridge in 1903. Note bulding shape of terminus, steepness of downstream face, and the vertical crevassing pattern. These characteristics suggest that the terminus is, or has very recently been, advancing. Photographed by Eugene Ricksecker; furnished by the National Park Service. (click on image for an enlargement in a new window) |
|
| Figure 17.—Photograph of the terminus selected from a series 1—NE, taken from a point just below the old highway bridge in 1908. Note changes in terminus with respect to 1903 photograph. At upper left the bulging ice has been replaced by ice hummocks; the crevassing pattern on downstream face is no longer predominantely vertical; ice surface now has the general appearance of being melted and eroded. These conditions suggest that the advance has ceased and the terminus has begun to recede. Photographed by Mr. Leftbetter of Seattle; furnished by Tacoma City Light. (click on image for an enlargement in a new window) |
|
| Figure 18.—Photograph of the terminus selected from series 1—NE, taken from a point at or near the old highway bridge on July 5, 1929. In marked contrast to the 1903 and 1908 appearances, the noncrevassed, "sliced-off"-looking terminal face and the generally concave, debris-covered condition of the surface above indicate that the terminus is now definitely receding and is approaching a stagnant condition. (click on image for an enlargement in a new window) |
|
| Figure 19.—Photograph of the terminus selected from series 1—NE, taken from a point at or near the old highway bridge on August 19, 1942. The terminus is now more irregular and segmented than in 1929. This suggests stagnation, as there is little evidence of ice flow to the terminus from above. The rate of melting is probably reduced because of the extensive debris cover. (click on image for an enlargement in a new window) |
The photographs in this report, when viewed in the light of contemporaneous field survey results, show that the appearance of a glacier's terminus is roughly indicative of its dynamic state; however, the terminus does not reflect any condition upstream from the terminal area. Further, annual pictures of the snout do not necessarily reveal the presence or absence of movement of the terminus. For example, while photographs might illustrate the occurrence of a net recession of 30 feet (9 m) in a 12-month period, this could have resulted from 10 feet (3 m) of forward movement accompanied by 40 feet (12 m) of melting, or 70 feet (21 m) of forward movement offset by 100 feet (30 m) of melting.
| <<< Previous | <<< Contents >>> | Next >>> |
pp/631/sec4.htm
Last Updated: 01-Mar-2006