
|
Geological Survey Bulletin 1221-A
Rockfalls and Avalanches from Little Tahoma Peak on Mount Rainier, Washington |
MOVEMENT AND VELOCITY OF THE AVALANCHES
Prior to the rockfalls in late 1963, there was a large buttress on the north side of Little Tahoma Peak (compare figs. 12, 13); the collapse of this buttress caused the avalanches. The abundance of certain kinds of rock in some avalanche units and not in others leads the authors to conclude that different parts of the buttress fell at different times, although it is not known whether these separate falls occurred at intervals of minutes, hours, or days.
As sections of the buttress fell onto Emmons Glacier, they shattered and moved obliquely down the glacier. The avalanche debris was moving northeastward when it reached the glacier terminus. Some of the avalanches struck the shoulder of Goat Island Mountain, rose several hundred feet up its side, and then were deflected northward. The avalanches then rose 185 feet up the north lateral moraine and were deflected southeastward (fig. 10, cross sections 2-7). After avalanche unit 3 was deflected by the lateral moraine, it flowed into the gap near the south end of the terminal moraine. Here it scarred Goat Island Mountain, caromed northeastward across the valley, and rose a short distance onto the terminal moraine again before continuing downvalley.
The avalanches represent a type of dry landslide termed "rock-fragment flow." During movement, these dry flows are mixtures of rock debris and air. Their flowing motion probably is a result of buoyancy given to the mass by air trapped and compressed within and beneath the rock-fragment flow. Varnes (1958, p. 34) suggested that such a mass becomes a kind of density current1 of high specific gravity and unusual velocity. He also stated that these dry flows of rock debris may be caused by volcanic explosions or by very large rockfalls or rockslides.
1Density currents are moving masses of gas or liquid (commonly mixed with pulverized solid material) which are of greater density than the gas or liquid in which they are enclosed.
|
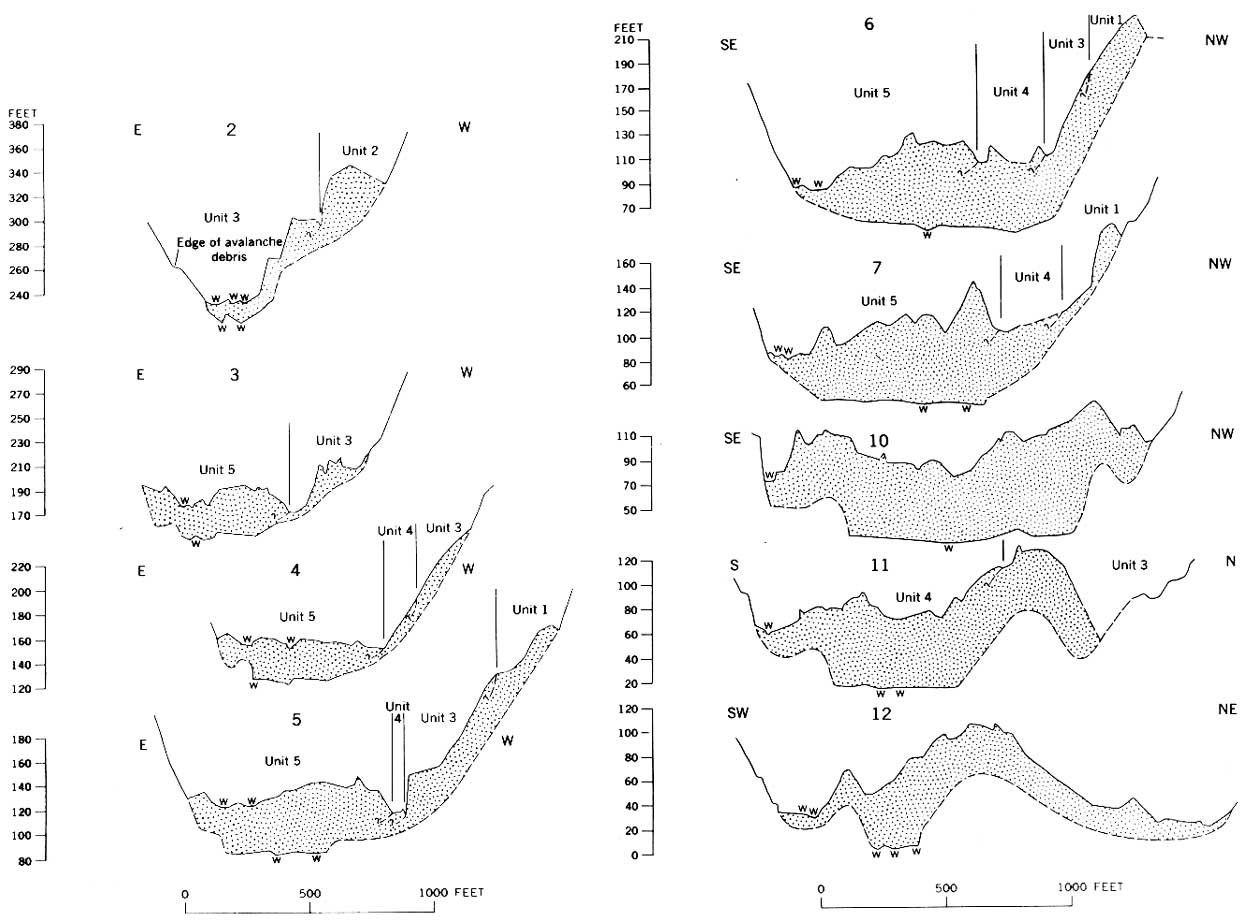
| FIGURE 10.—Transverse cross sections of avalanche deposits. Position of White River before and after the avalanches is indicated by the letter w. Pre-avalanche topography is based on a survey made by Fahnestock in August 1963. Locations of the cross sections are shown in figure 7. The vertical scale is referred to an arbitrary datum. Verticle exaggeration is X 5. (click on image for an enlargement in a new window) |
|
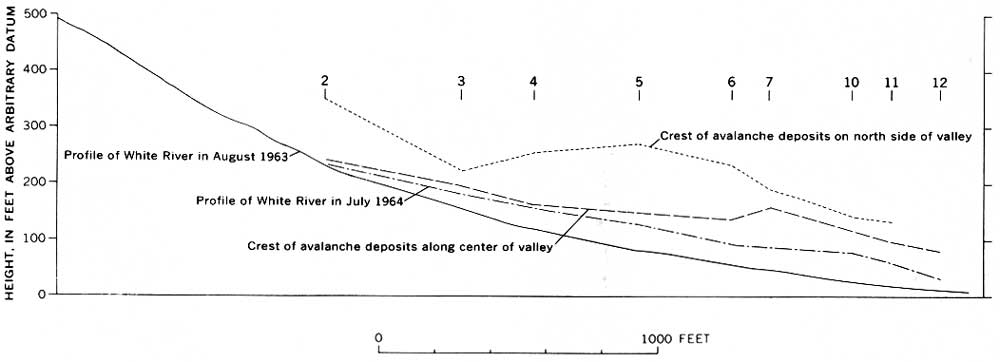
| FIGURE 11.—Longitudinal section of avalanche deposits, showing the height of the deposits above the former and present flood plain of the White River. Preavalanche profile is based on a survey made by Fahnestock in August 1963. Numbers 2 to 12 indicate position of sections shown in figure 10.(click on image for an enlargement in a new window) |
Eyewitnesses of rock-fragment flows tell of a cloud of rock debris pouring like a liquid over the land surface, filling depressions and being deflected by obstacles. A steam explosion that blew out a large part of Bandai-san volcano in Japan in 1888 formed a tremendous rock-fragment flow that devastated an area of 27 square miles. Sekiya and Kikuchi (1889, p. 109 and 106-107, respectively) believed that the greater part of the rock-fragment flow was dry during movement, and they surmised that its movement was similar to that resulting from a large rockfall which they observed in the crater of Bandai-san sometime after the steam explosion. They described the rockfall as follows:
One day, while we were at work in the crater, a huge slice of the precipitous wall of rock that had been bared by the explosion fell suddenly and crashed with a tremendous uproar down the steep incline beneath. This slab fell from a place about 300 metres high. The great masses of earth and rocks were shattered as they fell, and broken up into pieces, ever growing smaller as they descended. The behaviour of this pulverized mass resembled the rush of a headlong torrent. Although boulders measuring 10 metres or more in diameter were mixed up with finer matter, as a whole the movement approximated to that of a fluid. No words can describe the fierceness and force of that impetuous downpour—its mad surgings this way and that, and the bold leaps with which it would now and then bound over low ridges that hindered its progress, and shoot onward down the neighbouring depression.
That the Little Tahoma avalanches moved in a manner like that of a fluid is inferred from the way the debris caromed from one side of the valley to the other during movement. The heights the avalanches reached on the lateral moraine and on Goat Island Mountain are thus explained by centrifugal force, which caused the flowing debris to rise higher on the outer side of its curving path.
The path followed by avalanche unit 3 required that the debris move at high velocity; some of the speed was attained as masses of rock fell vertically as much as 1,700 feet from Little Tahoma Peak. Within a distance of 1.3 miles from the base of the rockfall scar, the avalanche descended an additional 2,400 feet. It had by then attained enough velocity to travel 3 miles farther across the more gentle slope of the lower glacier and valley floor to its present resting place.
That a high velocity was attained by avalanche unit 3 is indicated by the fact that some of the highest points on the terminal moraine were buried by debris and by the fact that the avalanche debris rose high on the outside of valley bends (fig. 10). At several places the direction of movement of the avalanche was nearly at right angles to the valley walls, and debris was deposited high on the valley sides. Two tongues of debris ran up on Goat Island Mountain to estimated heights of 250 to 300 feet above the adjacent valley floor, and, farther downvalley, the tongue of debris that moved through the gap in the terminal moraine reached a height of 140 feet on Goat Island Mountain.
|
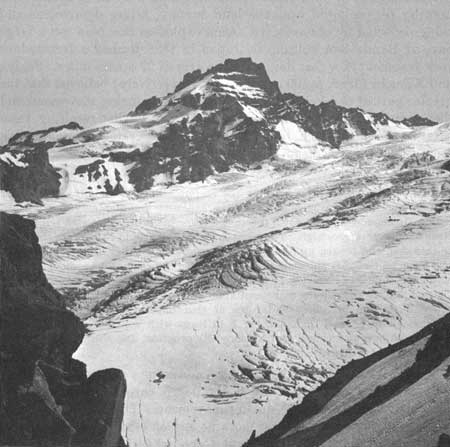
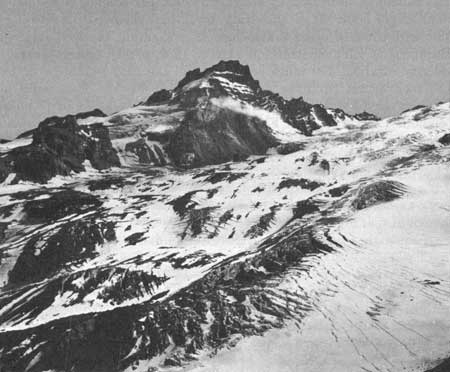
| FIGURE 12.—Little Tahoma Peak as viewed from Mount Ruth in 1956. |
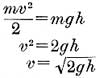
If it is assumed that the energy of avalanche unit 3 on the valley floor was wholly kinetic energy
|
(mass X velocity2)
2 |
which was completely transformed into potential energy (mass X gravity X height) without frictional loss, a velocity may be computed for the avalanche from the height to which it rose on Goat Island Mountain. This computation is made by the following equation, in which g represents the value of the acceleration of gravity (32 ft per sec per sec), v = velocity, m = mass, and h = height:
If h=300 feet, v=139 feet per second, or 95 miles per
hour;
if h=250 feet, v=127 feet per second, or 87 miles per hour;
if h=140 feet, v=95 feet per second, or 65 miles per hour.
|
| FIGURE 13.—Little Tahoma Peak as viewed from Mount Ruth July 9, 1964. Small cloud in front of the peak is formed by water vapor rising from the lower right side of the rockfall scar. (See fig. 16.) |
The velocities indicated are probably too small because friction caused loss of energy as the debris rose on the flanks of Goat Island Mountain. Furthermore, there must have been a substantial downvalley component of movement that would have caused the avalanche to travel faster than the computed velocities indicate. If the height is decreased by 50 feet to allow for the thickness of the avalanche, velocities should be decreased by roughly 15 feet per second, or by about 10 miles per hour. It is interesting to compare these calculated velocities with those of other avalanches. For example, the 1881 rockfall avalanche at Elm, Switzerland (Heim, 1932, p. 93), had an average velocity of about 100 miles per hour, and the 1962 avalanche of ice and rock debris from the northwest face of Nevado Huascaran in Peru traveled 9 miles in 7 minutes at an average velocity of 77 miles per hour (McDowell and Fletcher, 1962). The estimated minimum speed of avalanche unit 3 from Little Tahoma Peak also is similar to that computed for other rockfall and rockslide avalanches in North America (table 1), using the formula described above.
TABLE 1.—Comparison of Little Tahoma
rockfall-avalanche deposits with others
in the United States and Canada
[Thickness of the avalanche deposits is not taken
into consideration in computation of velocity]
| Location and Reference | Year | Volume of debris (millions of cu yds) |
Maximum distance of movement (miles) |
Approximate maximum vertical drop (feet) |
Maximum runup (feet) |
Velocity of avalanche (mph)1 |
| Madison Canyon, Mont. (Hadley, 1964) | 1959 | 37.0 | 1.0 | 1,300 | 430 | 2112 |
| Gros Ventre, Wyo. (Alden, 1928) | 1925 | 50.0 | 1.2 | 2,100 | 350 | 102 |
| Frank, Alberta (Mcconnell and Brock, 1904) | 1903 | 47.8 | 2.5 | 2,860 | 400 | 109 |
| Little Tahoma Peak, Wash. (this paper) | 1903 | 14.0 | 4.3 | 6,200 | 140 300 | 65 95 |

2A maximum velocity of 100 mph was estimated by Hadley.
The maximum velocity of a rockfall and the subsequent rate of descent of an avalanche on Emmons Glacier can be crudely estimated from the acceleration of gravity. A mass of rock falling from a height of 850 feet, half the height of the rockfall scar, would have attained a velocity of about 160 miles per hour just before it struck Emmons Glacier, assuming free fall. The avalanches probably also accelerated throughout their first 7,000 feet of travel downglacier, as they descended about 2,400 feet. Although a loss of velocity must have occurred as falling rock masses struck the glacier, as a cross-glacier component of movement occurred after impact, and as sliding on the glacier produced frictional resistance, it seems likely that an avalanche would have been traveling at a speed of 100 to 300 miles per hour when it left the end of Emmons Glacier.
Some of the avalanches probably were aided in their movement beyond the glacier by a cushion of air trapped beneath them which buoyed them up; this cushion reduced friction and permitted the avalanches to be transported a much greater distance than if they had traveled in actual contact with the valley floor.
The formation of a cushion of air beneath moving rock debris has been analyzed by Shreve (1959), who studied a large prehistoric rock fragment flow at the northern edge of the San Bernardino Mountains in southern California. The deposit is about 2 miles wide and extends over a piedmont slope for a distance of about 5 miles beyond the mountain front. Shreve suggested that the rock-fragment flow was caused by a large rockslide or rockfall on the northern face of Blackhawk Mountain and that, after initial impact, the flow was launched laterally into the air from a rock step near the base of the mountain. Lateral movement was at such a high velocity, the maximum was estimated to be 250 miles per hour, that air became entrapped and formed a cushion beneath the sheet of rock debris. Escape of air along the margins of the rushing mass permitted its outer edges to drop to the underlying surface, where they formed marginal ridges that hindered further escape of trapped, highly compressed air.
Preservation of a fragile thermograph shelter about 1.5 feet high in the gap near the south end of the terminal moraine suggests that a cushion of air was trapped beneath avalanche unit 3. Although this avalanche did not damage the shelter in passing over it, the shelter was subsequently crushed by a 10-inch boulder that rolled down the front of avalanche unit 5. A pile of boards that lay on the ground near the shelter also was not disturbed by avalanche unit 3 but was buried by a few inches of avalanche debris. A protective layer of snow seemingly cannot account for the lack of damage, for if the avalanche had been traveling in contact with the ground, the leading part should have scraped away the snow, and the trailing part should then have destroyed the thermograph shelter. Evidently the base of the avalanche was not in contact with the ground when it crossed this site. A 6-foot-high plywood gage house, less than 10 feet from the shelter, was removed by avalanche unit 3. This gage house was transported about 300 feet southward in a direction nearly at a right angle to the trend of the valley and now lies at the upstream end of the scar opposite the terminal moraine (fig. 7). This scar (fig. 9), produced by the scouring action of the avalanche as it struck the side of the valley and caromed back to the northeast, suggests the nature of erosion that should have occurred everywhere at the base of the avalanche if a cushion of air had not been present.
The existence of an air cushion beneath avalanche unit 3 is also suggested by the distance, about 9,500 feet, the avalanche moved beyond the end of Emmons Glacier. Regardless of its velocity as it left the glacier, the avalanche should have struck the valley floor within a time interval determined by the acceleration of gravity through the vertical distance between the top of the glacier and the valley floor at the point of impact. If the avalanche had struck the valley floor at the calculated point of impact, 2,000 feet or less from the end of the glacier (fig. 14), it seemingly could not have traveled in contact with the valley floor as much as 7,500 feet farther downvalley, nor have risen on the side of the lateral moraine and on Goat Island Mountain, nor have made a nearly right-angle turn through the gap in the terminal moraine. Therefore, it seems unlikely that the avalanche debris struck the valley floor within a few thousand feet from the glacier and this circumstance can be explained only by the supposition that the avalanche was buoyed up by a cushion of compressed air at its base.
The initial impact of a rockfall would not itself create an air cushion; the formation of this cushion may require lateral launching of a broad sheet of debris into the air parallel to the underlying surface so that the debris as it starts to settle can trap air quickly and compress it. Further requirements would be previous pulverization of the rock mass to form a sheet of debris and sufficient thickness and impermeability of the debris to prevent substantial upward escape of air. Air passing upward through the debris, however, would tend to fluidize the mass by reducing friction between rock particles and thus would increase mobility.
Pulverization of the rock masses from Little Tahoma Peak occurred when they struck Emmons Glacier. Sheets of rapidly moving debris then descended the glacier and probably were launched laterally into the air as they left the terminus of the glacier, which is 200 to 300 feet high. Formation and preservation of a cushion of air beneath the avalanches in the valley would have been aided by the confining valley sides. Marginal ridges comparable to those of the Blackhawk landslide described by Shreve (1959) are not conspicuous, although they may be represented by ridges along the north side of the deposits at the locations of cross sections 2, 4, 5, and 6.
Because of the distance and the inferred nature of their movement downvalley, avalanche units 1, 3, 4, and 5 are thought to have moved as rock-fragment flow's, probably riding on air cushions. Avalanche units 6 and 7 stopped only short distances beyond the glacier and may have moved as debris slides in contact with the underlying surface throughout most of their distance of transport. The nature of movement of avalanche unit 2 cannot be inferred because of its limited area of outcrop.
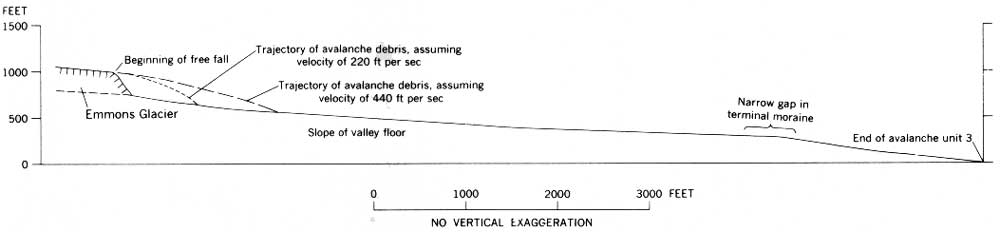
|
| FIGURE 14.—Diagram showing expectable points of impact of avalanche unit 3 on valley floor if avalanche had not been buoyed up by a cushion of air. A speed of 300 miles per hour (440 ft per sec) was the probable maximum velocity of the avalanche debris at the end of the glacier, although 150 miles per hour (220 ft per sec) may be a more reasonable estimate. The glacier slope was estimated to be 10 percent, and the velocities of 150 and 300 miles per hour were assumed to be parallel to the slope of the glacier. (click on image for an enlargement in a new window) |
| <<< Previous | <<< Contents >>> | Next >>> |
bul/1221-a/sec3.htm
Last Updated: 28-Mar-2006