|
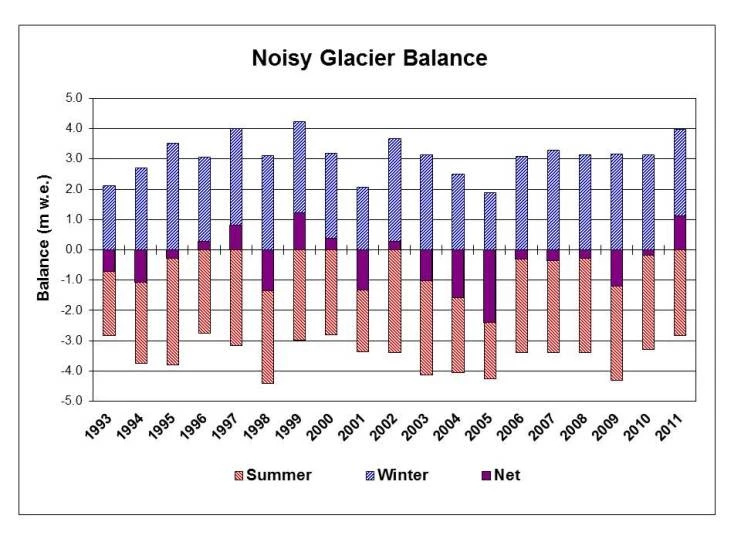
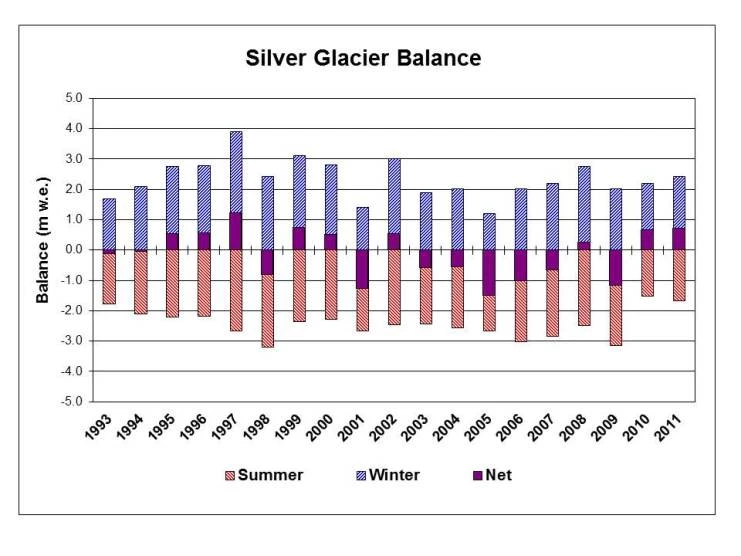
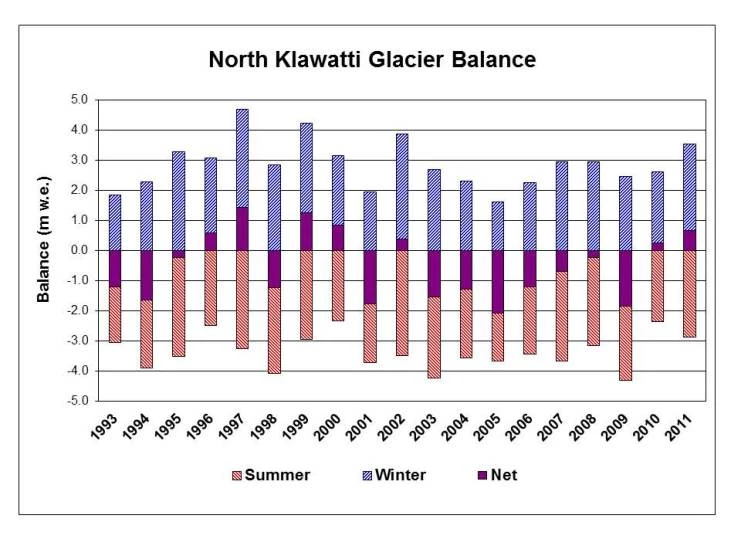
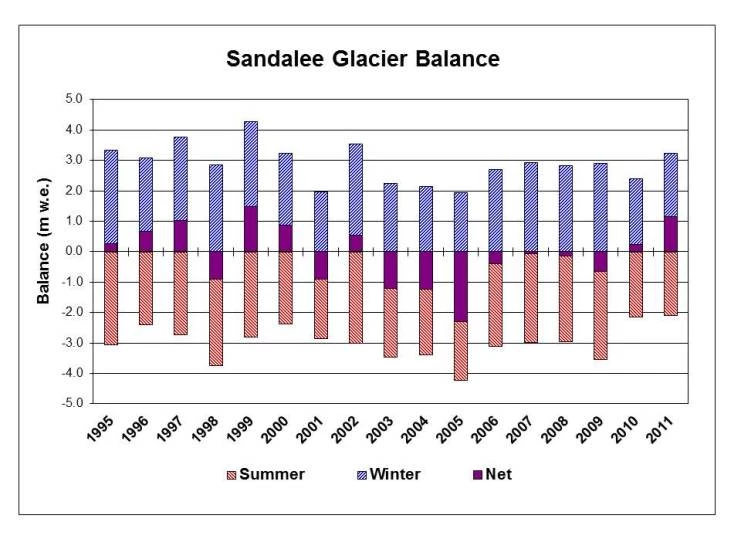
The four charts (Figures 10-13) summarize data collected over the past 18 years for each glacier. The vertical axis is the amount of water gained (winter balance), lost (summer balance), and retained (net balance) in meters of water equivalent (m.w.e.) averaged across the glacier. We use water equivalent as a measure because of the varying density of snow, ice and firn. This system allows us to summarize the melting of all three as one value. The horizontal axis lists the year of measurement on each glacier. Winter balance is always positive, while the summer balance is always negative. The net balance varies depending on whether or not the snowfall from the previous winter exceeded melting the following summer. Melt is greatest at the lowest elevations, often exceeding eight vertical meters. In addition, the data show a tendency for cool summers following wet winters, along with hot summers following dry winters. When these seasonal factors are coupled, the glaciers respond by positive balance and extreme negative balance, respectfully.
|
Last updated: August 11, 2017