Okay! Our little field experiment went well on Wednesday and while I'd love to throw down some seriously in-your-face science stuff, we'll keep this easy and light... it will benefit us both I think.
So first up is our methodology. I had the YCCers chose points in a buckthorn grove at the Southern end of Coldwater; after which we measured out 1 meter by 1 meter squares. I then had them count the number of species and the number of individuals of each species. Before we had started, I had generated an MS Excel spreadsheet with statistical equations so that we could essentially see how the number of species changes between their sites and what the odds were of blindly picking two individuals of the same species at random.
Now for some graphs...

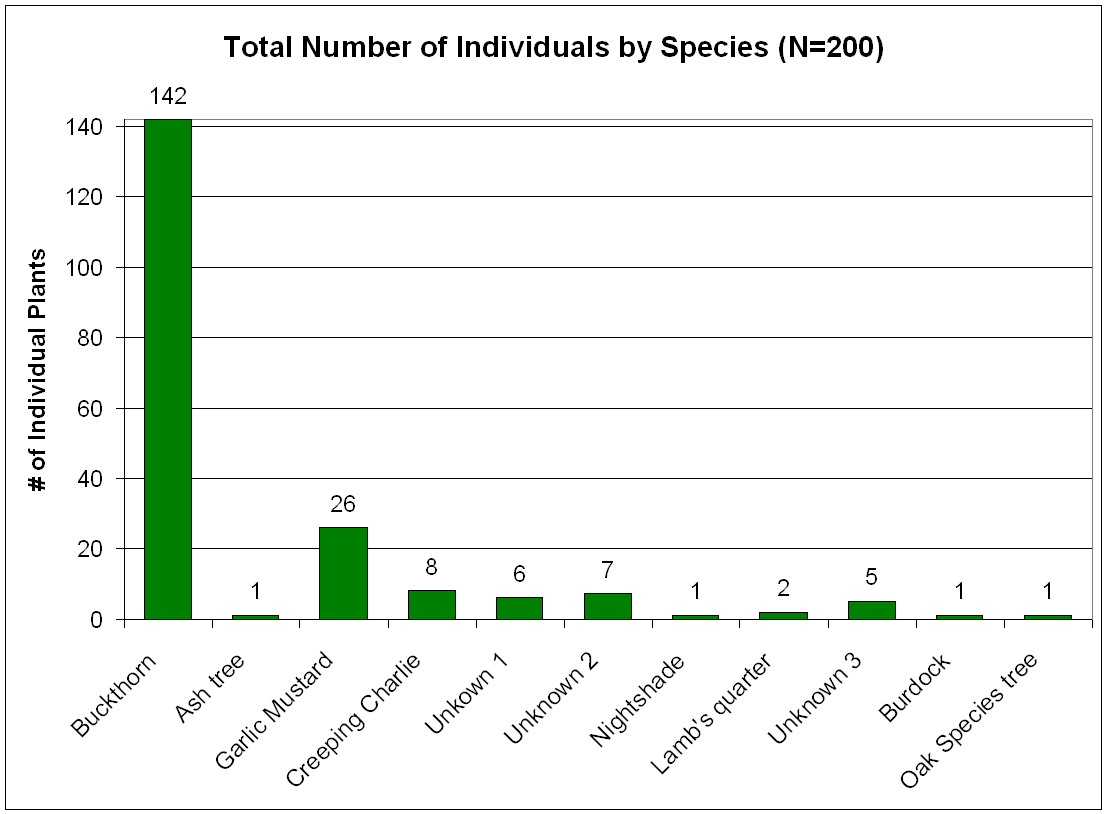
This last graph shows that we counted 200 individual plants over 4 square meters, with almost 75% of it being buckthorn... this equates to one Buckthorn tree/sapling every 3.3 inches by 3.3 inches - yes, very dense indeed, but (subjectively) we've seen even more dense buckthorn stands over the last week with the area we've been treating next to the Fort Snelling Bike Trail!
Here's another...

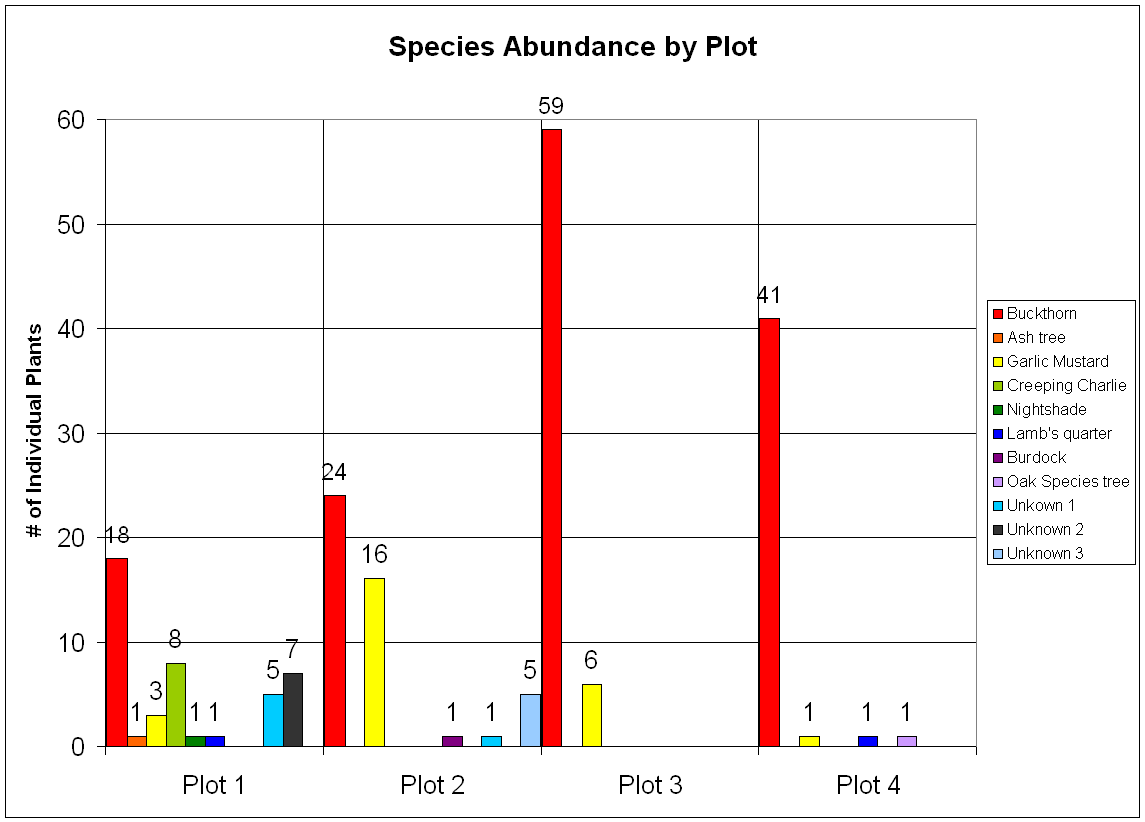
This graph shows what we counted, The YCCers had Plots 2 through 4 and I had Plot , which was a ways away from them. More importantly, This shows both how import proficiency at identifying plants is to ecological survey and how dominant buckthorn was at our plot sites - we had only two native trees, a very young Ash tree and a +100 Oak; sad, but not surprising.
And finally...

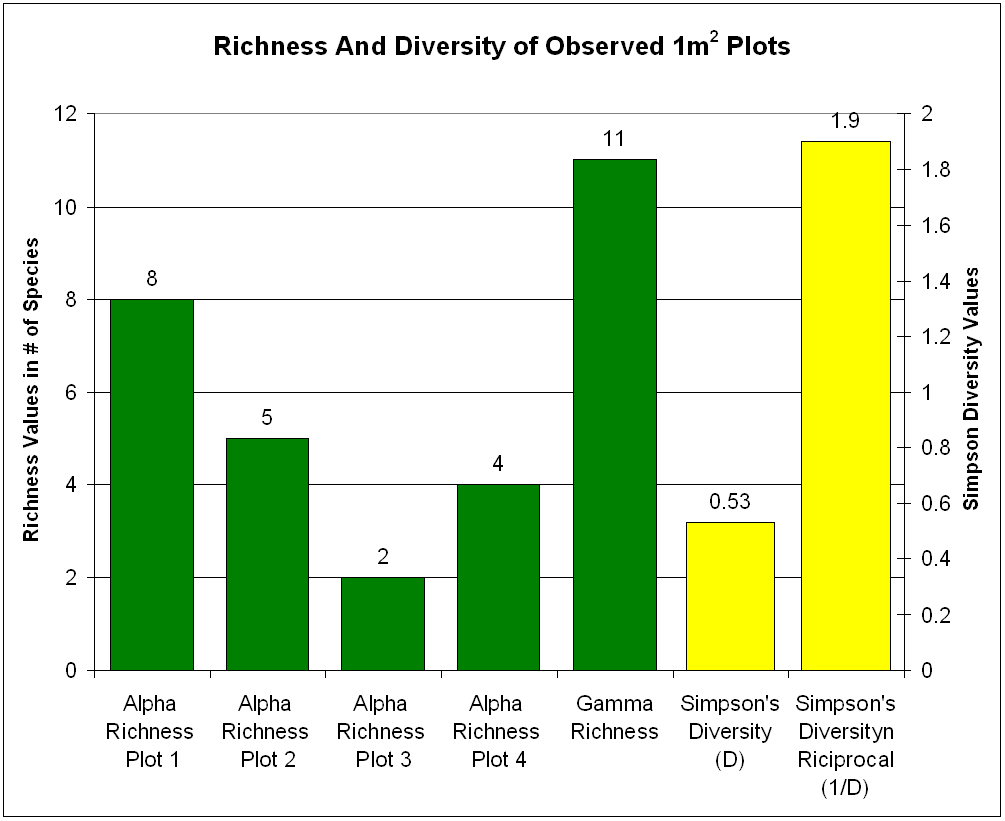
This graph shows three things: Alpha Richness, Gamma Richness and Diversity. Alpha Richness is simply the number of species within each of the plots. Gamma Richness is the total number of different species we counted in our experiment. Simpson's Diversity is the probability of picking two plants of the same species at random (low is good, think of it as a percentage) and Simpson's Reciprocal is just another, intuitive way of showing the previous but with higher numbers being better. Our values are fairly low (bad?). Restored oak savannas typically have higher richness (greater than 80 species) and low diversity values (less than 0.1 or a 10% chance of picking two identical species).
So what does it mean? This experiment, laden with systemic faults, still allows us to use objective quantification (measurements) to describe our subjective qualifications (our impressions) of a super-dense buckthorn grove. In turn, this allows us to compare, to a certain degree, the health and status of an ecosystem to other ecosystems... I think its cool - hopefully, you agree., but I understand if you think otherwise...
