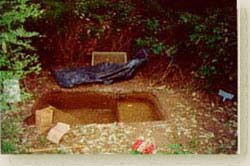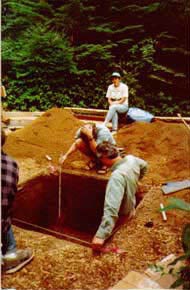
NPS Photo Process Of Discovery John W. Weymouth Fort Clatsop near the town of Astoria, Oregon is the site of Fort Clatsop erected by Lewis and Clark in 1805. This site has been tested by excavation at various times. There is a reconstruction of the Fort at the Memorial but the precise location of the Fort is not known. As part of the ongoing archaeological study of the Fort, the Fort Clatsop contracted to have a magnetic survey conducted over part of the site area in 1996. The survey covered about 600 square meters south-west and about 200 square meters north-east of the reconstructed fort. This is a report of that survey. Archaeological Research 1957-1998

NPS Photo Two areas were surveyed, Area 1 south-west and Area 2 north-east of the fort exhibit. Figure 1 shows the layout of the surveys blocks relative to the fort exhibit. Also on this figure are the positions of the grid points at which gradiometer values were obtained. Area 1 Figure 2 is a line contour magnetic map of Area 1 with a contour interval of 2 nT/in clipped at +/- 50 nT/in to suppress the large iron anomalies. Also shown on this figure is the location of the fort reconstruction. Figure 3 is a gray scale map of the same data. To identify the various anomalous regions Figure 4 was drawn with the anomalies outlined and with a contour interval of 10 nT/in so as not to complicate the map. The large iron anomalies on the west end were caused by a water pipe. The areas of interest are the two complex regions centered around N106,E65 and N110,E72 and the linear anomalies north of N113. It is difficult to say what the complex regions contain. The one centered at N106 has some iron sources. The more northern one may contain a burned earth area. The linear anomalies are very subtle but can be established by carefully examining gray scale or color maps and profiles. These linear features are perpendicular to the direction of the traverses so are not artifacts of the survey. Although there are some radar "hits" in the complex areas the correlation is not strong because there are several other places which also gave radar responses. Perhaps the most promising region is the complex centered at N110,E72. Area 2 Figure 5 is a line contour map of Area 2 with a contour interval of 1.5 nT/in. In addition anomalous area are outlined on this map with bold lines and the two 1996 excavation units are outlined with dashedlines. Figure 6 is a gray scale map of the same data. Most of the indicated anomalies are in the 2 to 5 nT/in range with one area, centered at N103,E107, having a maximum of about 20 nT/in. The anomaly at N106.5,E109.5 is in the 70 to 80 nT/in range. This most probably has a metal source. All the other anomalies could be from burned earth or other anthropogenic disturbances. Several of the subtle anomalies appear to lie along a linear alignment. Figure 7 is a repeat of Figure 5 but with a 5 nT/in contour interval and a line drawn through this alignment. There is one radar anomaly in this alignment and three others near it. These are marked on the KG maps. The large square outlined in Figure 7 is the regions within Area 2 that was covered by radar. Thus it can be seen that no radar traverses were done directly north of the region covered by the gradiometer. It should be noted that the excavation unit 1996.2 or Q2 had a feature at the north-west corner. A "sharp edge feature, a possible structure" (communication from Ken Karsmizki). This would place the feature next to one of the anomalies in the alignment. In addition a wooden stake was found in this unit at a 18 to 20 inch depth. CONCLUSIONS Two areas in the vicinity of the Fort Clatsop reconstruction have been surveyed with a fluxgate magnetic gradiometer at a 1/2 m by 1/2 m interval. Area 1 south and west of the reconstruction covered 600 square meters which is pretty much the accessible space. It contained several non-historical anomalies. The areas of interest are two complex regions and three linear anomaly groups. The most promising regions for further excavation testing are probably the complex centered at N110,E72 and the linear anomalies. The next place to do a magnetic survey is probably north of the present survey area just west of the fort reconstruction. Area 2 north-east of the fort reconstruction seems more promising. Two hundred square meters were covered here. A string of small anomalies suggest a linear feature. Excavation unit 1996.2 probably just touched on this linear feature ad should be extended west. Other anomalies in this alignment should be tested. Both the magnetic survey and the radar survey should be extended north of the present survey to see of the linear feature continues or turns. Although it may not be germane to the present study it would be interesting to extend the magnetic survey into the area where it is presumed that Shane had his house. REFERENCES Bell, James W 1990 Report of the Geophysical Survey of Fort Clatsop National Monument, Astoria, Oregon. 1996 Personal communication and recorded on GIS maps, Garnett, 1996 Caywood, Louis R. 1948 The Exploratory Excavation of Fort Clatsop. Oregon Historical Quarterly, Vol. 49, #3, pp 205-210 Ferris, Robert G., Ed., 1975 Lewis and Clark, Historic Places Associated with Their Transcontinental Exploration (1804-06). United States Department of the Interior, National Park Service, The National Survey of Historic Sites and Buildings, Volume XIII, pp 193-196. Garnett, Keith 1996 GIS Maps of Fort Clatsop. Weymouth, John W. 1986 Geophysical Methods of Archaeological Site Surveying. In Advances in Archaeological Method and Theory, vol. 9, edited by Michael B. Schiffer, pp. 311-395. Academic Press, Orlando, Florida. Report submitted in fulfillment of Purchase Order 1443PX-9420-96-015 from the Fort Clatsop
|
Last updated: February 28, 2015
