The Southeast Archeological Center
The Southeast Archeological Center (SEAC or The Center) is a support operation of the National Park Service's Southeast Region. The Center conducts and shares high-quality anthropological research based on multi-disciplinary methods and cutting-edge science, providing the best archeological and collections management assistance possible to national parks and our partners.
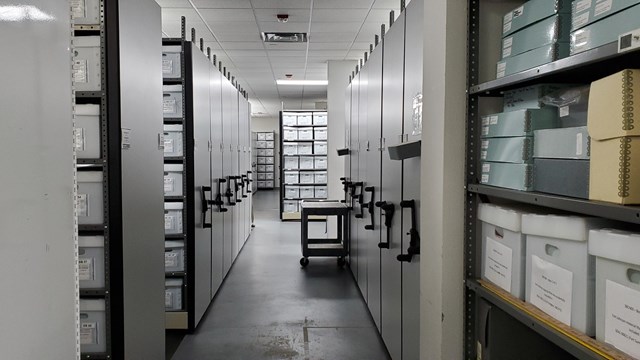
In assisting parks with their cultural resource management needs, SEAC facilitates the long-term production of archeological resources, compiling, utilizing, and disseminating the archeological information obtained from them. SEAC maintains impeccable ethical standards by reporting timely research findings to park, public, and professional audiences. In addition to annually generating numerous archeological reports as mandated by federal law and park operations, the Center is the repository for over eight million artifacts that make up the Southeast Region's research collections and cultural database.
Contact Us, visit the What We Do page, or click the links below for more information about the SEAC's programs and services.