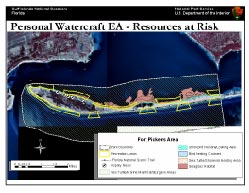
 Resource map of Fort Pickens Area, Florida. |
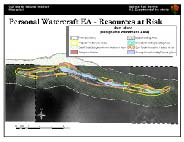 Resource map of Horn Island, Mississippi. |
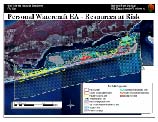 Resource map of Perdido Key Area, Florida. |
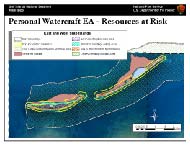 Resource map of East and West Ship Islands, Mississippi. |
Park interpreters now have a new and
exciting
tool to communicate a sense of place to park visitors. National parks,
in partnership with the US Geological Survey, have created GIS maps
that
offer stunning 3-D images of park topography and key features. At Grand
Canyon National Park, for example, GIS maps help make sense of the
immense
scale and grandeur of geographic features that have a tendency to
mystify
and astound. Using satellite photography, GIS technology translates
topography
into layered maps that illustrate canyon views, rock layers, and how
trails
cross canyon walls. Yet GIS technology does more than make pretty maps.
For example, GIS in the Grand Canyon shows the relationship between
temperatures
and canyon walls, information that could help save lives in a desert
landscape
with little or no water. At Hawaii Volcanoes National Park, maps use
GIS
layers and satellite imagery to create a birds-eye view of the
landscape.
With this technology, serious volcano watchers and novices can
instantly
find what they need from the same map exhibit. The evolution of GIS has
the potential to revolutionize web sites, media and other programs that
help us interpret national parks. Technology now offers hand-held
computers
for backcountry navigation, virtual hiking experiences, and GIS in park
planning. The evolution of GIS will open up new exploration, such as
virtual
flying, as interpreters help visitors make the most of their vacations
in our national parks.
Riley Hoggard, Gulf Islands NS and Jeffrey
Reed, University of West Florida
Personal Watercraft Environmental
Assessment
- Resource Mapping and Analysis
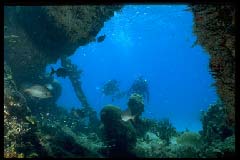
Whales, nesting ospreys, turtles, dolphins, and sea grass are all vulnerable to personal watercraft as they skim the surface waters of our national parks. Noise and vessel maneuvers easily frighten shorebirds. In shallow water, an accelerating watercraft can blow out patches of sea grass that support marine life and estuaries. And it’s hard to see, much less avoid, a turtle or other sea creature from a personal watercraft going 45 mph. To study the impacts of personal watercraft, Gulf Islands National Seashore used GIS software to map areas within view or earshot of personal watercraft areas. The park in Florida and Mississippi wanted the maps for public education, to understand how natural resources overlapped, and to determine areas where personal watercraft did not threaten the ecosystem. The maps displayed nesting sites of ospreys, eagles, herons, and shorebirds. The maps also showed popular areas for personal watercraft, swimming, and fishing, and displayed their locations in relation to documented sightings of air-breathing sea animals, such as endangered sea turtles, manatees, whales, and dolphins. The maps continue to help the park as it balances wildlife and habitat protection with recreational opportunities for park visitors.
|
Resource map of Fort Pickens Area, Florida. |
Resource map of Horn Island, Mississippi. |
|
Resource map of Perdido Key Area, Florida. |
Resource map of East and West Ship Islands, Mississippi. |
Click for Technical Article
Hikers scramble over rocks and enjoy
spectacular
views in the Great Falls area of the Chesapeake & Ohio Canal
National
Park near the nation’s Capital. Yet the historic, scenic, and
recreational
features that draw visitors to one of the most difficult and heavily
used
trails along the middle Potomac River also led to more injuries and
missing
hikers. To improve visitor safety and education, the park and its
conservation
partners upgraded trails and signs. They also spent two years creating
a GIS-based map and safety education publication called “Hiking Trails
of Great Falls Maryland.” The two-sided brochure shows hiking trails on
the front. The back offers visitor safety tips, trail descriptions,
National
Park Service regulations, emergency contact numbers, and alternative
trails
for less-strenuous hiking. The brochure also suggests ways for visitors
to leave nature as they find it on trails. The map creators used
various
data collection and display software including ArcView software
developed
by ESRI, and global positioning systems. The park printed the brochure
on water-resistant paper to meet the needs of visitors in most weather
conditions and as a park keepsake.
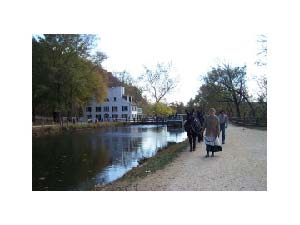 Canal Boat Interpretive Program at Great Falls |
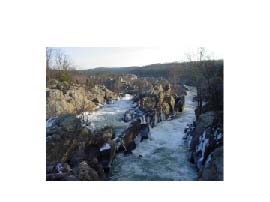 View of Potomac River looking towards Mather Gorge |
PDF of map brochure: "Hiking Trails of Great Falls Maryland"
Click for Technical ArticleThe seven islands that make up Dry
Tortugas
National Park offer stunning underwater views of shipwrecks, fish,
coral,
and other sea life. President Roosevelt set aside the pristine sands,
shoals
and reefs as a national monument in 1935. It has protected the area 70
miles west of Key West, Florida, as a national park since 1992. The
park
service has surveyed more than 50 square miles of seabed for display on
GIS maps to benefit park managers, researchers, and the public. GIS
mapping
helps park managers identify and select scenic diving and snorkeling
areas
for public enjoyment and long-term study. One underwater area known as
the Windjammer Site offers stunning views of a shipwrecked iron-hulled
sailing ship that sank in 1906. Visitors can find a GIS map of the site
at the park, on the Internet, and in a laminated version for underwater
use during visits. The underwater trail guide and fish-watchers guides
enhance the underwater experience. The park envisions adding historical
and archeological information with photographic and video imagery to
make
visits even more special. The park also is experimenting with ways to
bring
the experience to non-divers, children and physically challenged people
who want to know more about historic shipwrecks and the diverse natural
environment around them.
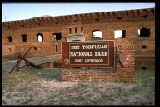 Front of Fort Jefferson on Garden Key |
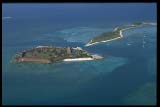 Fort Jefferson on Garden Key at Dry Tortugas NP |
 Visitors to the Windjammer wreck site can use the underwater "trail guide" to enjoy this historic wreck site. |
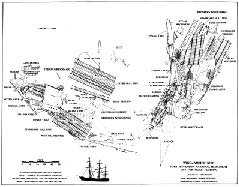 Windjammer "Trail Guide" (front page - site map) |
 Windjammer "Trial Guide" (back page - site interpretation) |
Additional Information
Gliding quietly in a canoe, you look up in awe at walls of ancient basalt towering over the river. Soon, the canyon opens into a wide valley carved from ancient glaciers. As you paddle, your gaze follows a great blue heron as it rises from the shoreline toward a bald eagle that dips and soars on the currents. This is the kind of view you would find during a visit to St. Croix National Scenic Riverway and its sister unit, the Lower St. Croix National Scenic Riverway, in Wisconsin and Minnesota. But idyllic scenes like this one are facing the kind of development pressures that threaten many national parks today. These pressures take the form of new housing, gravel pits, commercial strips, and hobby farms and their accompanying roads, communication towers, power lines, and more. Development threatens to fragment habitat and destroy critical natural, cultural and scenic resources beyond the boundaries of the St. Croix and Namekagon rivers as they flow to the Mississippi River. To preserve the area, the non-profit St. Croix Scenic Coalition, with the National Park Service serving in an advisory role, is using GIS software to identify and map valued community assets, such as scenic views. As a first step, area residents identified overlooks, trails, and roads that offered significant views in a particular area. The coalition downloaded the data into GIS software, which analyzed and displayed what could be seen from the different locations, and how often. Residents then returned to those locations and rated them using specific criteria. The resulting GIS map displayed the scenic quality of the area. These maps can help set priorities for conservation, direct development to other areas and help plan ecological corridors. The coalition hopes the effort will help reduce the harmful impacts of rapid development. A community cannot protect scenic areas it has not identified. Preserving natural areas in the St. Croix Valley serves the National Park Service mission to protect America’s wonders for future generations.
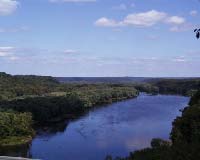 Representative scenery shot of Lower St. Croix NSR |
 Evaluation Criteria worksheet for ranking scenic views |
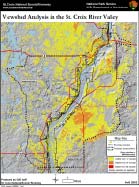 Map - Viewshed Analysis of St. Croix River Valley |
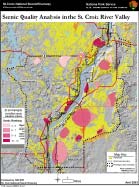 Map - Scenic Quality Analysis of St. Croix River Valley |