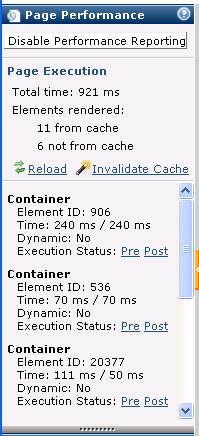
You can optionally view load times for the current page. Use this panel to evaluate problem pages or to optimize page display.
Toggle Enable/Disable Performance Reporting to activate/deactivate reporting for current page and page component rendering times.

With performance reporting enabled, click Reload to review both dynamic and cached page content performance.
Click Invalidate Cache to view page execution times without content caching. Each page component renders dynamically in real time for your review.
CommonSpot reports total response time in milliseconds, summarizing rendering time for all Elements and providing rendering time breakdowns for each Element in the current page, as shown for the container Elements below.
Mouse over the Pre and Post links to view before-and-after status.
In addition to reports, CommonSpot provides a set of features for improving site performance, including a dedicated Cache Server option that continuously rebuilds cache for all pages on a server and pushes any updates to each Read Only Production Server. See Stale Cache Handling and the Cache Server description in the Shared Database Configuration Guide.
Related Links
You can download PDF versions of the Content Contributor's, Administrator's, and Elements Reference documents from the support section of paperthin.com (requires login).
For technical support: