Climate is a primary driver of ecological change and an important component of the Central Alaska Inventory and Monitoring Network (CAKN). By monitoring seasonal and long-term climate patterns in the region, we can correlate climate changes and extremes to other variations in the ecosystem, such as changes in permafrost extent or vegetation composition.
The objective of climate monitoring is to record weather conditions at representative sites to identify long and short term trends, provide reliable climate data to other researchers, and to participate in larger scale monitoring and modeling efforts
Introduction
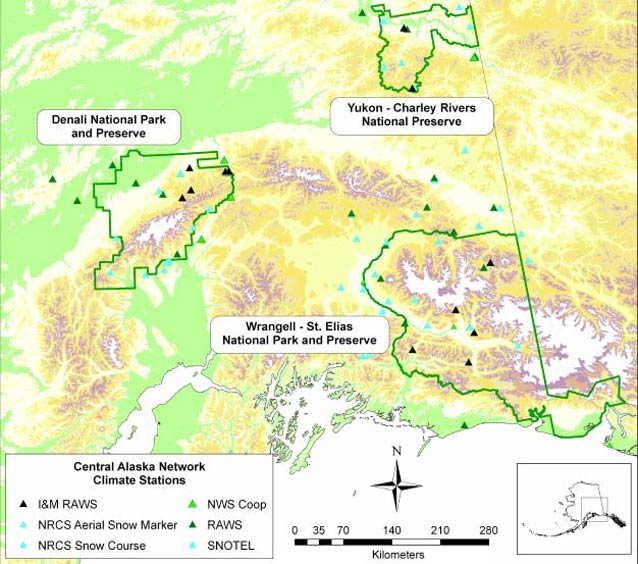
The Central Alaska Inventory and Monitoring Network (CAKN) covers 21 million acres in Denali National Park and Preserve, Wrangell-St. Elias National Park and Preserve, and Yukon-Charley Rivers National Preserve. Climate in this vast area is extremely variable, ranging from a mild maritime climate along the Gulf of Alaska to a continental interior climate characterized by large variations in seasonal temperatures. Understanding how these climate patterns vary on both a spatial and temporal scale will help us to understand the myriad of ecological changes we are see-ing in the parks. The objective of the climate monitoring program is to record weather conditions at representative sites in order to identify long and short term trends, provide reliable climate data to other researchers, and to participate in larger scale climate monitoring and modeling efforts (Sousanes 2004). The location of climate sites in and around the three parks is shown in Figure 1.
Dr. Kelly Redmond, and the staff at the WRCC, compiled an inventory of climate stations for the network (Redmond and Simeral 2006), and Dr. Richard Keen, a climatologist from the University of Colorado, was contracted to provide a baseline climate analysis for the region. The preliminary results from the climate data analysis highlight relationships between the available long-term station data and climate indices such as the Pacific Decadal Oscillation (PDO) and the North Pacific (NP) Index. With this ground work done, the CAKN climate monitoring program is now poised to detect changes in climate by comparing future data from the stations with this baseline data.
Methods
The results from the analysis are based on long-term data sets or a combination of stations within and near the three units of the CAKN. Eagle, McKinley Park, and Gulkana are three stations with records greater than 80 years that are used in this analysis along with six other stations in the region, including Fairbanks, Talkeetna, Cordova, Valdez, Yakutat, and combinations of stations including McCarthy/Kennecott/Chitina and Fort Yukon/Circle/Central. For temperature analysis, monthly and annual time series were compiled. Because the Central Alaska region includes coastal areas where the annual, seasonal, and daily temperatures fluctuate less than those at interior sites such as Eagle, using station means was not useful for region-wide analysis, but determining annual average temperature departure from normals allowed for region-wide correlations. The normalized departure for each year at each station is given by:
Normalized Departure = (Annual temperature—1971-2000 normal) / Standard Deviation of annual temps
Records of precipitation are especially important for documenting climate and understanding climate effects on ecosystems, but measuring precipitation, where most of the precipitation comes in the form of snow, and where it is windy, is technically quite difficult. The only long-term station available for analysis in CAKN for year-round precipitation is the National Weather Service (NWS) site at McKinley Park; all of the other long-term sites have large data gaps. However, there are over 30 sites that measure snow and snow water equivalent (SWE) in the network that have long enough records for analysis. These sites are from a combination of the Natural Resources Conservation Service (NRCS) snow telemetry (SNOTEL) and snow course sites and NWS cooperative sites. Following the methodology used by the NRCS National Water and Climate Center (NWCC), the individual SWE for each site is expressed as a percent of the 1971-2000 average for that site and month.
Results
Temperature
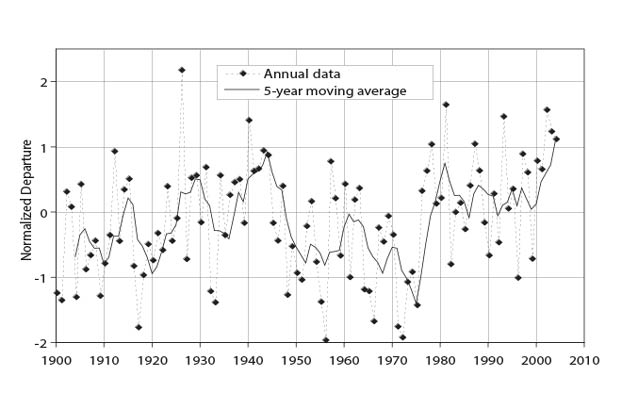
The variability among departure from normal tempera-tures from the CAKN long-term stations is consistent across the region. For summer (June-August) tempera-tures over the period of record, the correlations between the individual long term stations and the average of all nine stations range from 0.65 to 0.89. For winter (December-February) temperatures, the correlations are even better, ranging from 0.84 to 0.94. Correlations for annual mean temperatures range from 0.77 to 0.92. Figure 2 shows the departure from normal for annual temperatures plotted with a 5-year moving average. A five-year average is used to emphasize the decadal variabil-ity associated with changes in the regional atmospheric and oceanic circulations.
Precipitation
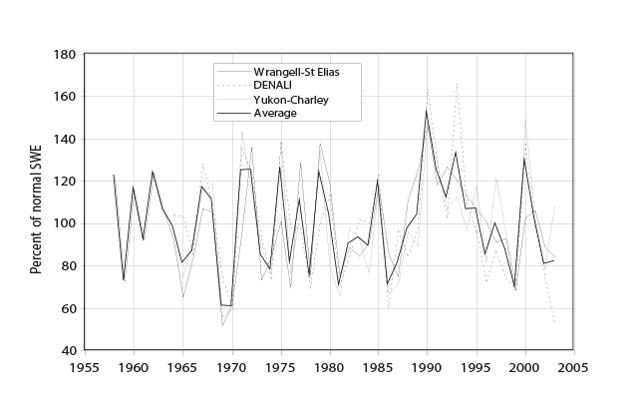
The focus for the analysis is on snow and SWE. The average correlation coefficient for SWE of 19 sites in Denali is 0.83; for the 18 sites in Wrangell-St. Elias the average correlation coefficient is 0.65, and for the nine sites in Yukon-Charley the average is 0.87. There is good correlation among sites in a single park, and the annual variations in SWE are consistent between the three parks (Figure 3). The respective correlations between Denali, Yukon-Charley, and Wrangell-St. Elias and the three unit average is 0.89, 0.87, and 0.90. Because the variations of SWE in the three units are so well correlated, the average SWE for all units combined can be used for analyzing the possible causes of variation across the network.
| Index | CAKN Winter Temperatures (Dec-Jan-Feb) | CAKN Summer Temperatures (Jun-Jul-Aug) |
|---|---|---|
| North Pacific | -0.72* | -0.34 |
| Pacific Decadal Oscillation | 0.67* | 0.22 |
Table 1. Correlations between 5-year moving averages of Central Alaska Network winter and summer temperatures and the North Pacific and Pacific Decadal Oscillation climate indices, with significance levels noted.
Discussion and Conclusions
Climate Variability and Atmospheric and Oceanic Climate Indices
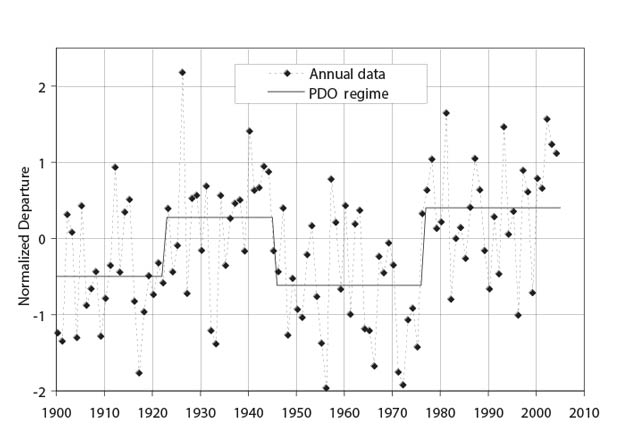
In order to explain climate variations, and in particular temperature variations in the CAKN, we looked for correlations between temperature and larger scale atmospheric and oceanic circulations. Many studies show that temperature changes in the region coincide with shifts in the Pacific Decadal Oscillation (PDO), which is a pattern of Pacific sea surface temperatures that shifts phases on a decadal time scale, usually about 20 to 30 years. During a warm, or positive, phase, the west Pacific becomes cool and part of the eastern ocean warms; during a cool or negative phase, the opposite pattern occurs (Mantua et al. 1997). In 1976, the North Pacific region, including Alaska, underwent a dramatic shift to a warmer climate with dramatic increases in winter and spring temperatures, and lesser increases in summer and autumn, when compared to the previous 25-year period (Hartmann and Wendler 2005, Serreze et al. 2000). The North Pacific (NP) climate index is closely correlated with the PDO and is a measure of the sea level pressure over the region; it is used as an indicator of the strength of the Aleutian Low. The strongest and most consistent of the observed correlations for the CAKN analysis, as in the other studies mentioned above, is between annual, and especially winter, temperature and the PDO and the NP index (Table 1). During the period 1947-1976 the Aleutian Low was relatively weak, allowing arctic air masses to engulf Alaska leading to cold winters. From 1923-1946 and from 1977 to the present, the Aleutian Low has been stronger, pushing mild maritime air into the state. The long-term temperature records used in the CAKN analyses span through two of these regime shifts. The mean annual temperatures for the nine long-term stations during the first warm phase (1923-1946) of the PDO was 31.7°F (-0.2°C), for the cool phase (1946-1977) was 29.9°F (-1.2°C), and for the second warm phase was 32.0°F (0°C). So, although the decades since 1977 have averaged two degrees F warmer than the previous three decades, those decades were in turn two degrees F colder than 1923-1945 (Figure 4). Therefore, the net change in annual temperatures since 1920 is less that 0.5 degree F. These results highlight the importance of defining the period of record when analyzing long-term trends. If a 30-year record were analyzed it would show significant warming in the region, but with 80 years of data the large decadal variability of the climate becomes more apparent. This paper does not go into detail regarding correlations with other climate indices; however the correlation with the PDO and winter temperatures is the most obvious. The correlations between precipitation (as SWE) and climate indices are weak and require further investigation, but the coherence among sites in the network will make it easier to detect changes and patterns in the region. There are many other factors influencing the climate of the central Alaska region, including potential effects from arctic Alaska, where terrestrial changes in summer albedo are contributing to high-latitude warming trends (Chapin et al. 2005). In many places in the Central Alaska region only a small shift in temperatures will change the climatic regime from one where temperatures are near freezing to one where temperatures are slightly above freezing. This phase change from ice to water limits a variety of biophysical processes, which operate on multiple spatial and temporal scales (Hinzman et al. 2005).
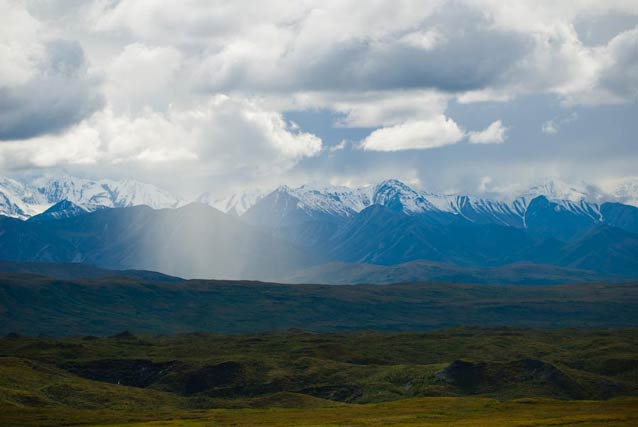
NPS Photo / Kent Miller
Acknowledgements
The data analysis for this report was done by Dr. Richard Keen; a final report will be available in 2007. The inventory report compiled by Dr. Kelly Redmond and David Simeral was funded by the National Park Service Inventory and Monitoring Program.
References
Chapin, F.S., et al. 2005.
Role of land-surface changes in arctic summer warming. Science 310: 657-660.
Hartmann, B., and G. Wendler. 2005.
The significance of the 1976 pacific shift in the climatology of Alaska. Journal of Climate 18: 4824-4839.
Hinzman, Larry D., N.D. Bettez, R.W. Bolton, F.S. Chapin, M.B. Dyurgerov, C.L. Fastie, B. Griffith, R.D. Hollister, A. Hope, H.P. Huntington, A. Jensen, G.J. Jia, T. Jorgenson, D.L. Kane, D.R. Klein, G. Kofinas, A.H. Lynch, A.H. Lloyd, A.D. McGuire, F.E. Nelson, W.C. Oechel, T.E. Osterkamp, C.H. Racine, V.E. Romanovsky, R.S. Stone, D.A. Stow, M. Sturm, C.E. Tweedie, G.L. Vourlitis, M.D. Walker, D.A. Walker, P.J. Webber, J.M. Welker, K.S. Winker, and K. Yoshikawa. 2005.
Evidence and implications of recent climate change in northern Alaska and other arctic regions. Climatic Change 72: 251-298.
Mantua, N., S. Hare, Y. Zhang, J. Wallace, and R. Francis. 1997.
A Pacific Interdecadal Climate Oscillation with impacts on salmon production. Bulletin of American Meteorological Society 78: 1069-1079.
Redmond, K.T., and D.B. Simeral. 2006.
Weather and Climate Inventory, National Park Service, Central Alaska Network.
Natural Resource Technical Report NPS/CAKN/NRTR 2006/004.
National Park Service. Fort Collins, Colorado.
Serreze, M., et al. 2000.
Observational evidence of recent change in the northern high-latitude environment. Climatic Change 46: 159-207
Sousanes, P.J. 2004.
Climate Monitoring Protocol for the Central Alaska Network. General Technical Report. Central Alaska Inventory and Monitoring Network. Denali Park, AK.
Part of a series of articles titled Alaska Park Science - Volume 6 Issue 2: Crossing Boundaries in a Changing Environment.
Last updated: February 2, 2015
